


Introduction
Magnetic resonance imaging (MRI) is the method of choice in the diagnosis of multiple sclerosis (MS) as well as in monitoring the disease’s activity [1]. In recent years many researchers have paid much attention to the correlation between radiological findings and clinical state of the patients [2].
In MS the lesion volume reflects the inflammatory feature of the disease, while atrophy measures the quantitatively neurodegenerative aspect of the disease, which play an important role in all disease stages. The issue of brain atrophy in MS patients is not sufficiently reported in the literature with regards to the nature of their clinical significance. A number of studies suggest the role of brain atrophy measures in the prediction of MS progression [1,3,4] (Figure 1).
Figure 1
Components of tissue elements contributing to brain volume loss due to multiple sclerosis pathology
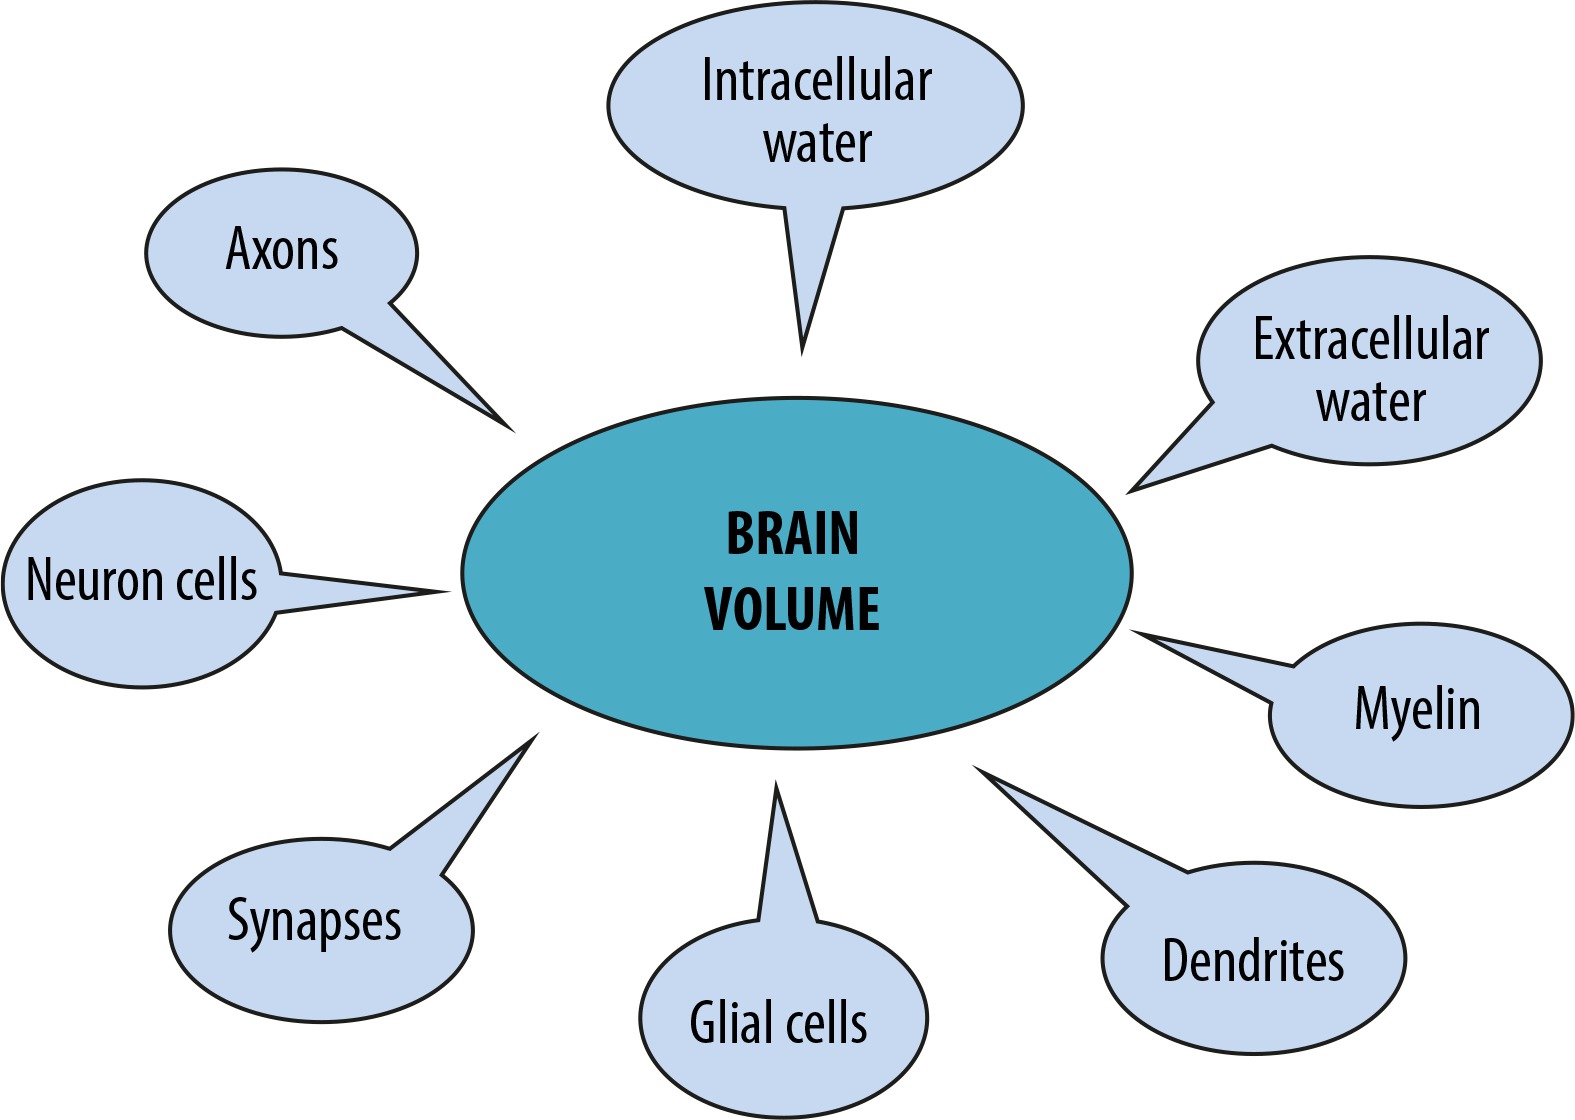
In our previous review we described the mechanisms that contribute to brain atrophy and important biological factors that can influence the accuracy of brain volume quantification [5]. Atrophy is not only seen within the lesions but also in normal-appearing white matter and grey matter. Brain atrophy is one of the most important indicators of neurodegeneration and clinical disease progression in MS patients and reflects both inflammation- induced axonal loss and post-inflammatory neurodegeneration.
However, longitudinal changes of brain volume and their correlations with clinical worsening in MS have still not been adequately investigated.
In our study we evaluated the relationship between the degree of disability in the course of MS and volumetric brain abnormalities. The primary purpose of this study was to show MRI volumetric features associated with MS. The secondary aim was to compare the results from brain tissue segmentations with clinical parameters assessing the degree of disability using the Expanded Disability Status Scale (EDSS).
Material and methods
Study population
Seventeen patients diagnosed with MS according to the revised McDonald criteria (mean age 52 years, range 34-70 years). Patients were recruited from the Department of Neurology at Wroclaw Medical University between 2014 and 2016. The main demographic and clinical characteristics of the patients are shown in Table 1.
Table 1
Demographic and clinical characteristics of multiple sclerosis (MS) patients and healthy controls (CG)
| Factor | MS | CG |
|---|---|---|
| Sex, M/F | 5/12 | 11/13 |
| Age, years: | ||
| Mean | 52 | 48 |
| Range | 34-70 | 32-68 |
| MS estimated duration (years) | 1-5 | NA |
| Type of therapy | ||
| Interferon beta-1b | 11 | NA |
| Glatiramer acetate | 1 | NA |
| Fingolimod | 3 | NA |
| Natalizumab | 1 | NA |
| Betaferon | 1 | NA |
The inclusion criteria for MS patients were: established diagnosis of MS according to 2010 McDonald Criteria, established diagnosis of relapsing remitting multiple sclerosis (RRMS) and disease duration 1-5 years.
Exclusion criteria were concomitant disorders (cerebrovascular disease, neurodegenerative disorder): positive history of alcohol abuse, psychiatric or psychological disorders, and steroid or psychoactive drug treatment in the three months preceding entry to the study.
Control group
Twenty-four healthy volunteer subjects (11 males, 13 females), age range between 32 and 68 years (mean age 48 years), with no history of neurological or psychiatric disorders were included as the control group. The inclusion criterion was normal conventional brain MR imaging.
A total of healthy controls were matched to the MS patients regarding age, sex, and educational level, as shown in Table 1.
The study protocol was approved by the Wrocław University Ethics Committee. All the procedures performed in the studies involving human participants were in accordance with the ethical standards of the institutional and/or national research committee and with the 1964 Helsinki declaration and its later amendments or comparable ethical standards. Informed consent was obtained from all individual participants included in the study.
MR imaging protocols and voxel-based morphometric assessment
Magnetic resonance imaging (MRI) of the cerebrum, cerebellum, and brain stem was performed in 17 individuals with clinically definite multiple sclerosis (MS) and in 24 control subjects. MRI examination was performed on a 1.5 Tesla scanner (Signa Hdx, GE Medical Systems) using a 16-channel head coil. Imaging was done in the coronal, axial, and sagittal planes. Data were transferred to a GE Advantage Workstation and post-processed using fully-automated software Freesurfer image analysis suite version 6.0. On the basis of the volumetric Bravo sequence, brain segmentation was performed. The total brain volume and volume of each region was computed using an interactive image analysis system. A stereotactic atlas was used as a reference for segmenting brain structures.
Bravo is one of the basic acquisition protocols for Automated Brain Segmentation, as we described in our previous paper [6]. The technical parameters of Bravo sequence are as follows: Acquisition time: 5:15 Voxel size: 1.0 × 1.0 × 1.0 mm3, Geometry: FoV 25.6 cm (256 × 256 matrix), 176 sagittal slices, and slice thickness 1 mm. High-resolution, three-dimensional (3D) sequences are preferred for measurement of brain volume because they provide excellent T1w contrast between grey and white matter and are good for showing anatomical details.
Neurological assessment
All patients had a full neurological examination at the time the MRI scans were performed and after a two-year follow-up. The disability assessment was performed using the EDSS (Kurtzke 1983) scale to evaluate the intellectual and functional impairments of MS. The occurrence of clinical multiple sclerosis relapses during the study period was also assessed.
Patients were observed neurologically by the same neurologist, who was unaware of the MRI results. At follow-up evaluations, patients were considered clinically worsened if they had an EDSS score increase of > 0.5 compared to the baseline.
EDSS is the most widely-used measure for assessing the degree of neurological impairment in MS within eight functional systems:
pyramidal – weakness or difficulty moving limbs,
cerebellar – ataxia, loss of coordination or tremor,
brainstem – problems with speech, swallowing, and nystagmus,
sensory – numbness or loss of sensations,
bowel and bladder function,
visual function,
cerebral (or mental) functions,
ambulation.
The total score of EDSS ranges from 0 to 10.
At the end of the study we decided to classify the patients according to their cognitive status as follows:
disability regression—patients who presented at least 0.5 improvement from the baseline status in the EDSS test,
disability progression—worsening required at least 0.5 decreased EDSS score from the baseline status,
stable patients—patients not meeting the above-mentioned criteria were classified as stable.
The relationship between atrophy measures and clinical signs was investigated.
All procedures performed in studies involving human participants were in accordance with the ethical standards of Wroclaw Medical University.
Statistical analysis
Statistical analyses were performed to determine associations between volumetric parameters and the degree of disability measured by EDSS for the MS group. Continuous variables were expressed as mean ± standard deviation in the case of normal distribution and median with interquartile range for non-normal distribution. Normality of distribution was verified using the Shapiro-Wilk W test. For variables with normal distribution, the ANOVA and Turkey post-hoc tests with correction for non-equal number of cases were used to evaluate differences between the examined groups. The non-parametric Kruskal-Wallis test was used to compare non-normal variables. P values < 0.05 were considered as statistically significant. The median and range of values were reported. STATISTICA software 13.0 (StatSoft) was used for this purpose.
Results
Neurological assessment
Mean EDSS score at baseline was 3.029 (range 1.0-6.0). At the end of the follow-up period we found significant deterioration from baseline data for disability (mean EDSS 3.34, range 1.0-7.0). Overall, seven patients (41.1%) were judged as cognitively worsened (MS1 group – patients with deterioration) at the end of the follow-up, and 10 subjects (58.9%) remained stable (MS0 group – patients without deterioration). There were no patients who showed improvement.
MRI and brain volume changes
Whole brain volume measurement has been established as a robust measure to differentiate the level of atrophy in MS patients, compared to age- and sex-matched healthy individuals. Compared with healthy controls, MS patients during the follow-up period displayed significant decrease in brain parenchymal volumes in several areas within grey matter. Regions of significant brain parenchymal volume changes are presented in Table 2.
Table 2
Mean volumes of certain brain structures in the whole multiple sclerosis group (MS) and control group (CG)
| Location | Mean volume | p values* | |
|---|---|---|---|
| MS | CG | MS/CG | |
| Left Broca’s area (pars triangularis) | 3776.4 | 4223.8 | 0.0062 |
| Right somatosensory area | 2307.5 | 2482.5 | 0.0423 |
| Right Broca’s area (pars opercularis) | 7171.5 | 8099.2 | 0.0197 |
| Right primary motor area (anterior) | 2761.0 | 3112.9 | 0.0122 |
| Right superior temporal sulcus (parallel sulcus) – grey matter volume | 7911.2 | 8948.00 | 0.0404 |
| Right lateral orbital sulcus – grey matter volume | 489.0 | 621.2 | 0.0035 |
| Left insula cortex – grey matter volume | 5968.4 | 6404.5 | 0.0499 |
| Left lateral division of orbitofrontal cortex – grey matter volume | 2866.1 | 3237.5 | 0.0177 |
| Right orbital gyri – grey matter volume | 5786.8 | 6261.7 | 0.0373 |
| Left orbital gyri – grey matter volume | 5336.1 | 5807.1 | 0.0475 |
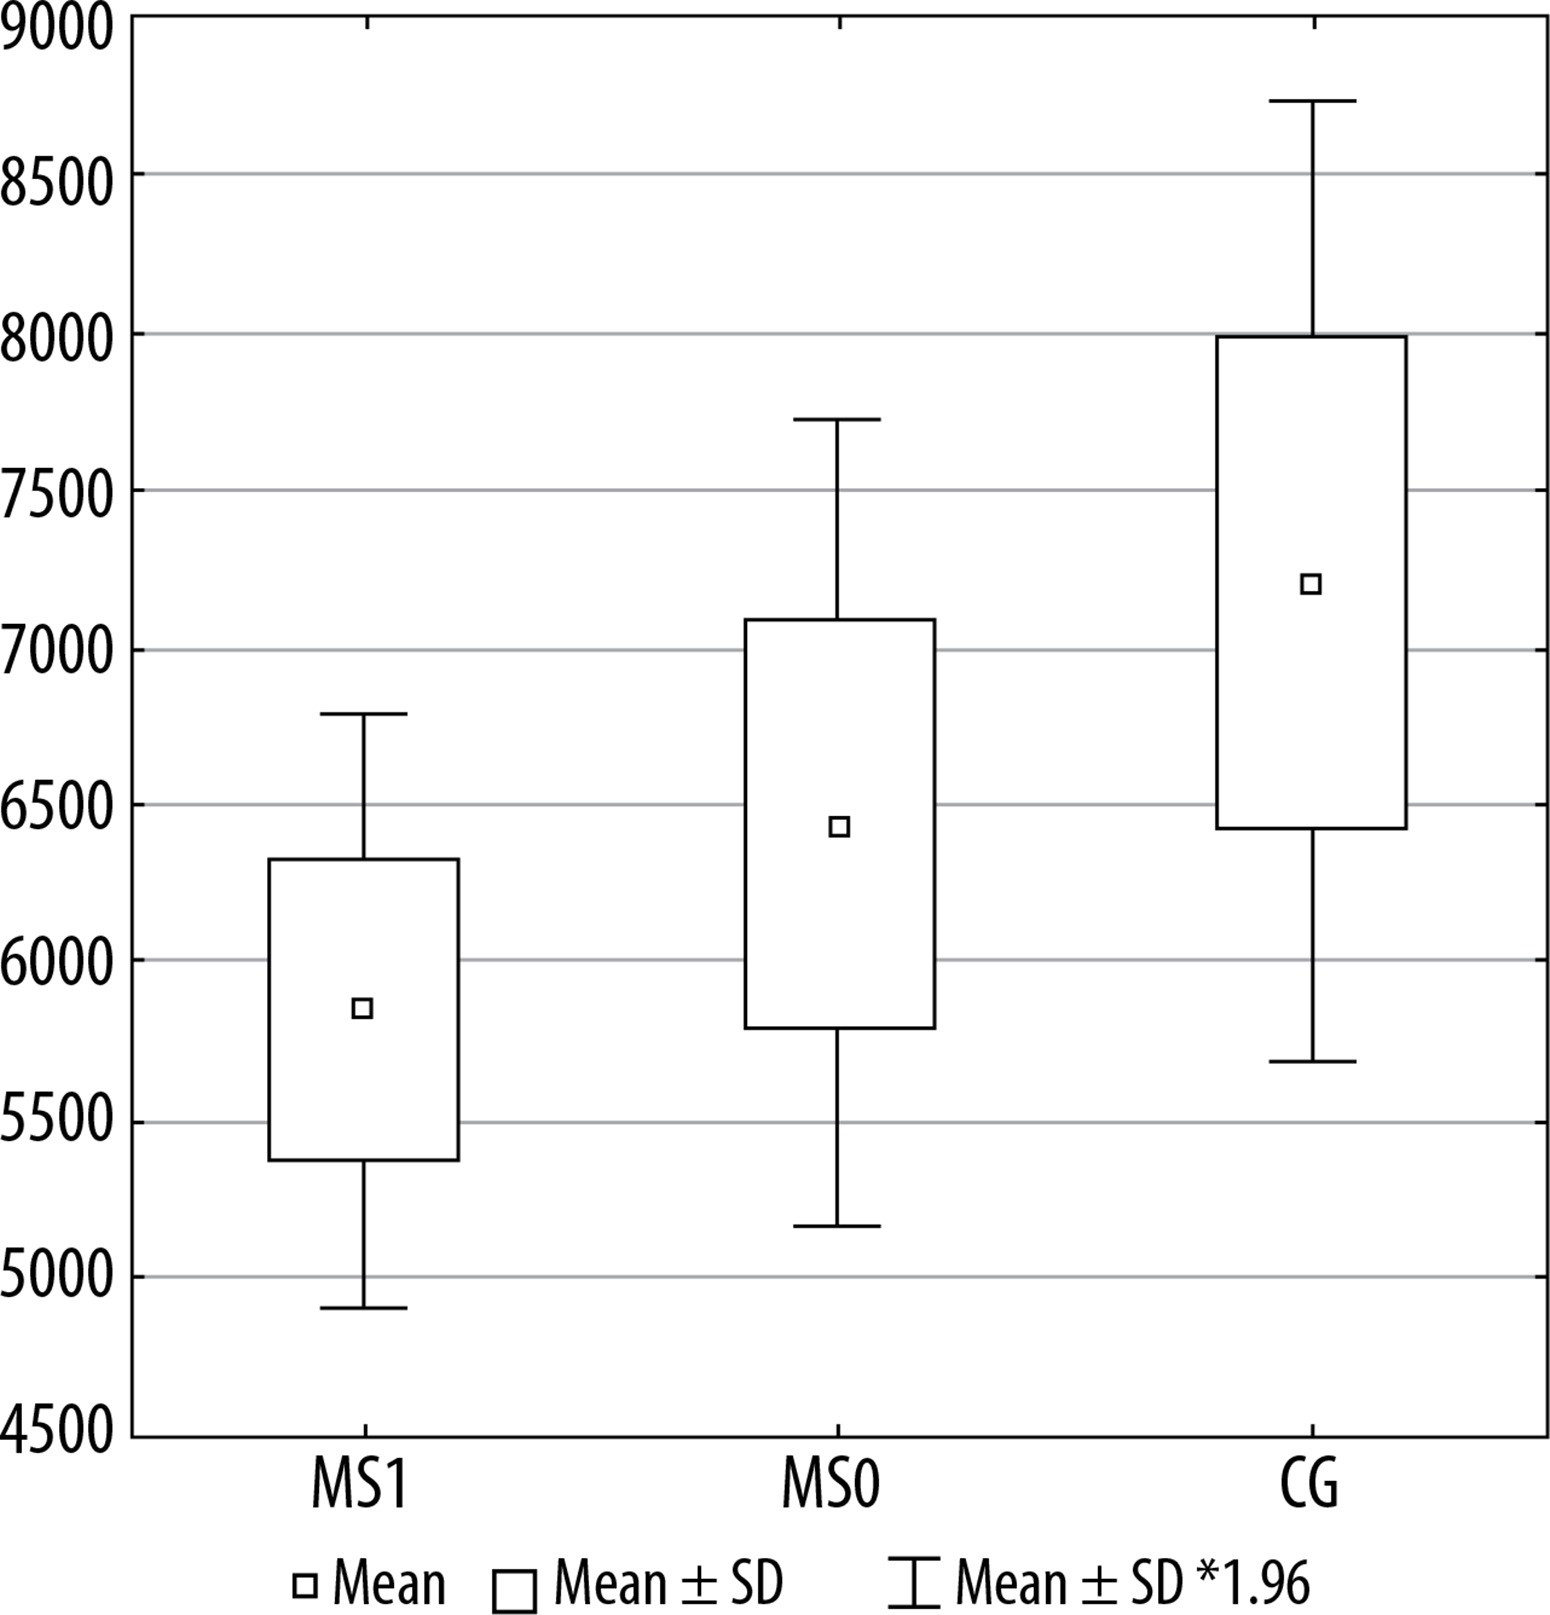
Figures 2, 3, and 4 present a comparison of volumes of selected cerebral areas in particular groups.
Figure 2
The horizontal ramus of the lateral sulcus volume in individual groups. MS1 –patients with progression, MS0- patients without progression, CG –control group
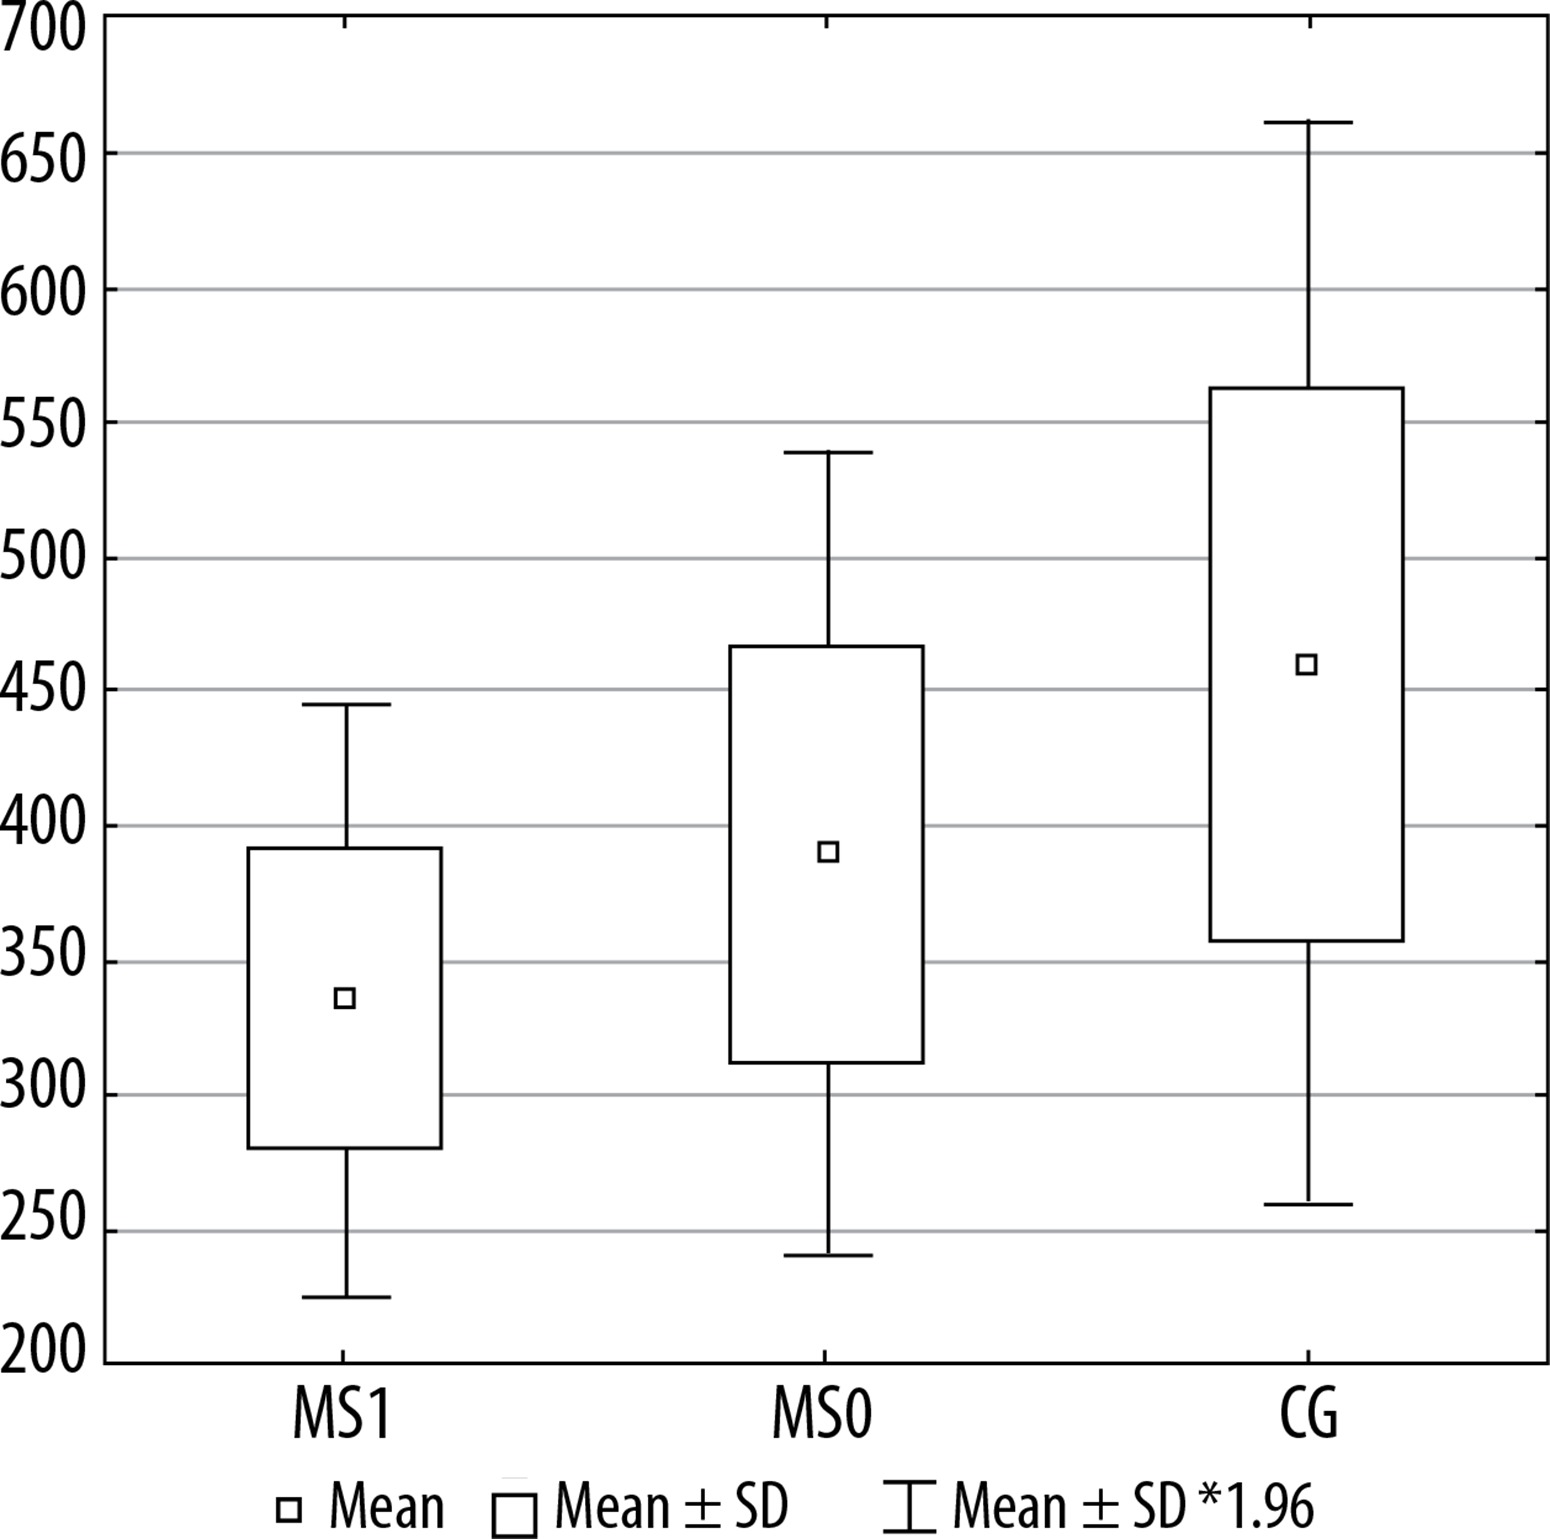
Figure 3
Right anterior part of the cingulate gyrus volume in individual groups. MS1 – patients with progression, MS0 – patients without progression, CG – control group
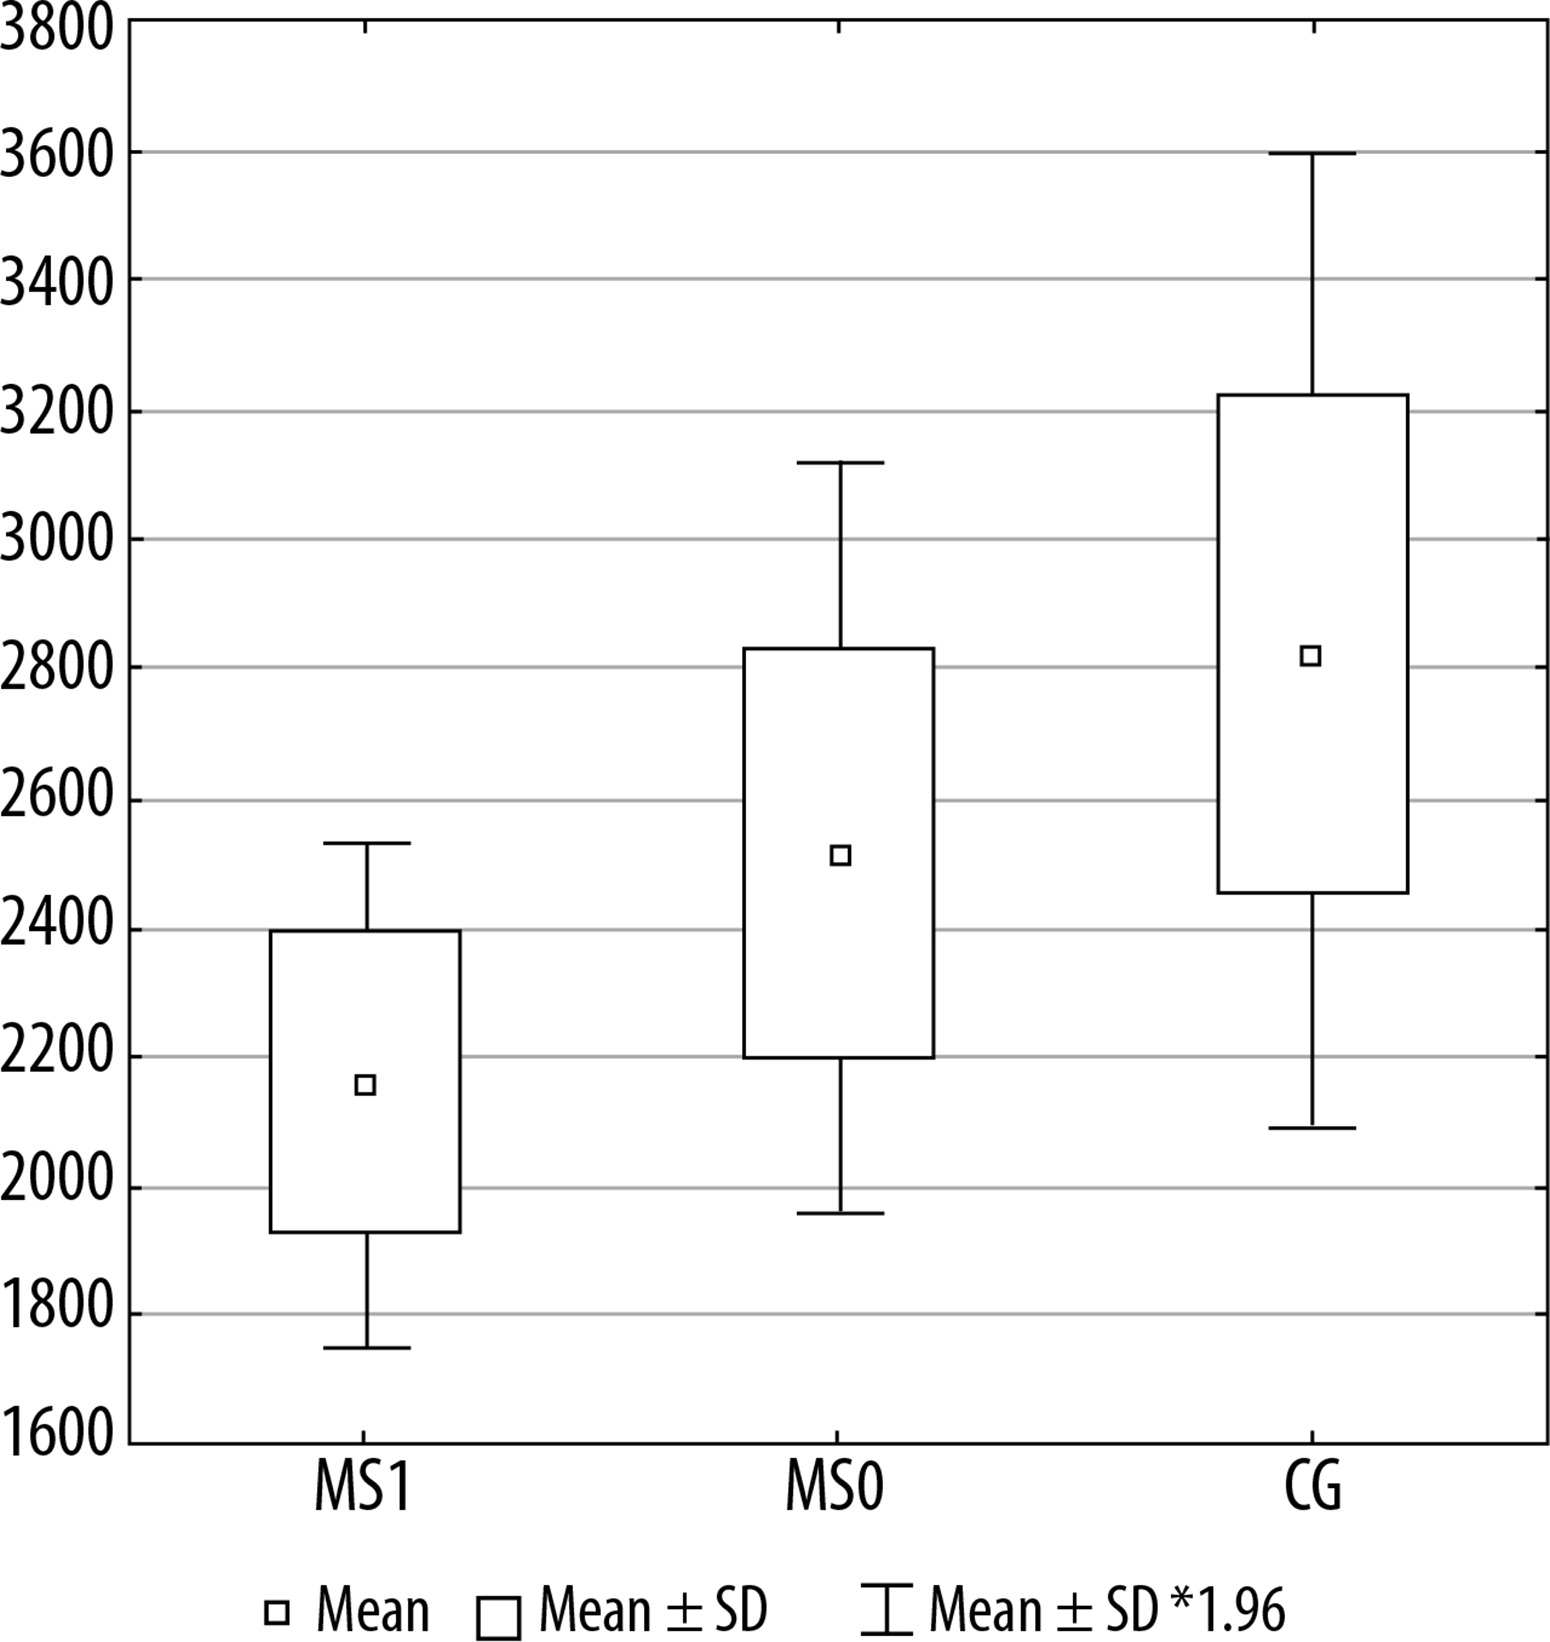
Figure 4
Lateral orbitofrontal cortex volume in individual groups. MS1 – patients with progression, MS0 – patients without progression, CG – control group
The white matter did not show a significant rate of volume loss in MS patients compared to healthy controls.
When we compared the rate of volume loss across different regions in all MS patients together, compared with CG, the greater decline was observed in the four grey matter regions – Table 2.
Comparison of the MS0 (patients without deterioration) and CG groups
Compared with the healthy control group, MS patients without progression showed significantly higher volume loss within the following four areas: left straight gyrus (gyrus rectus) (p = 0.021), left planum polare of the superior temporal gyrus (p = 0.028), horizontal ramus of the lateral sulcus (p = 0.030), and left Broca’s area (pars triangularis) (p = 0.097).
Comparison of the MS1 (patients with deterioration) and CG groups
Significantly higher volume loss in MS patients with progression compared with healthy controls was observed within 14 grey matter areas (Table 3).
Table 3
Mean volumes of certain brain structures in different groups: multiple sclerosis group without neurological deterioration (MS0), with neurological progression (MS1), and control group (CG). Turkey test with correction for non-equal groups. *Kruskall Wallis test
Comparison of the MS1 (patients with deterioration) and MS0 groups (patients without deterioration)
Significantly higher volume loss was found in MS patients with progression compared to those with stable disease in several areas (Table 3).
Discussion
Multiple sclerosis is a chronic autoimmune disease that causes neurological problems and results in progressive disability.
Multiple sclerosis-related brain atrophy is a consequence of both underlying pathology (neuroinflammation) and neuroaxonal loss. Brain volume loss in MS patients occurs at a faster rate than in the healthy population: 0.5-1.0% vs. 0.1-0.3% per year [7,8]. Atrophy may be found early in the disease course even before clinical symptoms and lead to long-term neurological disability [9,10].
Magnetic resonance imaging (MRI) is an important tool not only in the process of diagnosis but also in the monitoring of disease activity and predicting treatment efficacy [11]. In the literature there is still inconsistency regarding MRI protocols and the frequency of neurological examinations.
The primary objective of this study was to evaluate the correlation between MR-based quantitative brain volume changes and clinical deterioration in the course of MS [12].
There are several freely available tools for automated brain volumetry that are commonly used in MS patients. In our study we chose one of the most popular software packages – FreeSurfer [13-16]. These automated techniques express the results as a percentage of the change in brain volume.
Until now, EDSS has been a widely-accepted measure of clinical disability in MS patients and can provide useful information about the clinical state of the patients.
There are several limitations when using EDSS alone as an outcome measure. First of all it is based on neurological examination, which is inherently subjective [17]. Furthermore, the number of relapses strongly depends on the frequency of medical visits during the trial duration [18,19]. These factors may confound the interpretation of relapse rate reduction in treatment trials. Also, the clinical state of the patient does not reflect the true activity of MS in the central nervous system [20]. These factors potentially limit the use of EDSS as a separate measure.
Our study demonstrated that a remarkable part of the study population had worsening disability (41%). These correlations existed throughout the disease course and in all clinical phenotypes.
The white matter did not show a significant rate of volume loss in MS patients and healthy controls. Our results are consistent with other reports [8] indicating that relationships between whole brain atrophy and clinical changes are weak or absent. Overall cognitive impairment did not correlate significantly with age, disease duration, and type of treatment.
The more detailed post-hoc analyses showed the following baseline grey matter volumes: right somatosensory area (p = 0.000538), paracentral lobule (p = 0.007), right short insular gyri (p = 0.007), and left Broca’s area (pars triangularis) (p = 0.003) were associated with future EDSS progression. Our findings suggest that volume loss of these regions might become biomarkers of clinical disability progression. From all of them the right somatosensory area volume had the highest predictive value of EDSS progression during follow-up (p = 0.000538).
The primary somatosensory cortex is located in the postcentral gyrus in the parietal lobe and is responsible for processing somatic sensations – detecting touch, proprioception, and temperature. The somatosensory cortex receives all sensory input from the opposite side of the body. The damage in this area results in ignorance of certain body regions or even agnosia. On the basis of the above results, we put forward a hypothesis that impairments in somatosensory function may be the most sensible to atrophy and become an indicator of neurological impairment in multiple sclerosis.
These differences in mean volume values should be regarded as not significant, due to the small size of the groups and low power calculations: about 0.5 for t-tests for dependent variables (comparisons before and after treatment) and about 0.25 for independent variables (comparisons with the control group). We therefore plan to repeat the measurements on the same scanner and on a larger cohort of patients to confirm our preliminary results.
The recent findings support the importance of the early use of disease modifying therapy in clinically asymptomatic patients without remarkable physical disability. Clinical assessment can be improved by using EDSS in conjunction with MRI measures. Furthermore, the quantification of atrophy rate may become a useful outcome measure in neuroprotective clinical trials.
The importance of measuring brain atrophy in the course of MS is widely raised in the literature. Zivadinov et al. investigated the association between cortical and subcortical volume changes and disability progression [21]. After five years of follow-up, patients with sustained disability progression (SDP) had significantly greater percentage of atrophy rates compared with those without SDP in the whole brain volume (p < 0.0001), cortex (p = 0.001), total grey matter (p = 0.003), and thalamus (p = 0.01). The same author reported also that thalamic atrophy and increase in lateral ventricle volumes in clinically isolated syndrome (CIS) is associated with an increased risk of conversion to MS [22].
In our previously published review we analysed the then current available evidence regarding the role of brain atrophy measurements and its consequence in MS patients [23]. Grey matter atrophy develops faster than white matter atrophy and correlates with physical and cognitive disability.
Calabrese et al., in their study, suggested an association between cortical and deep grey matter atrophy and the development of fatigue in relapsing-remitting multiple sclerosis. A significant atrophy of striatum, thalamus, superior frontal gyrus, and inferior parietal gyrus was observed in fatigued patients compared with non-fatigued patients [24].
Similar findings were observed by Batista et al. [25], who reported a slower information-processing speed measured by the Paced Auditory Serial Addition Test (PASAT) and the Symbol Digit Modalities Test (SDMT) in those with greater atrophy of subcortical structures including the thalamus and the caudate.
Our study was not designed to assess the effect of treatment on atrophy rates; nevertheless, all the patients were receiving disease modifying treatments during the entire study period. The majority (82%) of patients were receiving interferon or fingolimod.
Therefore we are not certain whether the treatment administration influences the accuracy of brain atrophy quantification, although in the literature we found many reports confirming that the rates of atrophy in all clinical phenotypes were similar in people who were receiving disease-modifying treatments to those who were not [8,26]. We suppose that drug effects are unlikely to be confounders of our analysis.
The quantitative magnetic resonance-based techniques are potentially valuable outcome measures in MS. In the last decade there have been a number of reports considering brain atrophy as an important endpoint for determining future progression of physical and cognitive disability and for assessing the efficacy of disease-modifying treatment [27-29]. Such innovative techniques are potentially valuable. They allow multiple or continuous assessment, which might give a more adequate picture of a patient’s disability and the impact of the disease on daily life .
However, the assessment of brain atrophy is still not included in the standard clinical monitoring of MS patients. Identification of progression or neurodegenerative changes remains very challenging. There is an increasing need to define simple, accurate, and reproducible brain volume measures that can be used in clinical routine.
The main strength of our report is the use of a quantitative assessment of MRI and its correlation with clinical parameters, which provides additional insight into disease activity in MS.
Our study also has some limitations, mainly concerning the small number of patients. There is a fear that such a sample size might be too small to ensure adequate power. Nevertheless, this study is a preliminary study with a relatively small sample size and short follow-up period, and we plan to continue our research.
All the examinations were performed by the same experienced neurologist specialising in multiple sclerosis, who was unaware of the MRI results. The same tests were used at the baseline and at the end of the two years of follow-up. We have provided robust measures of the whole brain volume. All patients underwent the same protocol and on the same MRI scanner over time.
What is of interest is that the volumetric parameters were measured once. Considering that atrophy accumulates slowly over time, longer follow-up is needed to detect significant changes. Secondly, anti-inflammatory therapies may cause a decrease in brain volume due to the resolution of inflammation and oedema and should not be regarded as true neurodegeneration. This effect, called pseudoatrophy, may last up to one year after initiation of treatment [30-32].
Therefore, further studies with larger sample sizes and longer follow-up at two different time points are warranted to confirm our results.
While there is a need to translate measurement of brain atrophy to clinical routine at the individual patient level, there are still a number of challenges that must be overcome, including biological confounding factors such as ageing, dehydration, and menstrual cycle. Brain volume changes in MS are the result of volume-gaining and volume-losing processes – neuroinflammation, neurodegeneration, and remyelination. Nevertheless, we strongly highlight the opinion that MRI-based volumetry should commonly be used in everyday clinical practice because it provides comprehensive characteristics of a patient’s clinical status.
Conclusions
In conclusion, our results indicate that the loss of grey matter in multiple sclerosis could be one of the essential factors responsible for progression of physical disability and cognitive deterioration in the course of the disease. The use of the EDSS score, together with MRI volumetric measures, ensures a reliable correlation between radiological appearance and clinical state and provides the best characteristic of functional impairments in MS. MRI-based volumetry could be an attractive non-invasive neuroimaging biomarker in the prediction of future disability progression. Therefore, it should be used inseparably in a clinical routine in order to identify patients at the highest risk of disease progression as soon as possible.