


Introduction
The term leukoaraiosis (LA) refers to the changes in the white matter regions of the brain. These changes appear on computed tomography (CT) scans of the brain in hypodense lesions and result from poor blood flow, which is mostly symmetrical. Leukoaraiosis was presented by Hachiński in 1987, and it refers to computed tomography scans, which, together with usage of magnetic resonance imaging (MRI), were soon adopted to interpret MRI appearance of hypertension on T2-weighted images as well as FLAIR (fluid-attenuated inversion recovery). MRI is currently the preferred method from CT because in MR the soft tissue is present in perivascular gliosis (mainly appearing in FLAIR), causing small blood pooling images to show up as hyperintense lesions. Micro damage of astrocytes, the main support cells often referred to as bridge structures of the brain, are apparent on a macroscopic scale in both CT as well as in in MRI. Astrocytes have the ability to seal the injury site by regulating formation and indirectly regulate inflammatory response; the whole process up close may look like a newly formatted membrane.
Small blood vessel disease of the brain (SVD) has a high range of meaning with pathological processes, which affect the structure or function of venous and arterial blood vessels in the brain. This term is widely used in radiology, clinical trials, and pathomorphology [1]. For years, authors have recommended in MRI the term white matter hyperintensity (WMH) of presumed vascular origin in order to distinguish changes associated with SVD from changes in multiple sclerosis (MS), leukodystrophies, and lots of fluid-filled spaces surrounding certain blood vessels, also known as a Virchow-Robin space [2-4]. The damage that causes the LA type depends on the topography on cerebrum vascularity and results from insufficient blood flow in the brain as a consequence of its location in deep structures of the brain supplied by lenticulostriate arteries [3,5]. According to medical experts in this area there are several causes responsible for developing SVD-like arteriolosclerosis, sporadic and hereditary cerebral amyloid angiopathy, inherited or genetic small vessel diseases distinct from cerebral amyloid angiopathy, inflammatory and immunologically mediated small vessel diseases, and venous collagenosis [1].
Results from previous research show correlation between ongoing changes in SVD from magnetic resonance scans and post-mortem assessment. An intriguing fact is that in the case of pathomorphology analysis there is evidence of transient ischaemic attack, which is not evident in “standard” MR brain images (using measurement of two different relaxation times – T1 and T2, as well as FLAIR, SWI, DWI sequences and ACD maps [6]). In addition to the above research data, the authors point out the changes in normally appearing white matter (NAWM) in which, in the microscopic image, we can observe astrocytic glial cells [4]. The above results confirm the “deceptive” character of small vessel disease of the brain. SVD is recognised by its complex clinical impact, from asymptomatic process (when the patient does not show neurological damage, but changes may or may not be evident in neuroimaging) to lacunar stroke, ischaemic stroke, and its less or more serious consequences, which results in a smaller or larger focal point of stroke with the clinical indicator of neurological deficit [1,3,7]. According to the latest updated published articles and medical journals, 10% to 30% of all ischaemic strokes are due to SVD [5]. Above all, SVD is without a doubt a cause of dementia – cognitive impairment, and motor and behavioural changes [1,4,7].
Some authors emphasise the evident relationship between frequency and intensity of SVD with cerebral atrophy including general or focal atrophy, symmetrical or asymmetrical, or tissue selective (corpus callosum atrophy, hippocampus atrophy); however, brain atrophy is not typical for SVD [2,5,8]. Central atrophy is evident due to the extended size of the ventricular system and basal ganglia atrophy [2]. It is important to recognise that brain atrophy is a sign for ongoing vascular insufficiency and is without a doubt an indication for an advance ischaemia. Brain atrophy can be tested with different scales, for example the Pasquier scale, which provides a subjective evaluation because of its overall visual analysis. An alternative method to the Pasquier scale is adoption of a standardised rating scale and implementation of new upgraded computer software solutions, which are still unavailable in most clinics [9,10]. The connection between clinical image during acute ischaemic stroke and changes in the presence of leukoaraiosis using the van Swieten scale from progressive brain atrophy is crucial and interesting to clinicians and researchers.
An important aspect is the fact that there are no technical possibilities – in contrast to large vessels – for the assessment of small vessels by use of MR or CT angiography. There are available advanced techniques that are not used in convectional examination. Analysis of changes in the white matter of the brain allows indirect assessment of the small vessels of the central nervous system [1].
Due to the assessment of LA and atrophy treated as markers of the severity of ischaemic stroke, modification of primary prevention will be possible; therefore, the authors undertake a thorough analysis of the correlation of the severity of ischaemic stroke with the extent of LA and the accompanying brain atrophy.
Material and methods
Head CT scans of 77 patients admitted from the emergency room (ER) of Independent Public Clinical Hospital No. 1 in Zabrze to the Neurology Department due to suspected stroke underwent retrospective radiological assessment. The study group consisted of 33 women and 44 men aged 50-93 years (age range for women was 64-93 years, for men: 50-92 years).
Only studies fulfilling the following criteria were turn on to analysis: brain CTs of patients with suspected stroke, who were referred from the adult ER department; CT scans performed in accordance with the central nervous system imaging protocol to ability to assess using a dedicated diagnostic station that allows changes of image window width to be made. Leukoaraiosis was evaluated as grade 0 to 4. The ability to perform measurements of brain structures according to the scientific method. Assess stroke severity in the NIHSS scale.
Exclusion criteria were as follows: incomplete CT examination or image artefacts (due to movement, foreign bodies, beam hardening); pathologies influencing density of the nervous system tissue, e.g. extensive brain stroke and pathologies causing mass effect, such as intracranial haemorrhage, tumours, inflammatory lesions (i.a. abscesses) or congenital defects associated with broadening of brain ventricles.
There are many scales that help with the assessment of hypodensity/hyperintensity changes in imaging. The van Swieten scale, for example, developed to test pathological regions in CT scans, and the Fazekas scale, used to compute the amount of white matter hyperintense lesions in MRI [11]. The van Swieten scale is used to test leukoaraiosis in CT scans by analysis of white matter hypodense lesions observed in the anterior and posterior areas in a specific examination slices: the slice through the choroid plexus, the slice through the cella media and the slice through the centrum semiovale. There is a three-point scale: 0 – no changes, 1 – moderate changes in white matter, 2 – severe changes stretching out to subcortical structures. After computing points from the scale, this assessment represents the entire white matter lesions with value of 0-4 [11,12] (Figure 1).
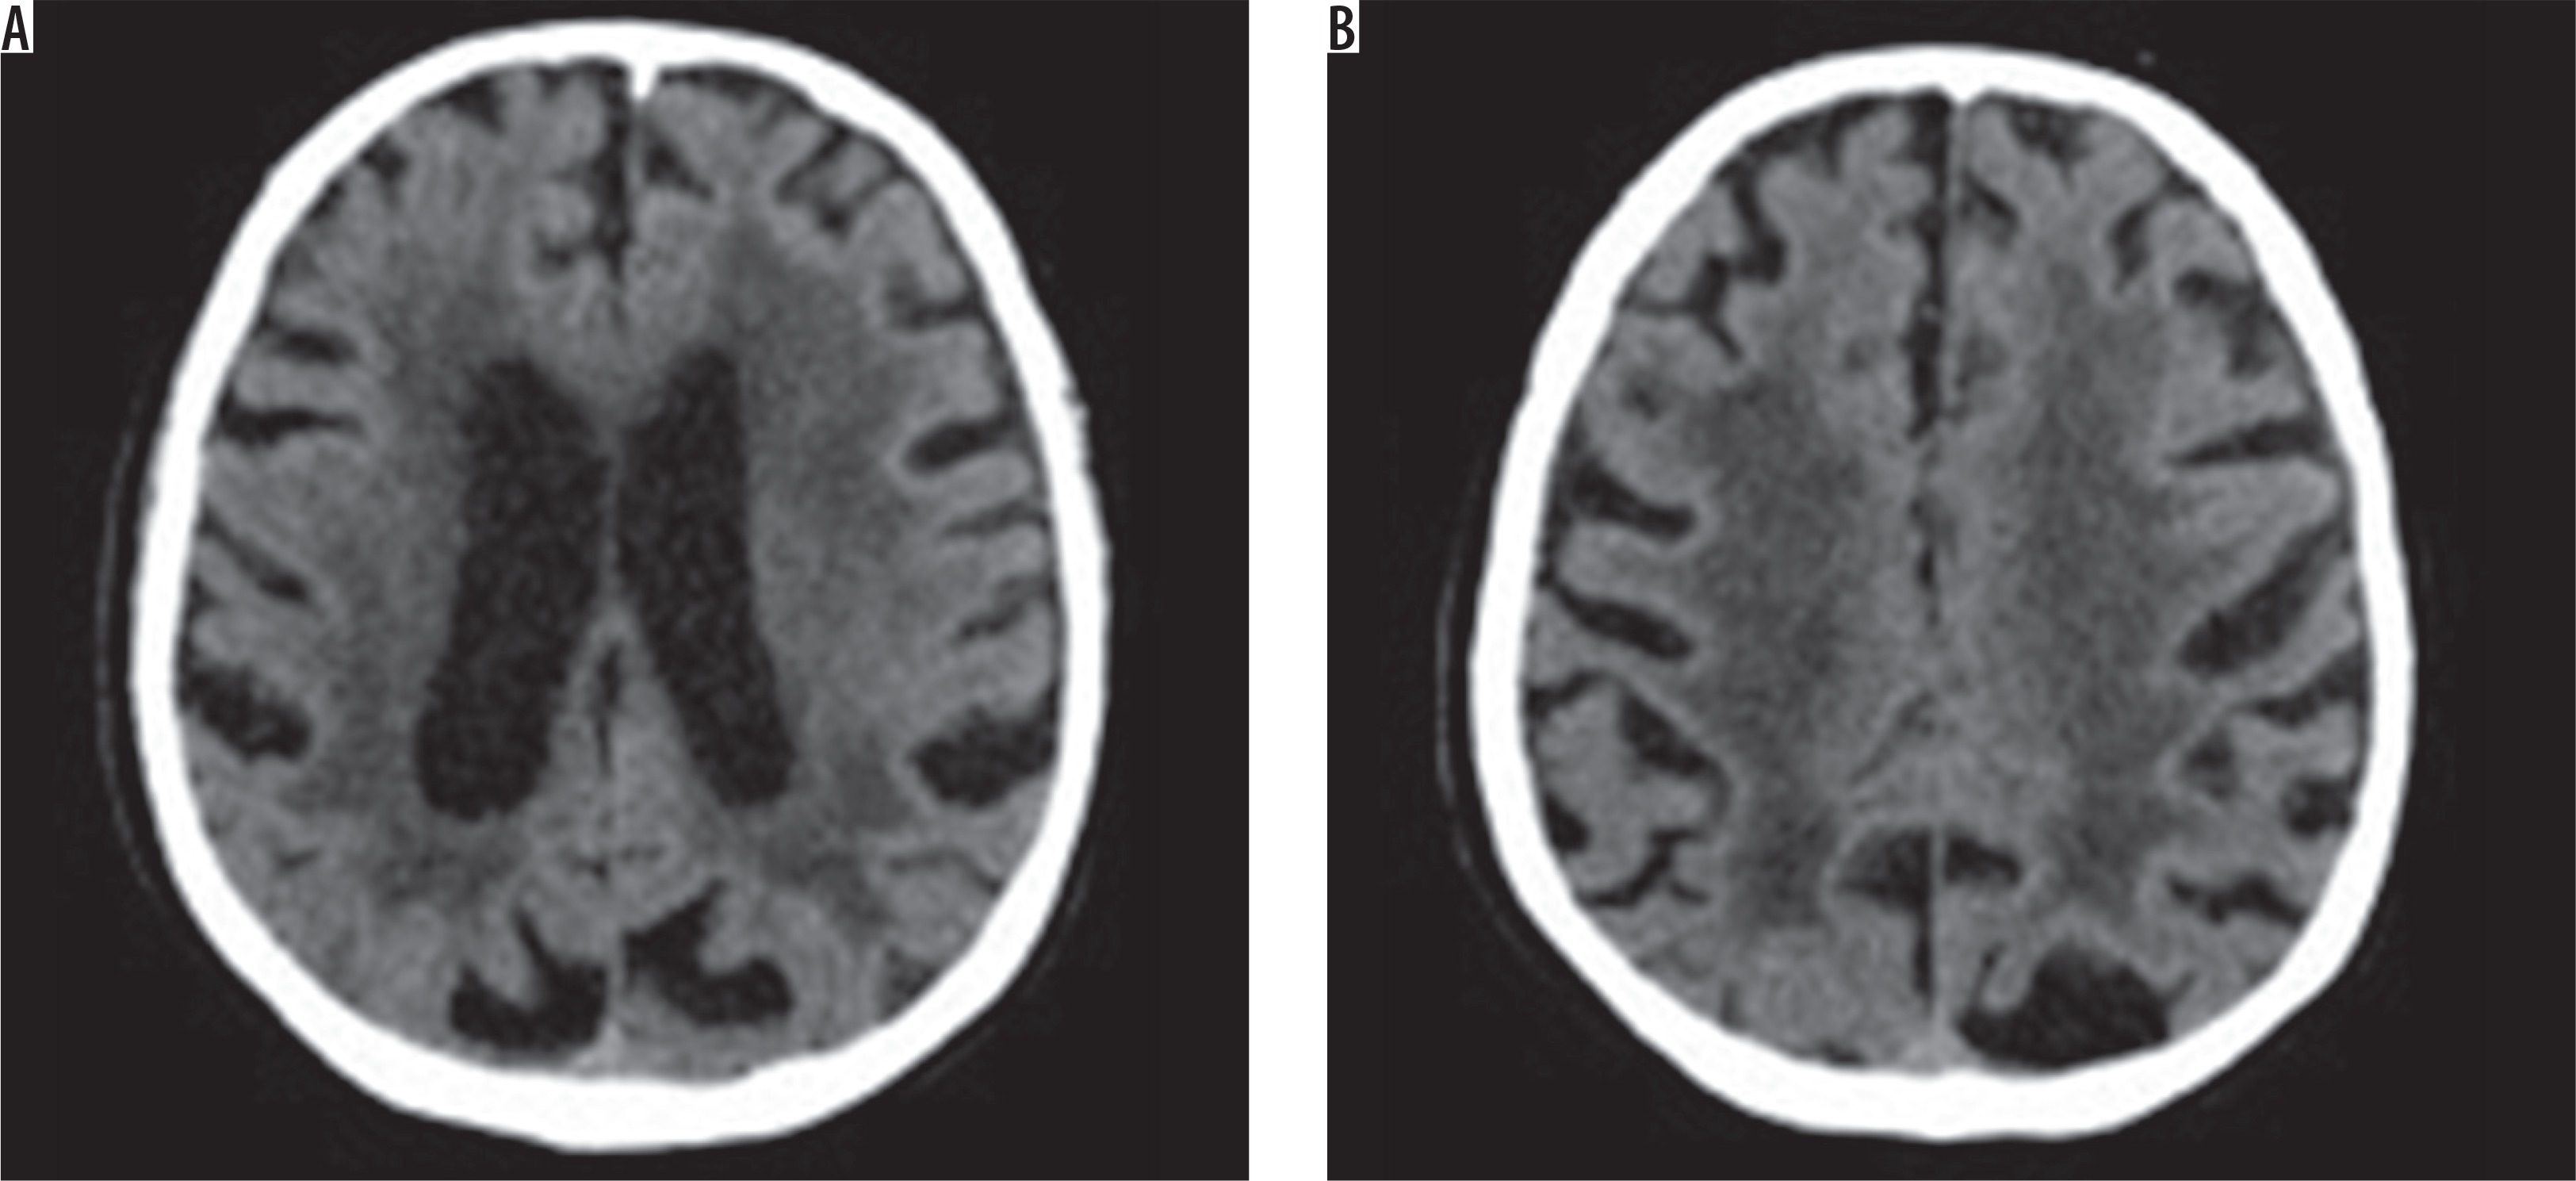
Figure 1
Computed tomography brain images at the level of the ventricular system and semiovale centres show the hypodense areas of the type of leukoaraiosis – grade 4 on the scale by van Swieten (diffuse hypodense lesions are seen around the ventricles and in the semiovale centres)
CT scans were assessed for the severity of leukoaraiosis using the van Swieten scale. Patients were subsequently divided into two groups: LA1 and LA2, depending on the degree of advancement of lesions (patients with 0-2 points on van Swieten scale were included in LA1 group, while patients with 3 and 4 points comprised the LA2 group).
Numerous linear measurements were performed in order to evaluate the morphology of fluid-filled spaces of the central nervous system, and the number of indexes were determined on their basis [10] (Table 1).
Table 1
Indexes determined on the basis of linear measurements of the central nervous system
The degree of intensity in the above changes can be evaluated with many other clinical scales, for example the NIHSS scale, modified Rankin Scale, and the Hachinski Ischaemic Scale. The National Institutes of Health Stroke Scale (NIHSS) is a widely used method to measure stroke-related neurological deficit. The NIHSS is a 15-item neurological examination stroke scale that evaluates the level of consciousness, motor strength, ataxia, dysarthria, aphasia, extraocular movement, sensory loss, and neglect. Severity of stroke in the NIHSS scale was assessed by a neurologist in all patients on admission.
Statistical analysis was conducted using Statistica 12.5 software. First, the sample distribution was examined using the Kolmogorov-Smirnov test. Student’s t-test was used to compare variables that followed normal distribution, while the U Mann-Whitney test was applied to variables without normal distribution. The Loeven test was used to check for homogeneity of variance. Results were presented as means, standard deviations, medians, and quartiles. Chi2 test with Yates’s correction for continuity was used to compare group sizes. Results were presented as numbers and percentage values. The p-value of < 0.05 was assumed as significant.
Results
In the study group more severe leukoaraiosis-type lesions (grade 3 and 4 on the van Swieten scale) were noted among 42 patients (54.5%), more often in men (n = 25).
Statistical analysis failed to demonstrate differences between LA1 and LA2 groups with regard to stroke severity in the NIHSS scale.
There were no differences with regard to clinical severity of stroke between the study groups divided depending on the extent of brain atrophy.
In the group of studied patients, we demonstrated a relationship between the extent of leukoaraiosis and brain atrophy as reflected by linear measurements of fluid-filled spaces of the central nervous system (CNS) and indexes calculated on the basis of those measurements (Figure 2).
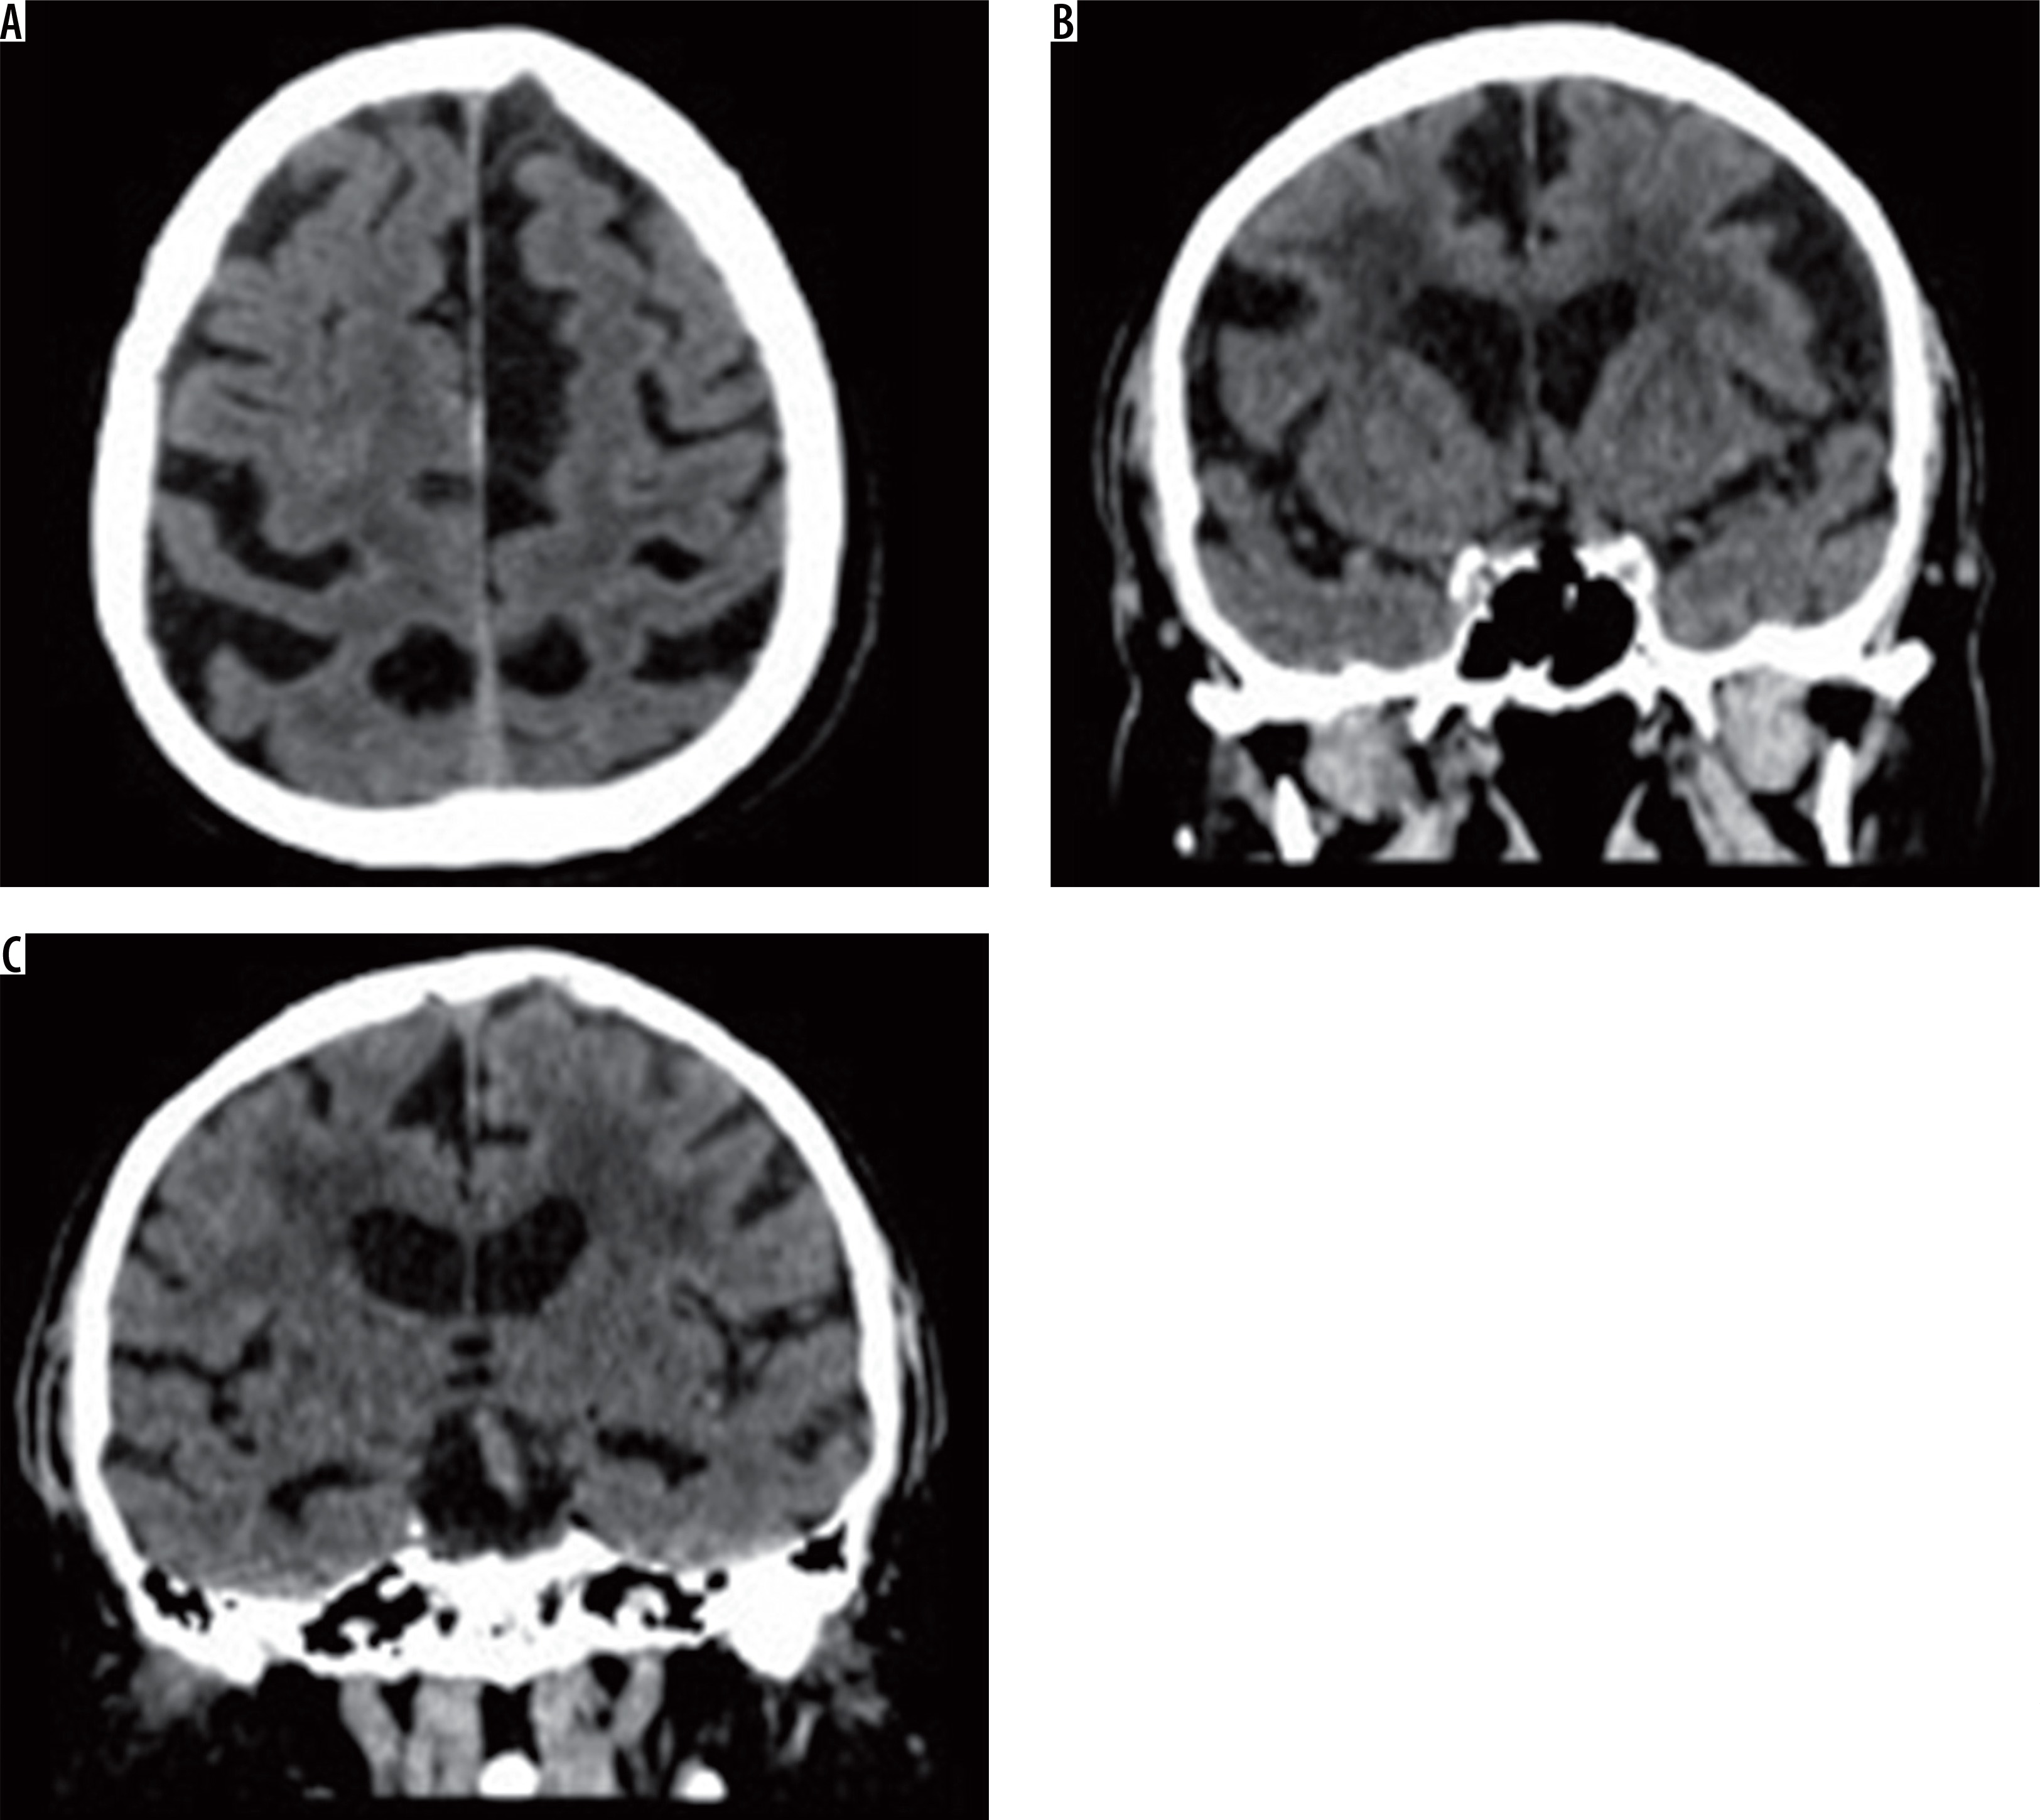
Figure 2
Axial and coronal slices of brain computed tomography show severity changes of the type of leukoaraiosis, and brain atrophy (prominent cerebral sulci and widening of the ventricular system)
There were statistically significant differences with regard to the anterior horn width of the right and left lateral ventricle (AHD, AHS), posterior horn width of the right and left lateral ventricle (OHD, OHS), distance between occipital horn of the left lateral ventricle and internal surface of the cranium (DOHS), and third ventricle width (III ventricle) depending on the severity of leukoaraiosis. The results are presented in Table 2.
Table 2
Relationship between linear measurements of fluid-filled structures of the central nervous system and severity of leukoaraiosis in groups LA1 and LA2
Mean values of indexes describing the degree of brain atrophy differed between LA1 and LA2 groups for such parameters as: Huckmann number, bicaudate index, bicaudal index, bicaudal-frontal (ventricular) index, anterior horn width index, occipital horn width ratio, occipital horn-to-cranium distance index, and Schiersmann index. The results are shown in Table 3.
Table 3
Relationship between indexes describing the extent of brain atrophy and severity of leukoaraiosis in groups LA1 and LA2
| Parameter | Mean/*median LA1 | Standard deviation/*min, max LA1 | Mean/*median LA2 | Standard deviation/*min, max LA2 | p |
|---|---|---|---|---|---|
| Huckmann number | 51.40 | 6.62 | 54.69 | 6.95 | 0.0379 |
| Bicaudate index | 0.15 | 0.03 | 0.18 | 0.03 | 0.0002 |
| Bicaudal index | 0.13 | 0.02 | 0.15 | 0.03 | 0.0002 |
| Bicaudal-frontal (ventricular) index | 0.51 | 0.08 | 0.59 | 0.08 | 0.0000 |
| Anterior horn width index | 0.06 | 0.01 | 0.08 | 0.02 | 0.0000 |
| Occipital horn width ratio | 0.11 | 0.03 | 0.13 | 0.03 | 0.0097 |
| Occipital horn-to-cranium distance index | 0.23 | 0.02 | 0.22 | 0.03 | 0.0482 |
| Schiersmann index* | 4.73* | 3.05/14.10* | 4.31* | 3.18/5.92* | 0.0140 |
Discussion
The relationship between leukoaraiosis and stroke remains the subject of numerous studies and academic discussions. The presented results demonstrate that the extent of leukoaraiosis has no influence on the severity of stroke in the NIHSS scale in our study group. However, opinions concerning stroke severity and long-term prognosis of patients with leukoaraiosis after ischaemic stroke vary. Some researchers consider LA an independent risk factor for deterioration of cognitive function after minor stroke (NIHSS ≤ 5) [13].
Results published in 2017 by Kannikar Kongbunkiat et al. are of particular importance in that regard, demonstrating that both the presence and severity of leukoaraiosis influence the risk of development of symptomatic intracranial haemorrhage and poor outcome of endovascular treatment, for both intra-arterial as well as intravenous thrombolysis in acute ischaemic stroke [14]. Although preliminary results of a study by Helenius and Henniger show a relationship between the extent of leukoaraiosis and volume of infarction as well as clinical severity of stroke in NIHSS scale, the authors emphasise the necessity of further research to corroborate their findings [15].
We should remember that MRI is the best method to detect acute ischaemic stroke and to assess the time of its occurrence, but CT is still the “gold standard” for imaging acute stroke due to its short time of examination, less sensitivity to movement artefacts than MRI, and the fact that metallic elements in the patient’s body are not a contraindication to the examination (which could happen in the case of MRI). Moreover, CT examination allows the exclusion of intracranial bleeding, which is a contraindication to thrombolytic therapy [2,16,17].
According to Professor Wardlaw et al. [2], MRI is a better tool for assessment of WMH, and it allows precise evaluation by the Fazekas scale. The Fazekas scale in MRI images is a four-point visual scale, which is used to assess the hyperintense lesions in periventricular and deep white matter. In the periventricular white matter region, grading is assigned as follows: 0 – absent, 1 – “caps” or pencil-thin lining, 2 – smooth “halo”, and 3 – irregular periventricular signal extending into the deep white matter. In deep white matter each region is also graded: 0 – absent, 1 – punctate foci, 2 – beginning confluence, and 3 – large confluence areas [11,12].
The limitation of CT is the fact that both the infarction (areas of cytotoxic cerebral oedema and stroke) and leukoaraiosis are hypodense areas. Although leukoaraiosis is usually symmetrical, often in the context of a large hemispheric stroke, its assessment may not be accurate enough.
Taking available literature data into consideration, it may be concluded that brain atrophy can be considered a biomarker for small vessel disease [8], while general brain atrophy may be treated as a marker of SVD progression [5,7].
Our results support these relationships with respect to central atrophy reflected by widening of the ventricular system, especially the third ventricle. In the presented results the authors demonstrated an association between the severity of leukoaraiosis and brain atrophy, i.e. patients with more advanced LA lesions were characterised by more extensive nervous tissue atrophy. In their study, Moretti et al. showed an association between corpus callosum atrophy (in particular: genu of corpus callosum) and gait disturbances among patients with leukoaraiosis [18]. The results of a study by Lambert et al. published in 2016 demonstrated a relationship between WMH progression and brain atrophy in medial-frontal, orbito-frontal, parietal, and occipital regions [3].
The presented research has some limitations – the MR examination performed in the examined patients would allow a more accurate evaluation of the ischaemic focus/foci and coexisting white matter hyperintensities. Extending the research with advanced diffusion techniques – IVIM (Intravoxel incoherent motion) in an ultra-high 7T field MR devices – would allow more accurate assessment of cerebral perfusion [19,20]. The use of modern computer software to assess the brain nervous tissue atrophy would allow a more precise (quantitative) assessment of cerebral atrophy.
Conclusions
The results of our studies present an association between the degree of leukoaraiosis extension and brain atrophy. However, no association was demonstrated between atrophy of central nervous system tissue or extent of leukoaraiosis and ischaemic stroke severity as measured on the NIHSS scale.