


Introduction
Primary skeletal tumours are exceedingly rare. The vast majority of clinically encountered bone tumours are benign with excellent prognosis with or without curative surgical excision. Similar to soft tissue tumours, the World Health Organisation (WHO) classification categorises bone tumours based on their similarity to normal adult tissue [1]. Namely, each bone tumour is classified based on its similarity to normal adult tissue, as chondrogenic tumours, osteogenic tumours, fibrogenic tumours, fibrohistiocytic tumours, ewing sarcoma, osteoclastic giant cell-rich tumours, notochordal tumours, vascular tumours, hematopoietic neoplasms and myogenic, lipogenic, and epithelial tumours, tumours of undefined neoplastic nature, and lastly undifferentiated high-grade pleomorphic sarcoma. The most recent WHO classification provides an updated classification scheme that integrates biological behaviour as a distinguishing feature in each subcategory; bone tumours, particularly cartilage forming tumours, are further subdivided as benign, intermediate (locally aggressive or rarely metastasising), and malignant tumours.
Only a small proportion of bone tumours are malignant; however, their infrequent occurrence poses a management challenge to radiologists. For optimal results, bone tumours should be managed at an experienced tertiary referral centre with a multidisciplinary team consisting of a musculoskeletal radiologist, orthopaedic oncologist, and musculoskeletal pathologist. The radiologist must be familiar with the imaging appearance of bone tumours to initiate the referral to an orthopaedic oncologist in the appropriate clinical setting. Radiography plays an important role in the detection and characterisation of bone tumours; however, magnetic resonance imaging (MRI) is the optimal modality for assessment of the anatomic extent and locoregional staging. With the advent of advanced MRI sequences such as diffusion-weighted imaging (DWI), dynamic contrast enhanced sequences (DCE), and MR spectroscopy, MRI is gaining acceptance as a method of characterising the biological behaviour of a bone tumour. This review will discuss the most recent updates to the WHO classification of bone tumours that are relevant to radiologists in routine clinical practice and how these advanced MRI sequences can help solve challenging clinical dilemmas.
Chondrogenic tumours
Chondrogenic tumours of bone are now classified as benign, intermediate (locally aggressive), intermediate (rarely metastasising), and malignant grades. One of the major updates in this category includes the addition of osteochondromyxoma to the benign category in addition to subungual exostosis, bizarre parosteal osteochondromatous proliferation, and synovial chondromatosis. Osteochondromyxomas are extremely rare bone tumours observed in 1% of all patients with Carney complex, a cancer predisposition syndrome [2]. Chondromyxoid fibroma and atypical cartilaginous tumour/chondrosarcoma grade I are grouped together as intermediate (locally aggressive) tumours. Chondroblastoma (Figure 1) is classified as an intermediate (rarely metastasising) tumour. Malignant chondrogenic tumours (Figure 2) include grade II or III a, dedifferentiated, mesenchymal, and clear cell varieties of chondrosarcoma (CS). CS can be conceptualised as primary or secondary. Primary CS occurs de novo while secondary CS occurs in the setting of a pre-existing benign chondrogenic skeletal lesion. Secondary CS can be central (arising in a pre-existing enchondroma) or peripheral (juxtaposed to the cartilaginous cap of an osteochondroma) type.
Figure 1
52-year-old woman with chondroblastoma, an intermediate (rarely metastasising) chondrogenic bone tumour. Anteroposterior radiograph of the left knee (A) shows a focal lytic skeletal lesion in the distal medial femoral condyle complicated with pathological fracture (arrow). On magnetic resonance imaging (MRI), there is a distal left femoral subarticular skeletal lesion (arrow) that is isointense to skeletal muscle on T1-weighted image (B), hyperintense to skeletal muscle on axial fat-suppressed (FS) T2-weighted image (C) with confluent internal enhancement on axial T1-weighted FS post-contrast image (D) and early arterial enhancement on dynamic contrast-enhanced-maximum intensity projection (E). Axial diffusion-weighted imaging (DWI) through the distal left femur using low b-value of 50 s/mm2 (F), intermediate b-value of 400 s/mm2 (G), high b-value of 800 s/mm2 (H) and lastly the apparent diffusion coefficient (ADC) map (I) shows qualitative restricted diffusion with lack of signal loss on DWI progressively increasing b-values as well as low ADC values (≤ 1.0 × 10⁻³ mm2/s) ranging from 0.8 to 1.2. MRI is optimal for local staging and readily displays cortical breach on the coronal T1-weighted image (dotted arrow on image B). Advanced MRI features (early arterial enhancement on dynamic contrast enhanced and restricted diffusion on DWI/ADC mapping) point towards aggressive biology and hypercellularity
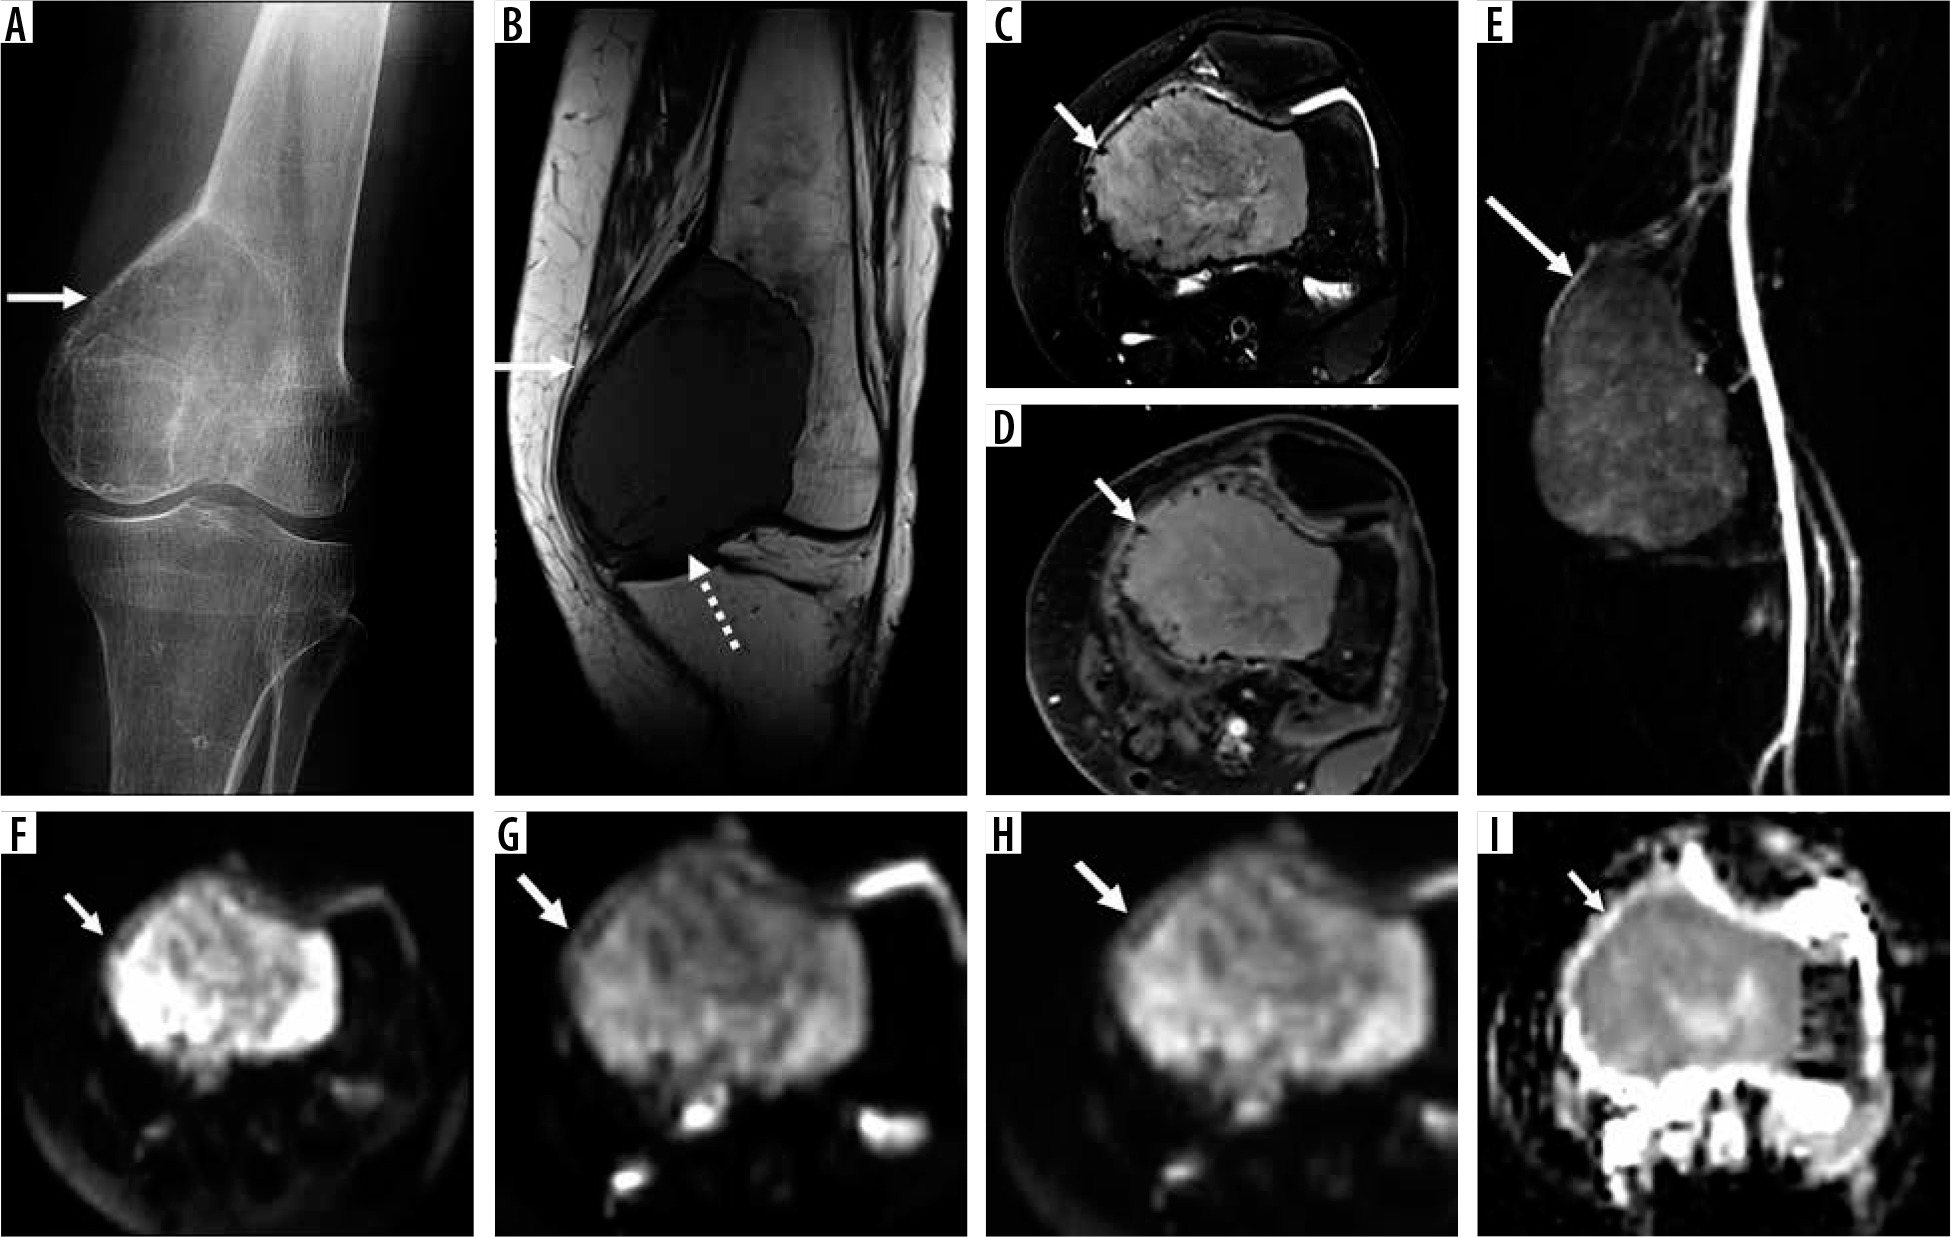
Figure 2
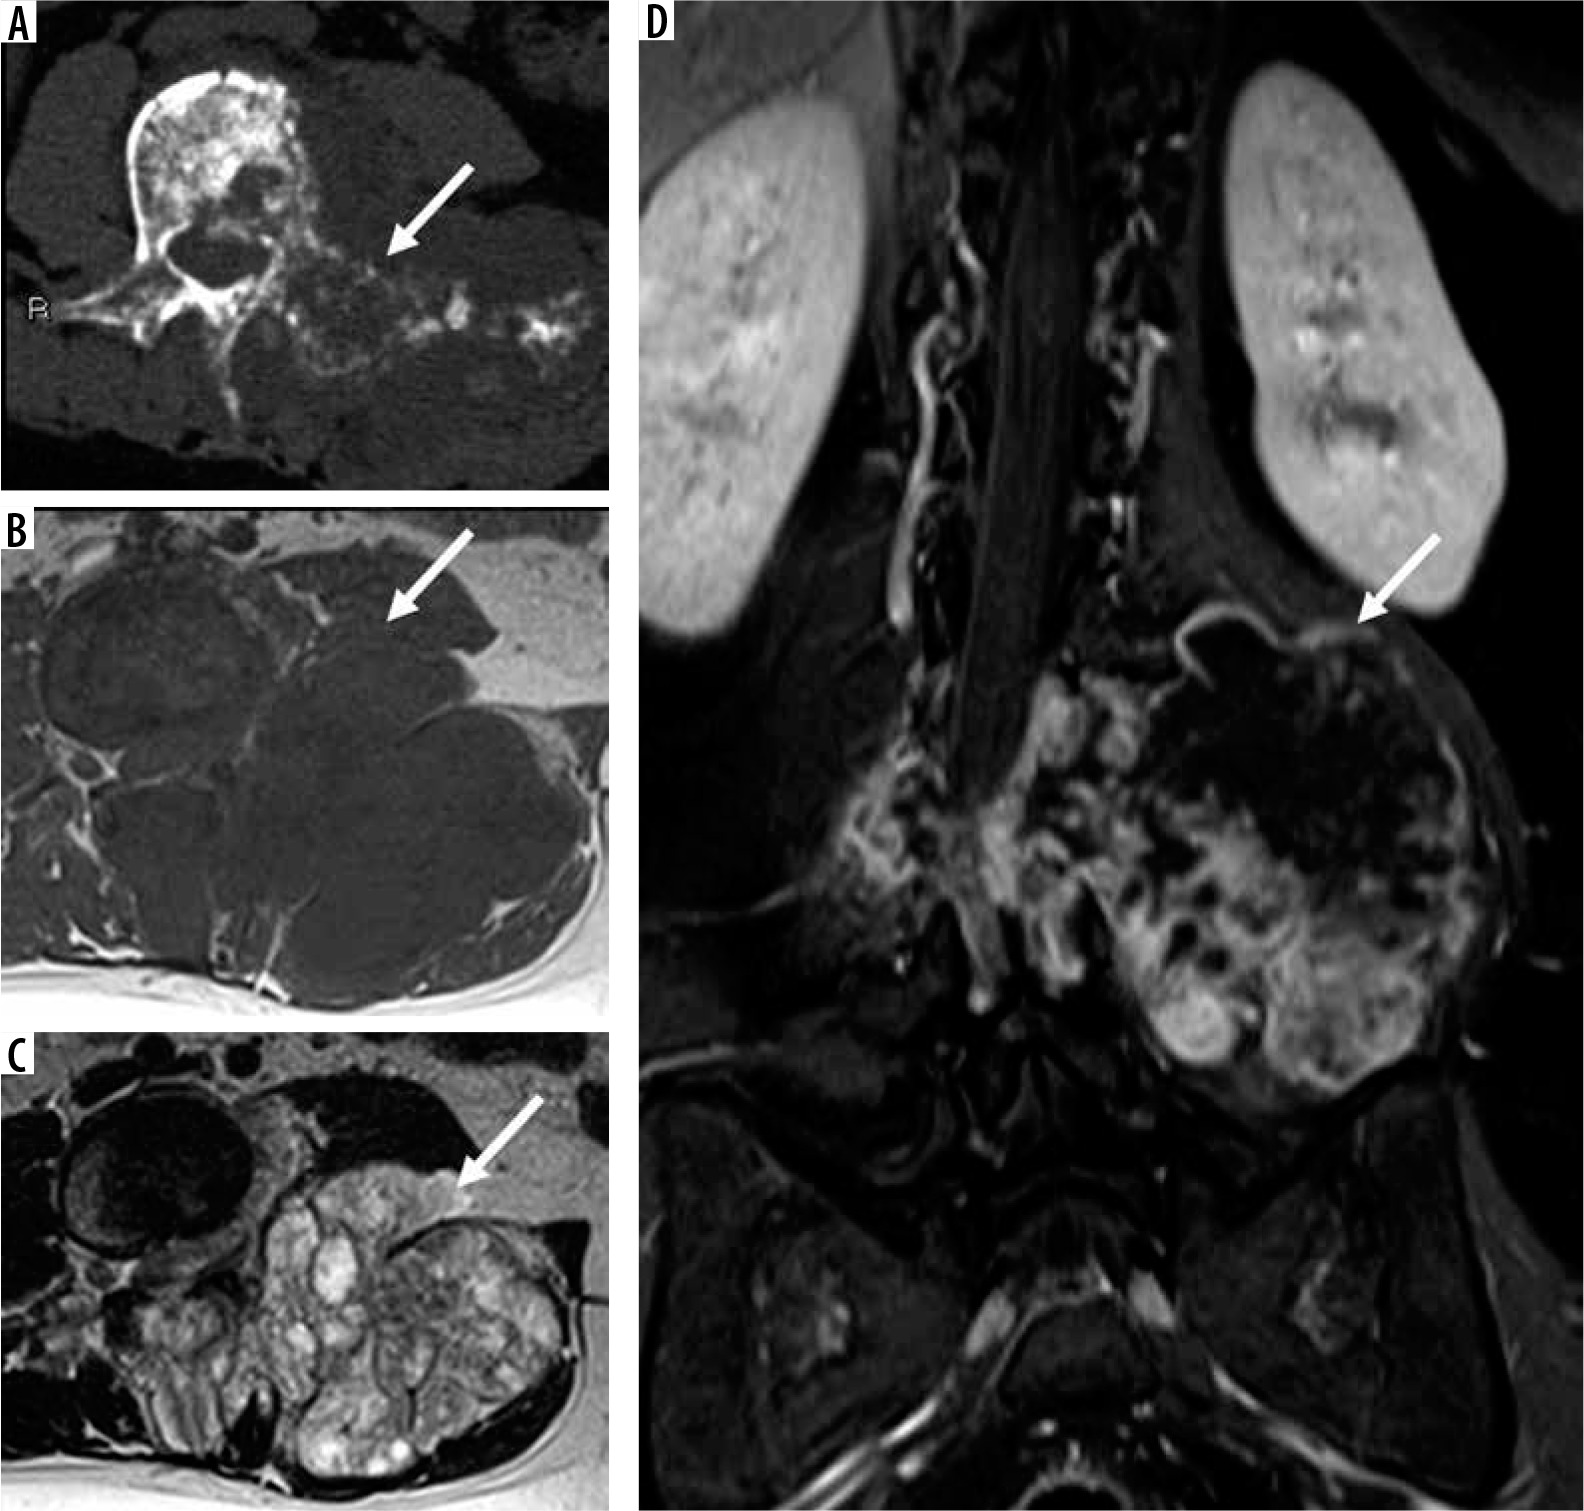
25-year-old woman with grade 3 chondrosarcoma. Axial computed tomography (CT) image through the lower lumbar (A) spine shows an aggressive, permeative skeletal lesion (arrow) within the vertebral body and posterior elements with a large soft tissue component arising from the left transverse process. Axial T1-weighted (B) and T2-weighted magnetic resonance (MR) images (C) through the lumbar spine are superior to CT in demonstrating the large associated soft tissue mass (arrows) and intraspinal extension of neoplasm. Coronal post-contrast T1-weighted fat-suppressed MR image through the lumbar spine (D) shows a large extra-osseous soft tissue mass (arrow) with associated lobular and solid enhancement associated with chondrogenic tumours
A major diagnostic dilemma for the radiologist includes the distinction between a large benign chondrogenic lesion, such as an enchondroma, from a grade I CS or atypical cartilaginous tumour. (In general, enchondroma is readily distinguished from grade II or III CS based on imaging.) Clinical and radiographic features useful for differentiating enchondroma from grade I CS include pain attributable to the skeletal lesion of concern, lesion length, endosteal scalloping > 2/3, cortical destruction, bone expansion, and soft tissue extension [3]. Of these multi-parametric imaging features, endosteal scalloping greater than 2/3rd of the cortex has been shown to offer the highest sensitivity (71% CI: 42-92%), although cortical destruction and the presence of soft tissue mass can provide perfect specificity of 100% [3]. DCE MRI has provided variable clinical experience for this purpose, with one investigation reporting limited utility [3] while another investigation [4] reporting 100% sensitivity and 63.3% specificity and 93.4% overall accuracy for the distinction of enchondroma from grade I CS. DWI with apparent diffusion coefficient (ADC) mapping is not a useful imaging modality to distinguish a low-grade CS from enchondroma, probably due to the intrinsic T2 properties of chondroid lesions. According to one investigation, minimum ADC values (× 10-3 mm2/s) for enchondromas, low-grade (grade I) CS, high-grade (grade II and III) CS, and dedifferentiated CS were 1.82, 1.75 to 2.01, 1.83 to 1.75, and 0.77, respectively, suggesting overlapping quantitative ADC values between all groups with the exception of dedifferentiated CS [5].
Therefore, challenging chondrogenic tumours require a multi-disciplinary approach and discussion between musculoskeletal radiologists, pathologists, and surgical oncologists to correlate clinical findings with radiological findings, and the need for a biopsy as well as optimal biopsy track [6].
Osteogenic tumours
Osteogenic tumours can be benign (osteoma and osteoid osteoma), intermediate or locally aggressive (osteoblastoma) (Figure 3), and malignant (osteosarcoma) (Figure 4). Other than the addition of osteoma to the benign osteogenic tumour category and distinguishing it from osteoid osteoma, the classification has not changed. Unlike chondrogenic tumours, the distinction between benign, intermediate, and malignant osteogenic tumours is less challenging. Recent advances include incorporation of baseline MRI using DWI-derived ADC values as a method of treatment response [7]. ADC values can provide information regarding the cellularity of a tumour of interest, with high ADC values typically present in hypocellular/necrotic or treatment-responsive tumours and low ADC values typically observed in hypercellular or treatment non-responsive tumours. Specifically for patients with osteosarcoma, post-treatment minimum ADC values (1.49 ± 0.38 × 10⁻³ mm2/s) tend to be higher than pre-treatment minimum ADC values (0.88 ± 0.16 × 10⁻³ mm2/s) and different between patients with a good versus poor response to treatment (good response: 1.01 ± 0.22 × 10⁻³ mm2/s versus poor response: 0.55 ± 0.29 × 10⁻³ mm2/s, p < 0.05) [8]. Interestingly, the underlying histologic subtype of osteosarcoma can have implications for diffusion properties and ultimately the ADC value. For example, DWI enables quantitative evaluation of treatment-related necrosis in patients with osteosarcoma, who have undergone neoadjuvant chemotherapy via ADC values, and shows differences between viable neoplasm and necrosis in fibroblastic and osteoblastic osteosarcomas; however, viable chondroblastic osteosarcoma has intrinsically high ADC values due to its cartilaginous composition, and it cannot be distinguished reliably from necrosis [9].
Figure 3
14-year-old male with osteoblastoma and secondary aneurysmal bone cyst. Axial computed tomography image through the lower lumbar spine (A) shows an expansile, predominantly lucent, well-demarcated skeletal lesion (arrow) in the vertebral body extending posterior to involve the left pedicle and transverse process. Axial T1-weighted (B) and T2-weighted (C) magnetic resonance images through the skeletal lesion (arrow) show medial epidural extension of neoplasm (dotted arrow). Note the absence of septations and fluid-fluid levels indicative of a typical aneurysmal bone cyst (see Figure 11 for comparison)
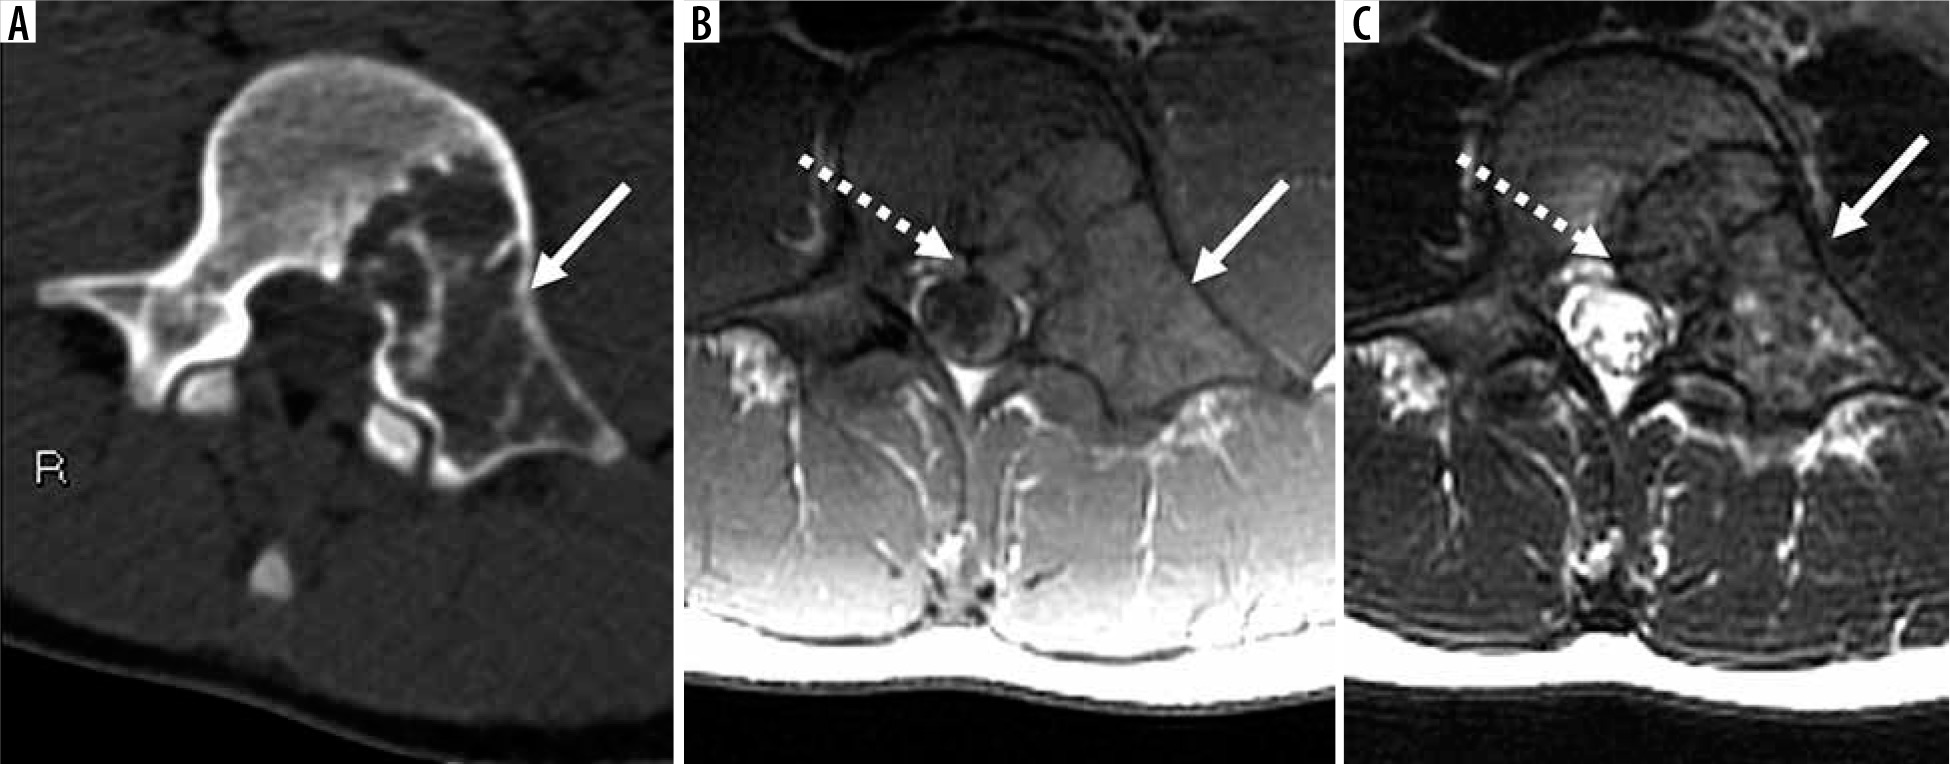
Figure 4
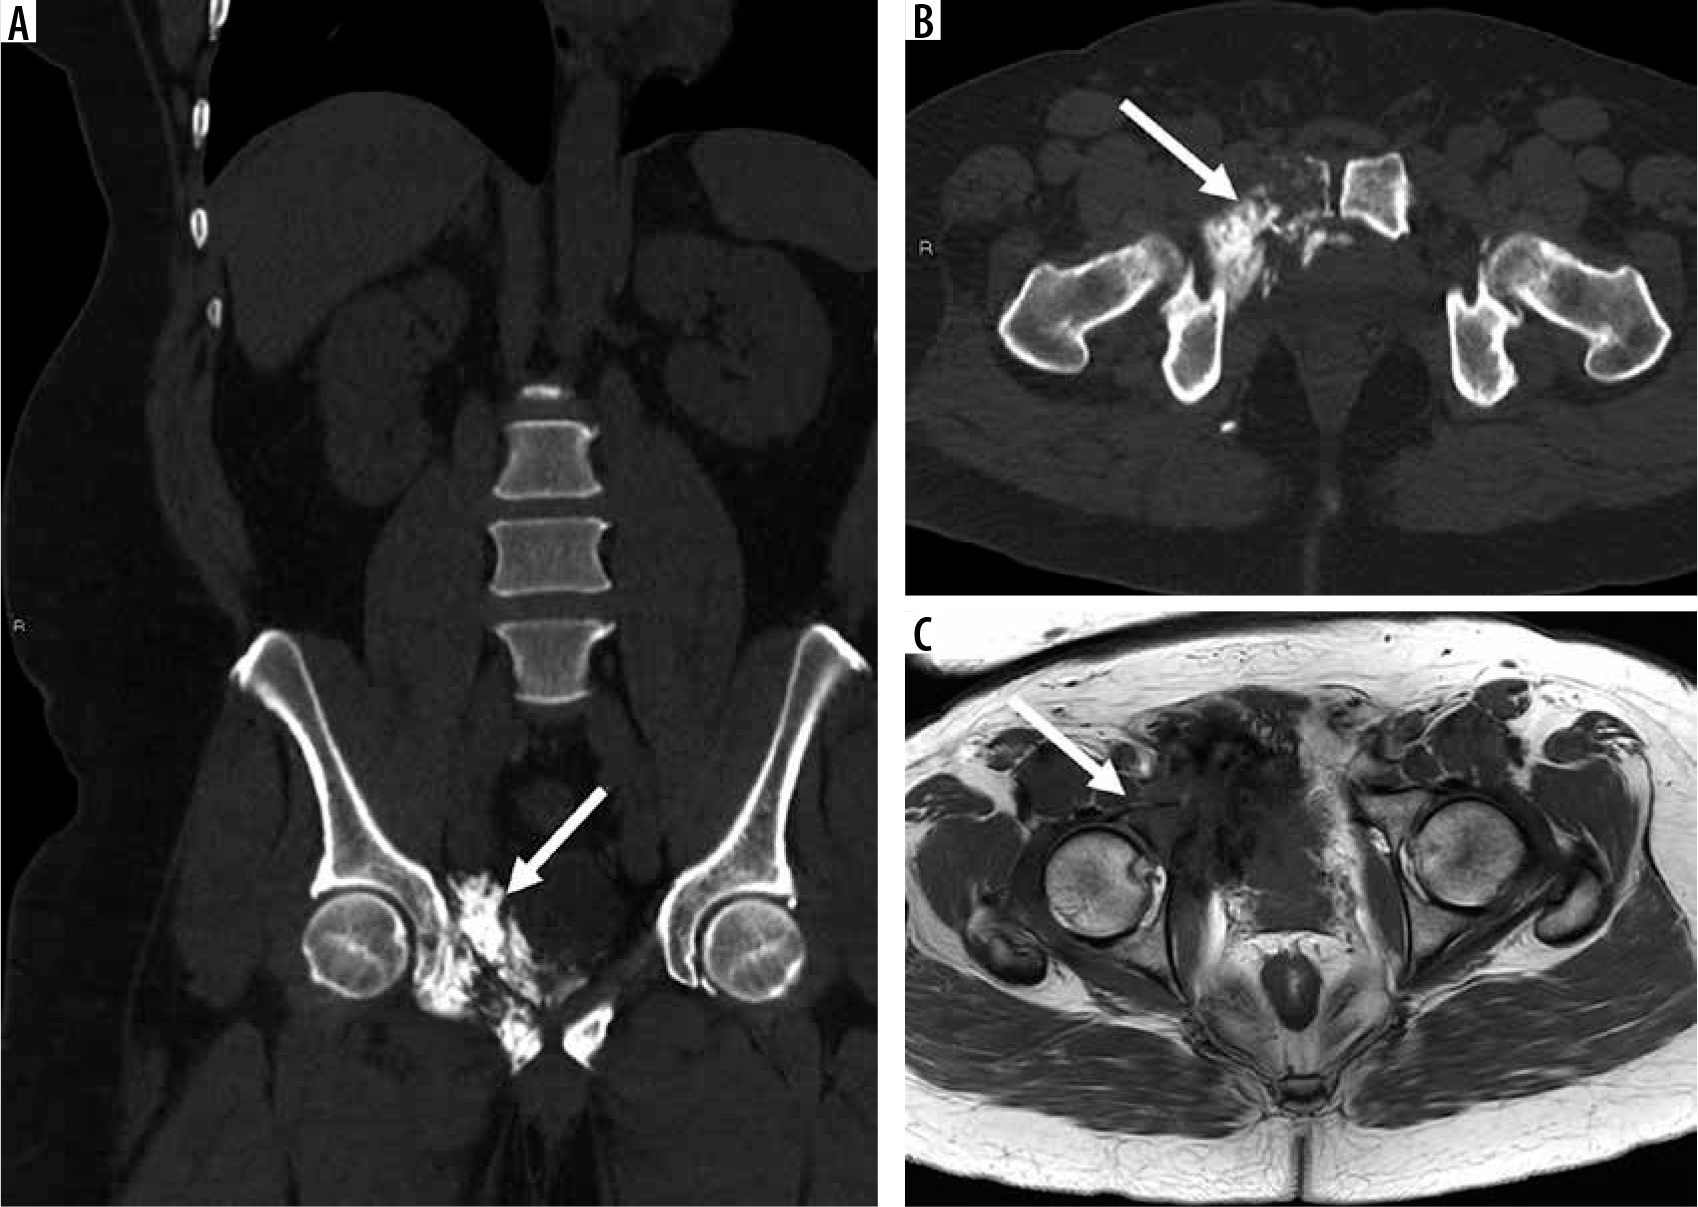
66-year-old man with osteosarcoma, osteoblastic type, grade 3 (of 3) in the setting of prior radiation therapy for prostate carcinoma several years ago. Coronal (A) and axial (B) computed tomography images through the pelvis reveal a large aggressive skeletal lesion (arrow) in the right pubic body extending towards the acetabulum with osteoid matrix mineralisation. Axial T1-weighted magnetic resonance image through the pelvis (C) shows the anatomical extent of the lesion to involve the anterior right acetabulum (arrow)
Future directions for the advancement of imaging of osteogenic tumours include the incorporation of radiomics signatures extracted from multi-parametric baseline MRI to predict outcomes in patients with osteosarcoma [10,11]. Preliminary machine learning-based investigations on radiomic data offer high sensitivity of 100% (95% CI [100-100%]) and specificity of 86% (95% CI [60-111]) [12]. Such non-invasive methods of predicting chemotherapy response may be a way of personalising the treatment paradigm of each patient in the future [12].
Fibrogenic tumours
Fibrogenic tumours of bone can be benign (desmoplastic fibroma) and malignant (fibrosarcoma). The major clarification in the most recent WHO classification of tumours of bone and soft tissues is that fibrosarcoma is a diagnosis of exclusion and therefore requires a generous biopsy sample to make the correct diagnosis [1]. By definition, the diagnosis of fibrosarcoma requires absence of any recognisable line of differentiation and as such requires a thorough and representative histological sample when a biopsy is performed. On MRI, fibrosarcomas (Figure 5) tend to have similar imaging features as other sarcomas; namely, fibrosarcomas are hypointense relative to skeletal muscle on T1-weighted imaging, heterogeneous with low and high signal intensity on T2-weighted images with variable enhancement, perilesional oedema, and internal septae [13]. No unique advanced MRI features of fibrosarcoma have been described, but they probably overlap with other malignant tumours. Fibrosarcoma of bone and undifferentiated high-grade pleomorphic sarcomas are treated in a similar manner as osteosarcoma.
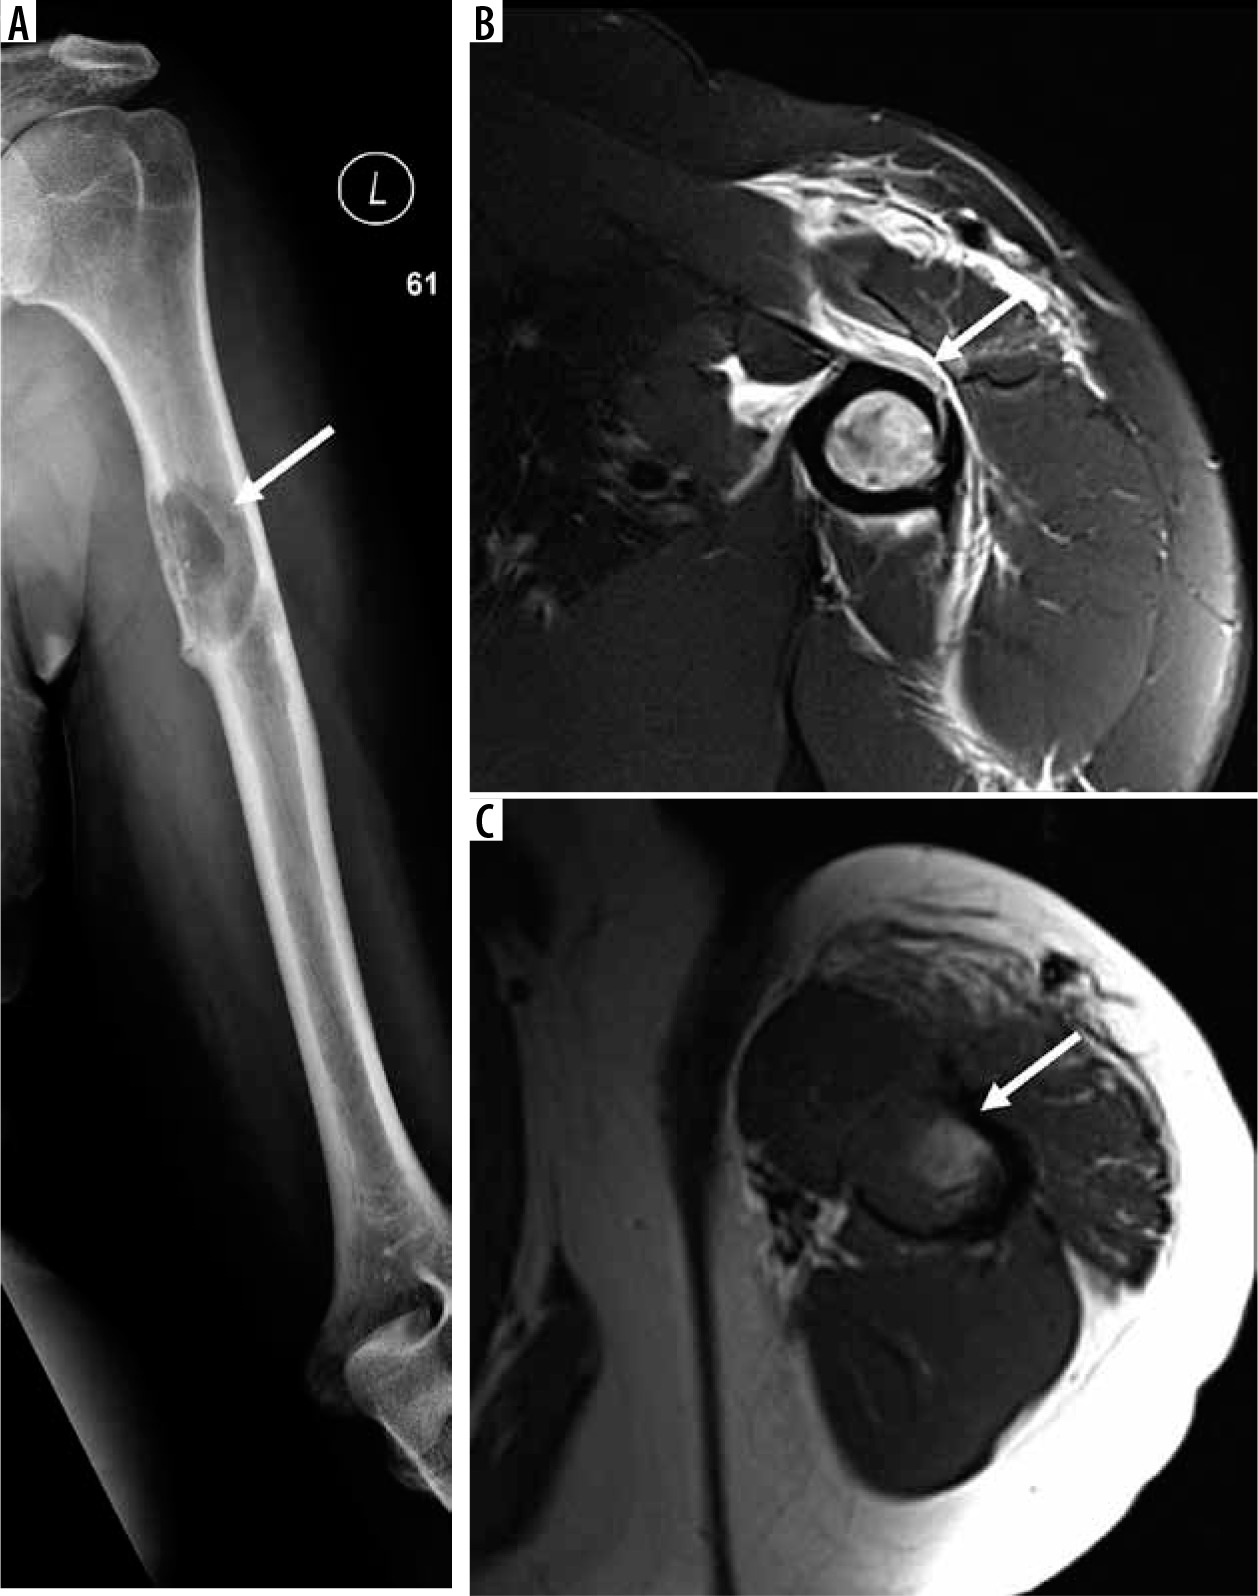
Figure 5
44-year-woman with fibrosarcoma of bone. Anteroposterior radiograph of the left humerus (A) shows a lytic lesion (arrow) in the proximal humeral diaphysis complicated with a pathological fracture. Magnetic resonance imaging (MRI) shows intramedullary marrow replacement, cortical break, as well as perilesional oedema/periosteal reaction on axial T2-weighted fat-suppressed (B) and T1-weighted images (C) through the left humerus (arrows). There are no determinate features on radiographs or MRI. By definition, the diagnosis of fibrosarcoma requires absence of any recognisable line of differentiation and as such requires a thorough and representative histological sample when a biopsy is performed
Ewing sarcoma
An additional major update in the most recent WHO classification of tumours of bone and soft tissues is the removal of the term “PNET” as a synonym for Ewing sarcoma. Although the diagnosis of Ewing sarcoma is made on radiography and histology, MRI plays an important role for locoregional staging (Figure 6). Similar to osteosarcoma, there is increasing interest in the utility of advanced MRI sequences for the initial assessment of Ewing sarcoma [14]. Because DWI investigates intratumoural cellularity with a small perfusion-related contribution, it can provide important insight into tumour aggressivity; information that can be used to predict treatment response. Investigations of Ewing sarcoma focusing on conventional non-contrast and contrast-enhanced MRI sequences in addition to DWI have shown agreement for tumour size, with significant associations for necrosis (p = 0.02), neurovascular invasion (p < 0.001), and enlarged lymph nodes (p = 0.005), with overall high diagnostic accuracy [14]. Interestingly, the combination of conventional MRI and DWI had comparable diagnostic accuracy to conventional and contrast-enhanced MRI, but it had superior diagnostic performance to conventional sequences alone. However, there was no correlation (p > 0.05) between minimum ADC values and relative enhancement, suggesting that the two techniques may be independent and provide separate information regarding tumour biology [14]. In addition to baseline MRI, the added value of advanced MRI sequences has been explored for the assessment of treatment response. As expected, and similarly to treatment response in osteosarcoma, treated Ewing sarcomas (1.03 ± 0.31 × 10⁻³ mm2/s) tend to demonstrate higher ADC values on DWI when compared with untreated Ewing sarcomas (0.48 ± 0.16 × 10⁻³ mm2/s) [15].
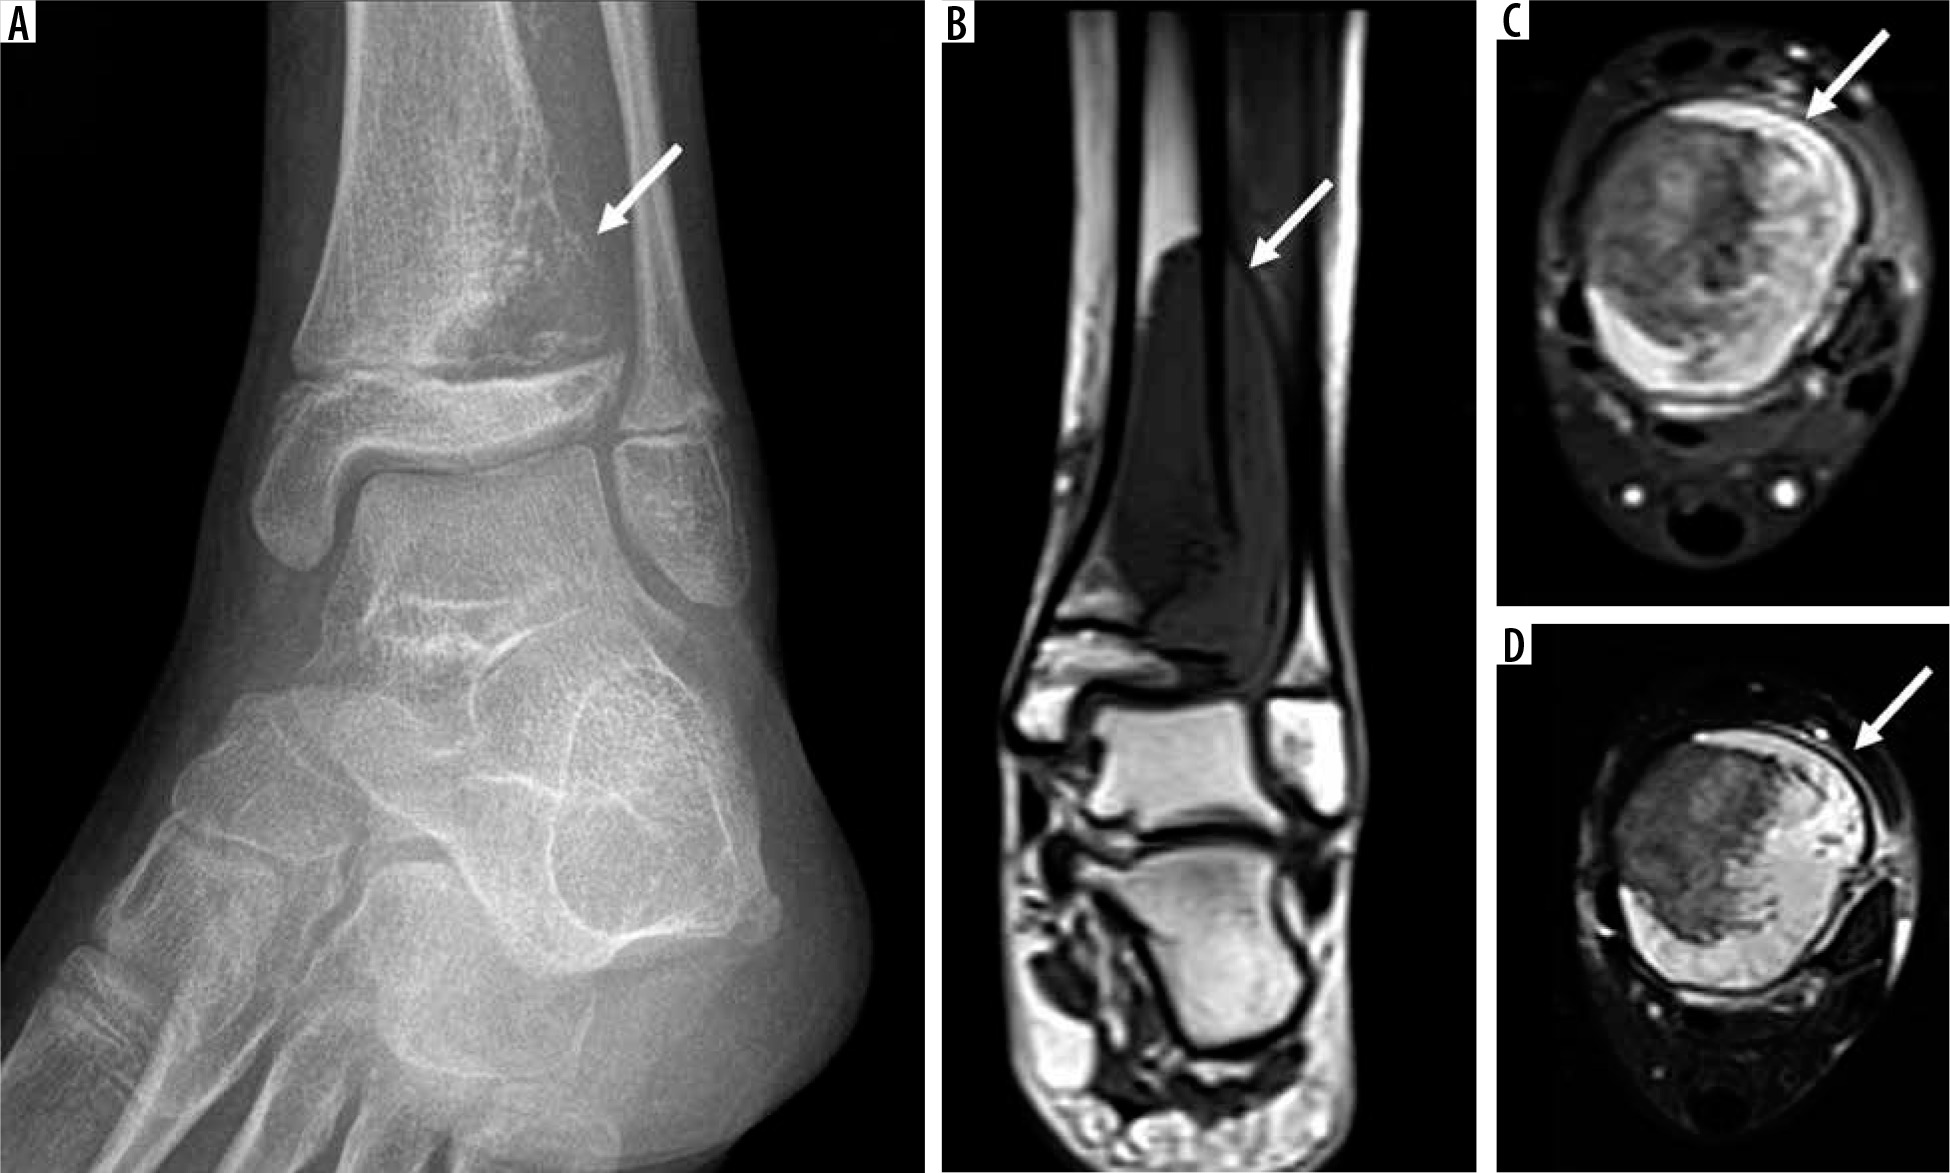
Figure 6
11-year-old female with Ewing sarcoma. Oblique radiograph of the left ankle (A) shows an aggressive lytic lesion (arrow) in the distal tibia involving the diametaphysis with cortical destruction and associated extra-osseous extension. Magnetic resonance imaging shows large skeletal lesion (arrow) measuring 3.5 × 2.6 × 6.2 cm with demonstration of its intramedullary extent as well as large associated soft tissue mass on coronal T1-weighted (B), axial T2-weighted fat-suppressed (FS) and (C) axial T1-weighted FS post-contrast images (D) through the left distal tibia (arrows)
Osteoclastic giant cell-rich tumours
Osteoclastic giant cell-rich tumours (Figure 7) can be benign giant cell lesions of the small bones, intermediate locally aggressive or rarely metastasizing giant cell tumour of bone (GCTB) and lastly, malignant GCT of bone. The biological behavior of GCTB can be variable with locally aggressive forms and rarely metastasizing forms [16]. Although complete removal or enbloc resection is the optimal treatment of choice, it can be challenging when GCTB occurs in the sacrum or is in a subarticular location [17]. As such, intralesional curettage with adjuvant treatment is an attractive alternative for improved functional outcome; however, it has a higher recurrence rate. Interestingly, the recurrence tends to be located in the periphery [18]. Therefore, MRI can play an important role in locoregional staging and selection of intralesional margins to strike a balance between optimal oncologic and functional outcome. On MRI, GCTB margins can be classified as clear, relatively clear, or blurred, which correlate with local tumour cell infiltration on histology [19]. The “paintbrush border” signs as detectable by MRI on T1-weighted images, has been correlated with local tumour cell infiltration on histology [20].
Figure 7
18-year-old male with giant cell tumour of bone. Anteroposterior radiograph of the left knee (A) shows a focal, subarticular lytic lesion in the proximal tibia involving the tibial spine (arrow). Magnetic resonance imaging (MRI) shows a focal skeletal lesion (arrow) on coronal T1-weighted (B), coronal T2-weighted fat-suppressed (FS), and (C) coronal T1-wighted FS post-contrast images (D) through the left proximal tibia with marked perilesional bone marrow and soft tissue oedema and enhancement. MRI can play an important role in locoregional staging of giant cell tumour of bone and selection of intralesional margins to strike a balance between optimal oncological and functional outcome. On MRI, giant cell tumour of bone margins can be classified as clear (as seen here), relatively clear, or blurred, which correlate with local tumour cell infiltration on histology

Fibrohistiocytic tumours
Fibrohistiocytic tumours of bone include benign lesions such as benign fibrous histiocytoma or non-ossifying fibroma. Similar to the edition in soft tissue tumour, the term “malignant fibrous histiocytoma” has been removed and renamed undifferentiated high-grade pleomorphic sarcoma of bone (UHGPS).
Notochordal tumours
Notochordal tumours of bone can be categorized as benign notochordal tumour (BNT) or malignant (chordoma). The addition of BNT to the benign category in this group is a new addition to the most recent WHO classification of tumours of bone. BNT can usually be distinguished from chordoma based on its imaging appearance. BNT tend to occur in the vertebra without expansion, cortical destruction or associated soft tissue mass. On MRI, BNT has elevated T2 signal and low T1 signal relative to skeletal muscle with minimal associated sclerosis on computed tomography (CT) [21]. Chordomas (Figure 8), on the other hand, tend to be expansile, lytic skeletal lesions with a soft tissue mass [21].
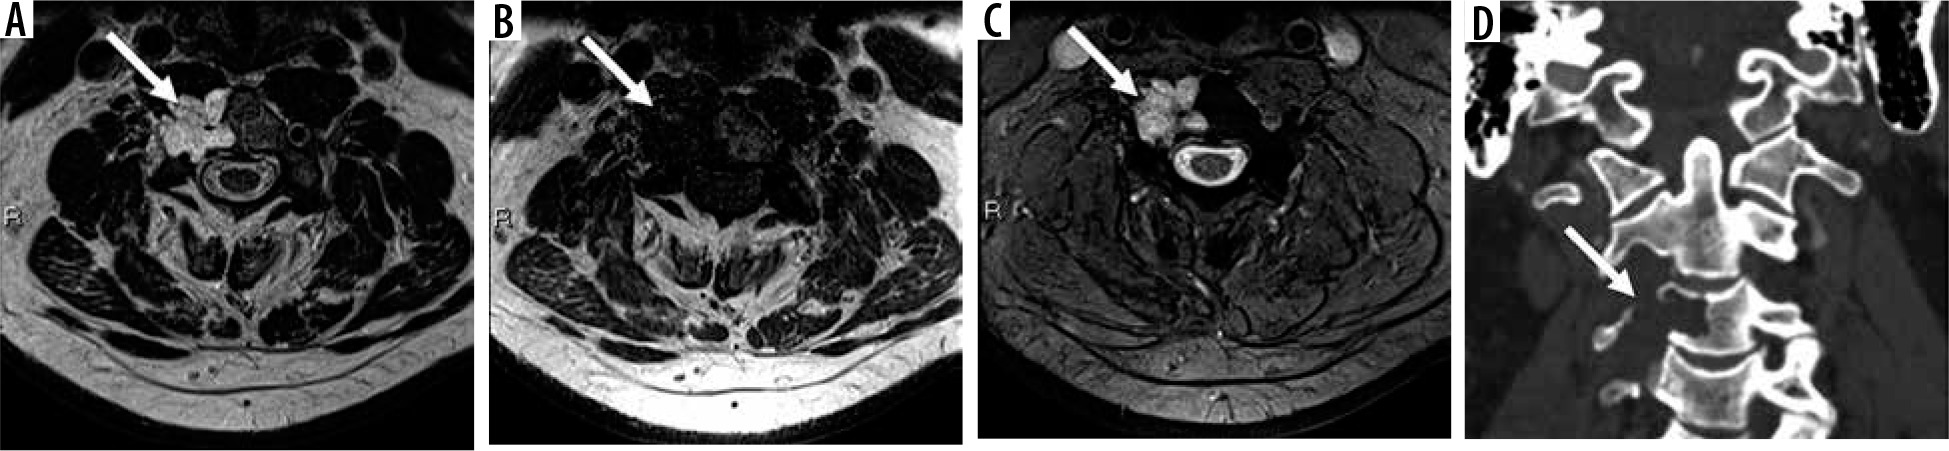
Figure 8
56-year-old male with C3 chordoma. Axial T2-weighted (A), T1-weighted (B), and GRE-based (C) magnetic resonance images through C3 vertebra show an expansile, T2 hyperintense, marrow replacing lesion (arrow) involving the right C3 vertebral body with a ventral soft tissue component. There is no intra-lesional mineralised matrix on the coronal computed tomography image (D) or GRE
Although the immunohistochemical profile of chordoma (expression of brachyury) is different than CS (IDH1 and IDH2 mutations), the two entities can have an overlapping imaging appearance, particularly on fluid-sensitive sequences. Both lesions tend to be T1 hypointense and T2 hyperintense with little to no enhancement associated with chordomas and variable enhancement of CS [21]. Small single-centre investigations have reported on the utility of quantitative DWI and ADC mapping as a useful tool to distinguish these two entities [22,23]. The solid component of CS tends to have overall higher minimum, mean, and maximum ADC values compared with chordomas, with the mean ADC cut-off point of 1.6 × 10⁻³ mm2/s offering a sensitivity and specificity of 94.3% and 98.6%, respectively [22]. DWI can distinguish CS from both classic and poorly differentiated chordoma [23]. There is emerging interest in radiomics [24] as a non-invasive multi-parametric tool to distinguish chordoma from chondrosarcoma with high diagnostic accuracy (92% [95% CI: 89-95%] in the primary cohort and 89% [95% CI: 86-931%]) in the validation cohort, and the specificity was 92% (95% CI: 90-94%) and 67% (95% CI: 63-70%) in the primary and validation cohorts, respectively [24]. In addition, there has been limited work using advanced MRI techniques and multi-parametric CT and MRI data to distinguish sacral GCTB and chordoma. Although both lesions occur in the sacrum, they tend to manifest distinct T2 signatures with GCTB tending to be relative hypointense and chordoma tending to be hyperintense. As such, a radiomics model based on DWI (exploiting the T2 properties of a tissue of interest) tends to have a higher area under the curve (AUC) of 0.89 for individual scans when compared with CT enhancement, T1-weighted, T2-weighted, and contrast-enhanced T1-weighted features for distinguishing GCTB from chordoma [25]. When clinical data including age, sex, and tumour location are incorporated into a clinical-radiomics nomogram, the AUC can be as high as 0.95 [25] for distinguishing GCTB and chordoma.
Myogenic, lipogenic, and epithelial tumours
Tumours in this category include lipoma, adamantinoma, leiomyosarcoma, and lastly liposarcoma. Of these four entities, adamantinoma can be challenging to diagnose correctly on imaging as well as histology, even though there are important treatment implications to this diagnosis. Osteofibrous dysplasia (OFD), osteofibrous dysplasia-like adamantinoma (OFD/LA), and adamantinoma are rare bone tumours that preferentially affect the tibial diaphysis. Of these, adamantinoma, a rare malignant tumour, can be challenging to definitively diagnose on percutaneous biopsy, and as such, radiologists play an important part in radiology-pathology concordance or in suggesting repeat biopsy in the setting of discordance [26]. Unlike OFD and OFD/LA, adamantinoma tends to have permeative moth-eaten margins and complete marrow replacement in the medullary cavity [26]. At this time, there are no investigations regarding the utility of advanced MRI sequences such as DWI and DCE for the distinction of adamantinoma from OFD and OFD/LA.
Vascular tumours
Vascular tumours of bone can be benign (haemangioma), intermediate, or locally aggressive/rarely metastasising such as epithelioid haemangioma (EH), a new addition to this group, or malignant (angiosarcoma and now epithelioid haemangioendothelioma [EHE]). The new classification now recognises EH as a separate entity that can be polyostotic. EH can be locally aggressive and can rarely present with lymphatic metastasis [27]. As opposed to EH, EHE (Figure 9) tends to have prominent flow voids and early arterial enhancement [28]. Again, there are no data regarding the advanced MRI features of EH or EHE, but DCE MRI may play an important role in distinguishing these two entities.
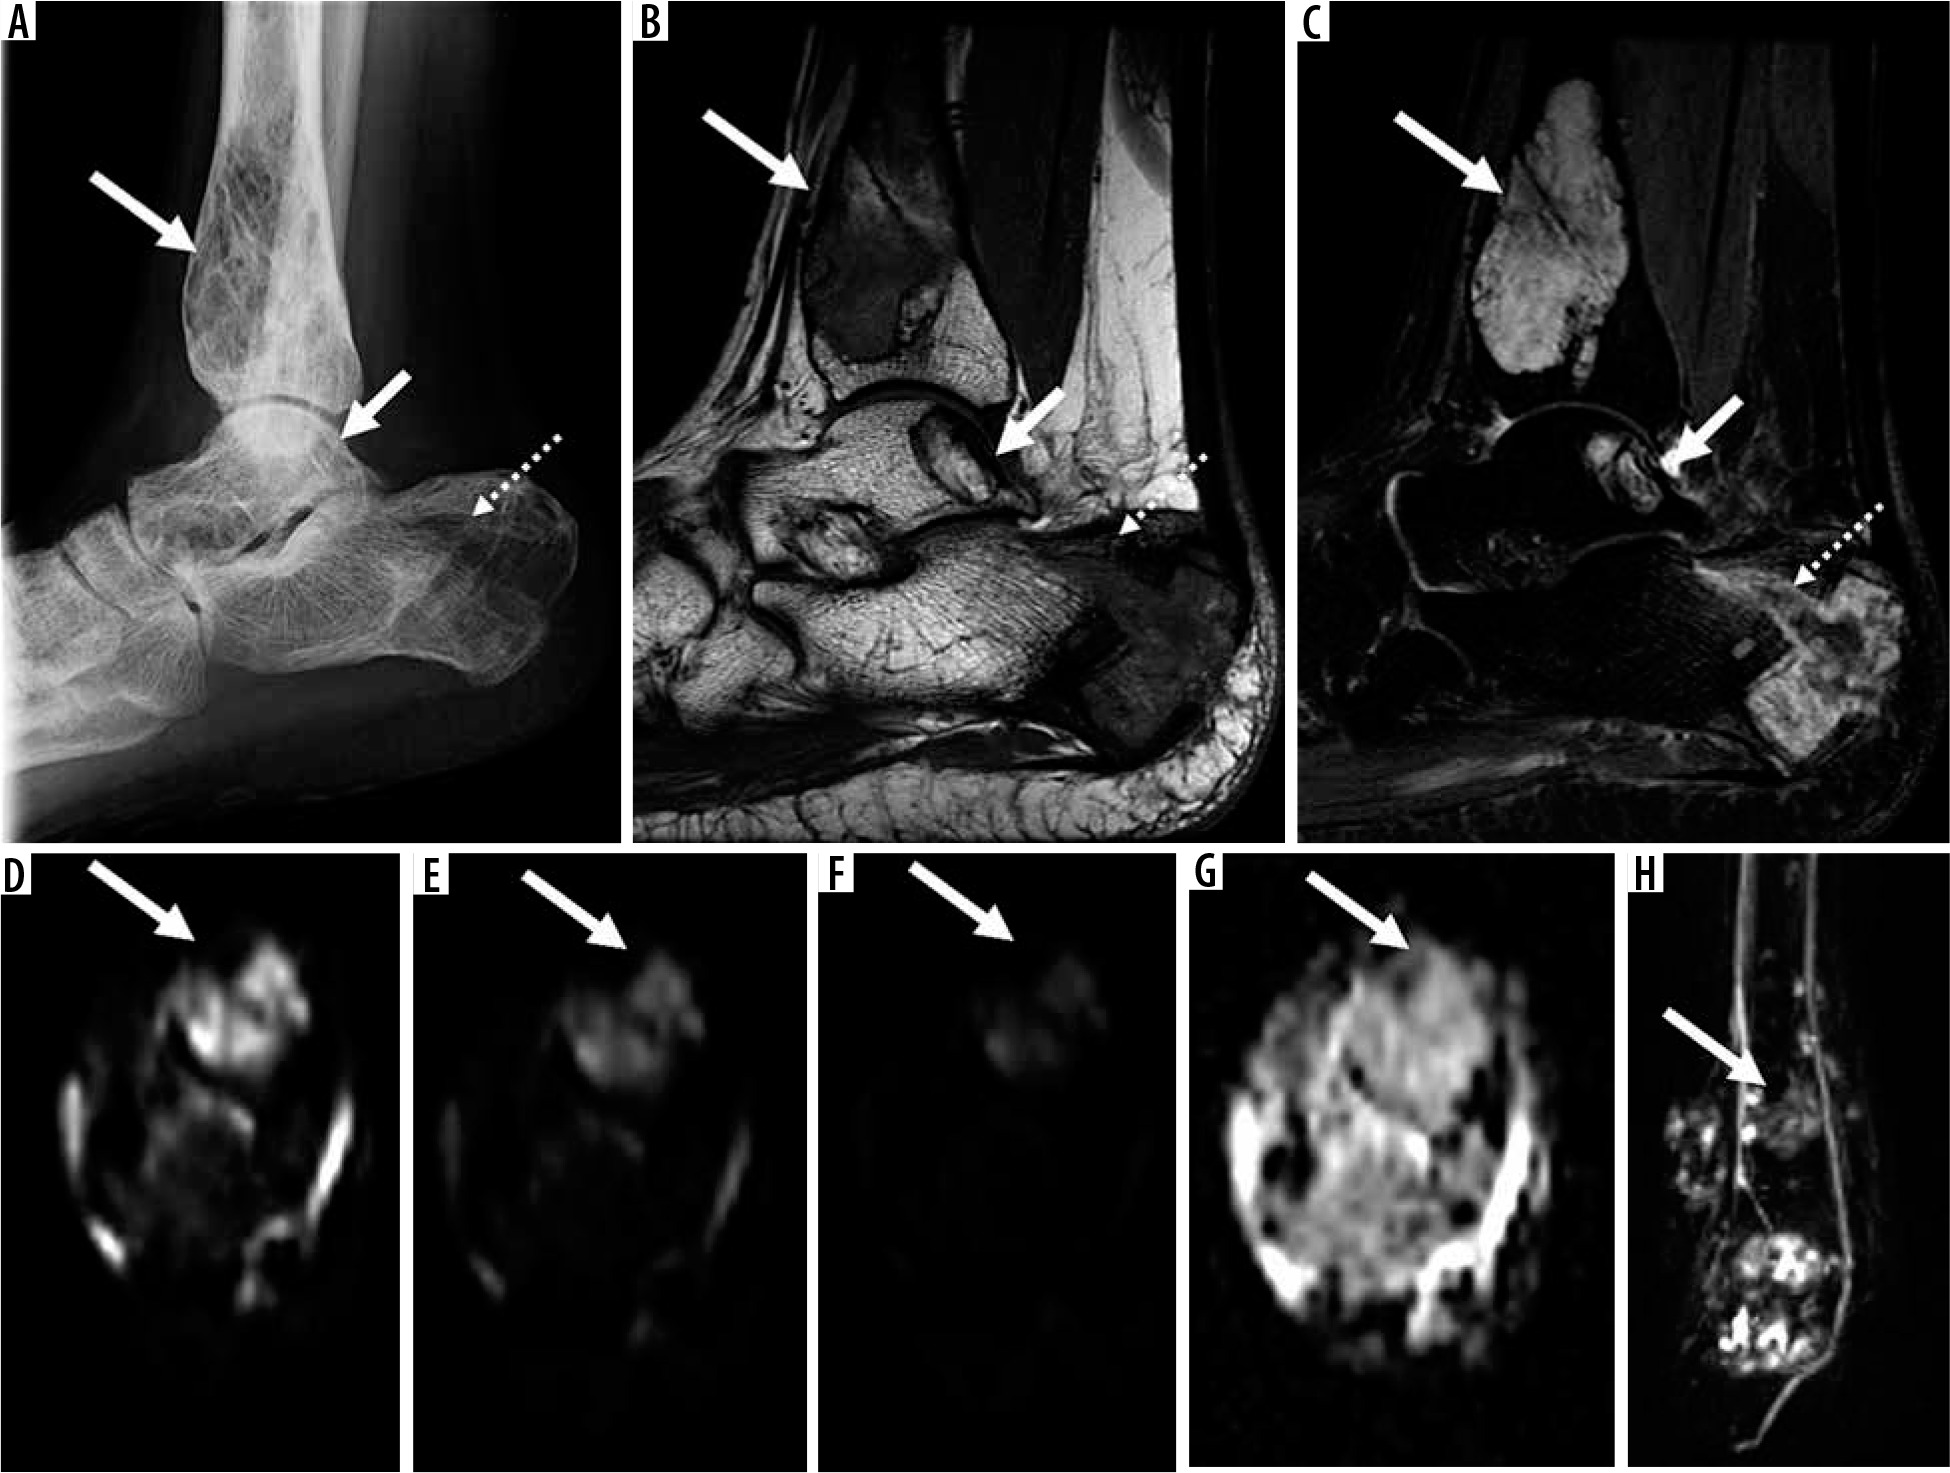
Figure 9
16-year-old female with polyostotic epithelioid haemangioendothelioma (EHE) in the right lower extremity. Lateral radiograph of the right ankle (A) shows multifocal mixed lytic and sclerotic skeletal lesions in the distal tibia (long arrow), posterior calcaneus (dotted arrow, complicated with pathological fracture), and talus (short arrow). On magnetic resonance imaging (MRI), there are multifocal skeletal lesions in the distal tibia (long arrow), posterior calcaneus (dotted arrow, complicated with pathological fracture), and talus (short arrow). These lesions are isointense to skeletal muscle on sagittal T1-weighted image (B) and hyperintense to skeletal muscle on axial T2-weighted fat-suppressed image (C). Axial diffusion-weighted imaging (DWI) through the distal left tibia (arrow) using low b-value of 50 s/mm2 (D), intermediate b-value of 400 s/mm2 (E), high b-value of 800 s/mm2 (F), and the apparent diffusion coefficient (ADC) map (G) show qualitative free diffusion with progressive signal loss on DWI with progressively increasing b-values as well as high ADC values (≤ 1.0 × 10⁻³ mm2/s) ranging from 1.5 to 2.2. Coronal dynamic contrast enhanced maximum intensity projection (H) shows multifocal sites of early arterial enhancement in the distal tibia (arrow), fibula, calcaneus, and talus, a distinguishing MRI feature of EHE when compared with epithelioid haemangioma
Tumours of undefined neoplastic nature
Tumours of undefined neoplastic nature include aneurysmal bone cyst (Figure 10), simple bone cyst, fibrous dysplasia, OFD, Langerhans cell histiocytosis (LCH), Erdheim-Chester disease, chondromesenchymal hamartoma, and Rosai-Dorfman disease. A combination of radiographs and routine MRI sequences can readily diagnose aneurysmal bone cyst, unicameral bone cyst, and fibrous dysplasia. However, of these entities, LCH can have the most confounding appearance. Notably, LCH (Figure 11) can overlap with infection as well as malignancy because it demonstrates aggressive MRI features including perilesional oedema, perilesional enhancement, periostitis, endosteal scalloping, and a soft tissue mass [29]. There are no data regarding the utility of advanced MRI sequences for the accurate distinction of LCH from other aggressive bone tumours, and frequently a biopsy is required.
Figure 10
15-year-old male with right second rib aneurysmal bone cyst. Anteroposterior chest radiograph (A) shows an expansile lytic skeletal lesion involving the right second lateral rib (arrow) with a large intrathoracic subpleural component. On axial computed tomography image (B) there is no internal mineralised matrix (arrow). On magnetic resonance imaging, there are several fluid-fluid levels on axial T2-weighted fat-suppressed (FS) image (C), presence of T1 hyperintensity medially – probably representing haemorrhagic products on axial T1-weighted FS pre-contrast image (D) with thin septal enhancement on axial T1-weighted FS post-contrast imaging (E) compatible with primary aneurysmal bone cyst (arrows)
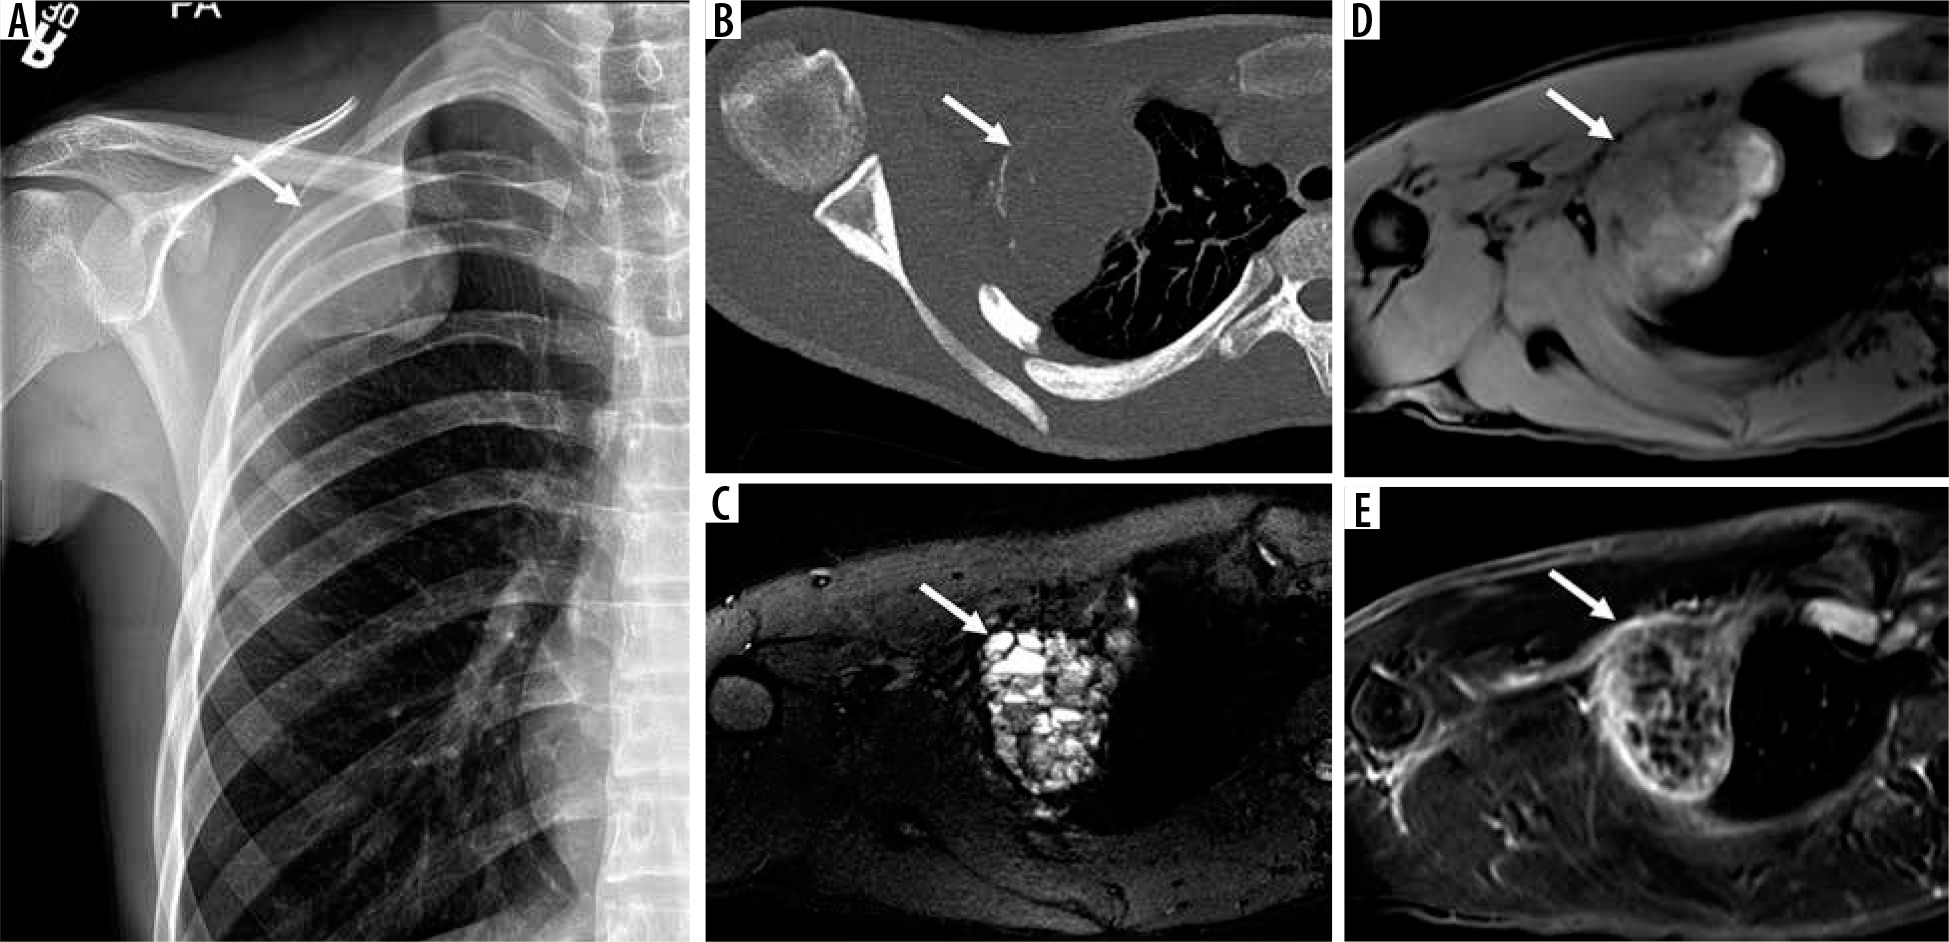
Figure 11
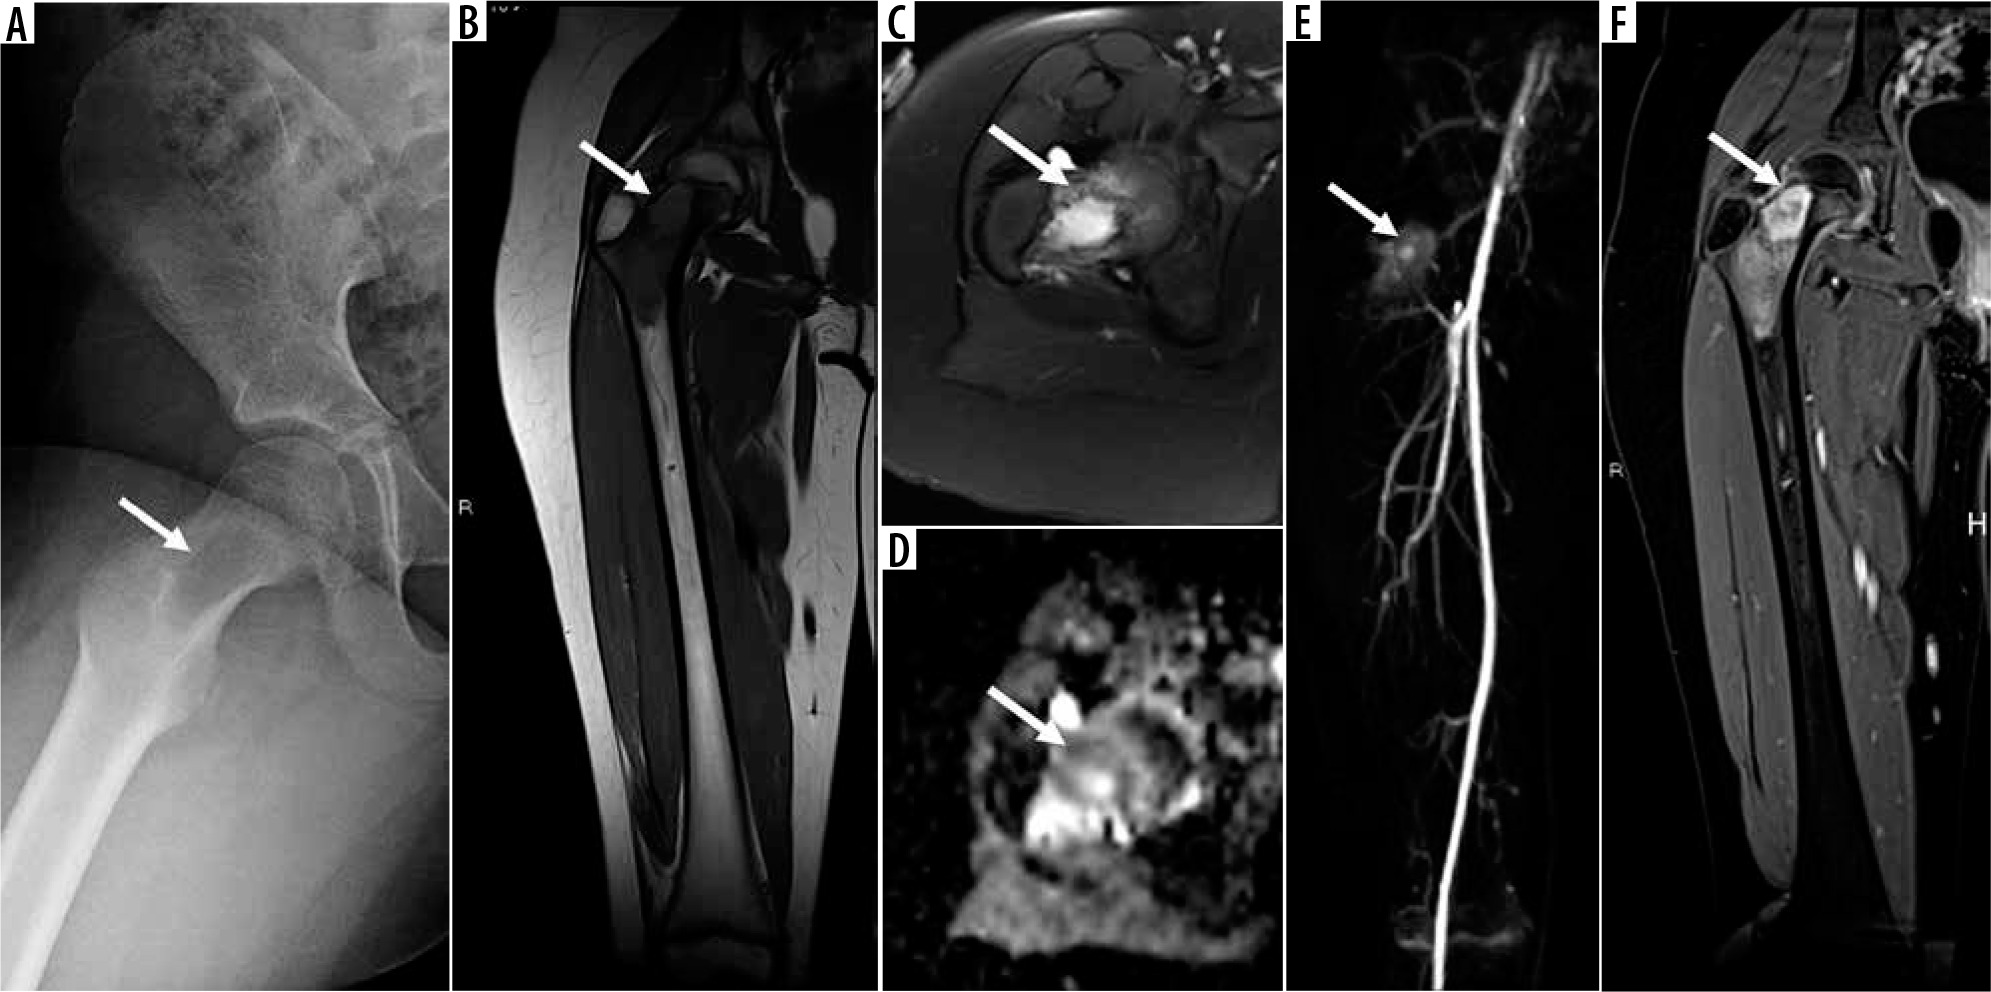
8-year-old female with right femoral neck Langerhans cell histiocytosis. Frog leg lateral radiograph of the right hip (A) shows a focal lytic skeletal lesion (arrow) in the right femoral neck. On magnetic resonance imaging (MRI), there is a proximal right femoral neck intramedullary lesion (arrow) that is isointense to skeletal muscle on coronal T1-weighted image (B) and hyperintense to skeletal muscle on axial T2-weighted fat-suppressed (FS) image (C) with moderate perilesional bone marrow oedema extending to the proximal femoral diaphysis. Axial apparent diffusion coefficient (ADC) map (D) shows lack of restricted diffusion with ADC values (≤ 1.0 × 10⁻³ mm2/s) ranging from 0.8 to 1.2. There is late arterial enhancement of this lesion (arrow) on dynamic contrast-enhanced-maximum intensity projection (E) and confluent internal enhancement (arrow) on coronal T1-weighted FS post-contrast magnetic resonance image through the right femur (F). Of note, imaging features of the langerhans cell histiocytosis, particularly in the axial skeleton, can overlap with infection as well as malignancy because it demonstrates aggressive MRI features including perilesional oedema, perilesional enhancement, periostitis, endosteal scalloping, and a soft tissue mass
Undifferentiated high-grade pleomorphic sarcoma
An additional major update in the most recent WHO classification of tumours of bone and soft tissues is the replacement of the term “malignant fibrous histiocytoma” with undifferentiated high-grade pleomorphic sarcoma of bone (UHGPS). Radiologic features of UHGPS include an aggressive, permeative lytic skeletal lesion with wide zone of transition that is T1-iso- to minimally hyperintense relative to skeletal muscle and minimally T2-hyperintense [30]. These tumours are treated similar to osteosarcomas. They can arise secondarily in pre-existing skeletal lesions or primary/de novo and are associated with a poor prognosis (~ 53% five-year survival rate) [30].
Haematopoietic tumours and tumour syndromes
Haematopoietic tumours (plasma cell myeloma, solitary plasmacytoma, and primary non-Hodgkin lymphoma of bone) and tumour syndromes (Li Fraumeni syndrome, enchondromatosis, multiple hereditary exostosis, neurofibromatosis, etc.) are not discussed because a thorough discussion is beyond the scope of this review.
Conclusions
The updated WHO classification of tumours of bone highlights new clinicopathological and genetic features to enable reliable and reproducible methods of diagnosis and lesion characterisation, which can then inform effective treatment selection. Radiography remains central to the detection and characterisation of bone tumours; however, MRI is not only optimal for locoregional staging but also for gaining wider acceptability for the characterisation of bone tumours. Although advanced MRI sequences such as DWI and DCE may provide insight into tumour biology, clinical management of bone tumours ultimately requires a multi-disciplinary approach with the radiologists playing an important role in this team.