


Introduction
Osteoid osteoma (OO) is a benign osteogenic tumour that commonly affects male gender in second decade of life [1-4]. Diagnosis is based on characteristic clinical and radiological findings. The main clinical symptom is pain that worsens at night and is relieved by NSAI drugs. Localisation may be classified as subperiosteal, intracortical, endosteal, and intramedullary according to localisation in bone layers, as well as intra/extra-articular according to articular proximity [2]. The main radiological finding of OO is characterised by a radiolucent nidus surrounded by reactive sclerosis. Reactive bone formation may be added according to localisation in the bone [1,2]. Because of disuse of the extremity due to pain, muscular atrophy may be seen in the affected extremity [5]. Synovitis may be present due to inflammation if the lesion is intraarticular as well [6-8]. Diagnosis of osteoid osteoma may be delayed if secondary radiological findings are more severe than the lesion itself. Although we are familiar with primary radiological findings of osteoid osteoma presented in the bone, we may be familiar with secondary radiological findings as muscle atrophy, oedema in peripheric soft tissue and bone marrow, joint effusion, or synovitis. There are very few reports about these secondary radiological findings [5-11]. In this article, the purpose was to demonstrate secondary radiological findings of OO in both paediatric and adult patients. This study is one of the very few studies with such a large case series.
Material and methods
The institution’s Ethical Committee approved the study (Number: 2529; Date: 17.09.2019). Radiographs, computed tomography (CT), and magnetic resonance (MR) images of the 152 patients admitted for radiofrequency ablation treatment with the diagnosis of OO in the institution’s radiology clinic between 2015 and 2019 were reviewed retrospectively from the Picture Archiving and Communication System (PACS). The patients were diagnosed as OO according to clinical and radiological features with the decision of the multidisciplinary tumour board, excluding differential diagnoses such as osteomyelitis or malignancy. Also, 32 (21%) of the patients had biopsy-proven diagnoses either by percutaneous biopsy (78%) in the institution or by excisional biopsy (22%) in previous hospitals.
Informed patient consent was obtained for all the patients, and approval was obtained from parents of paediatric patients who were 18 years old or younger. All the images were reviewed by the same radiologist in the same centre. Because most of the OOs had oval shaped nidus, the sizes of the niduses were given as a volume measurement.
The localisations of the OOs were classified according to body section and also according to proximity to articular joint (intra or extraarticular) and adjacency to bone layers and epiphysis line (subperiosteal, intracortical, endosteal, intramedullary, and epiphyseal) in both paediatric and adult populations. Peri-nidus sclerosis, periosteal reactive bone formation, bone marrow and soft tissue oedema, presence of synovial effusion, muscular atrophy in the affected extremity (compared to contralateral extremity), and posture deterioration were noted. Synovial effusion was evaluated in T2- and proton density (PD)-weighted MRIs; muscular atrophy was evaluated in pelvic cross-sectional images for only the OOs that were localised in lower extremities and pelvic bones (iliac, acetabulum, femur head-neck, or diaphysis of femur) by evaluating the thickness of pelvic muscles of affected extremities with comparing to a symmetric extremity. Also, posture deterioration was evaluated from erect pelvic radiographs.
For statistical analysis, Statistical Package for the Social Sciences (SPSS) for Windows (Version 21.0, Chicago, SPSS Inc.) was used. Descriptive statistics were given as number and percentage for categorical variables and as mean, standard deviation, minimum, maximum, and median for numerical variables. Ratios in independent groups were tested by c2 analysis. Statistical significance was defined as a p value ≤ 0.05.
Results
CT and MR imaging findings of a total of 152 patients (107 male and 45 female patients; mean age 17.9 years; age range 1-42 years; 66.4 % paediatric; 20% of all were in the first decade of life) with the diagnosis of OO were evaluated retrospectively. The median volume of the lesions was 189 mm3 (min: 22 mm3 [7 × 3 × 2 mm]; max: 1287 mm3 [15 × 15 × 11 mm]). Mean time to hospital admission was 13 months. Most of the lesions (87.5%) were localised in lower extremity bones. The localisations of the lesions are shown in Table 1. Among all the patients, 56% had extra-articular OO (65% in paediatrics) and 44% of had intraarticular (69% in paediatrics) OO. Regarding the localisation of the niduses in bone, 64% were intracortical, 16% were endosteal, 10% were subperiosteal, 7% were intramedullary, and 3% were in epiphysis line (Figure 1). Localisations of osteoid osteomas according to joint proximity and bone layers are shown in Table 2.
Table 1
Localisations of the osteoid osteomas
Table 2
Localisations of osteoid osteomas according to joint proximity and bone layers
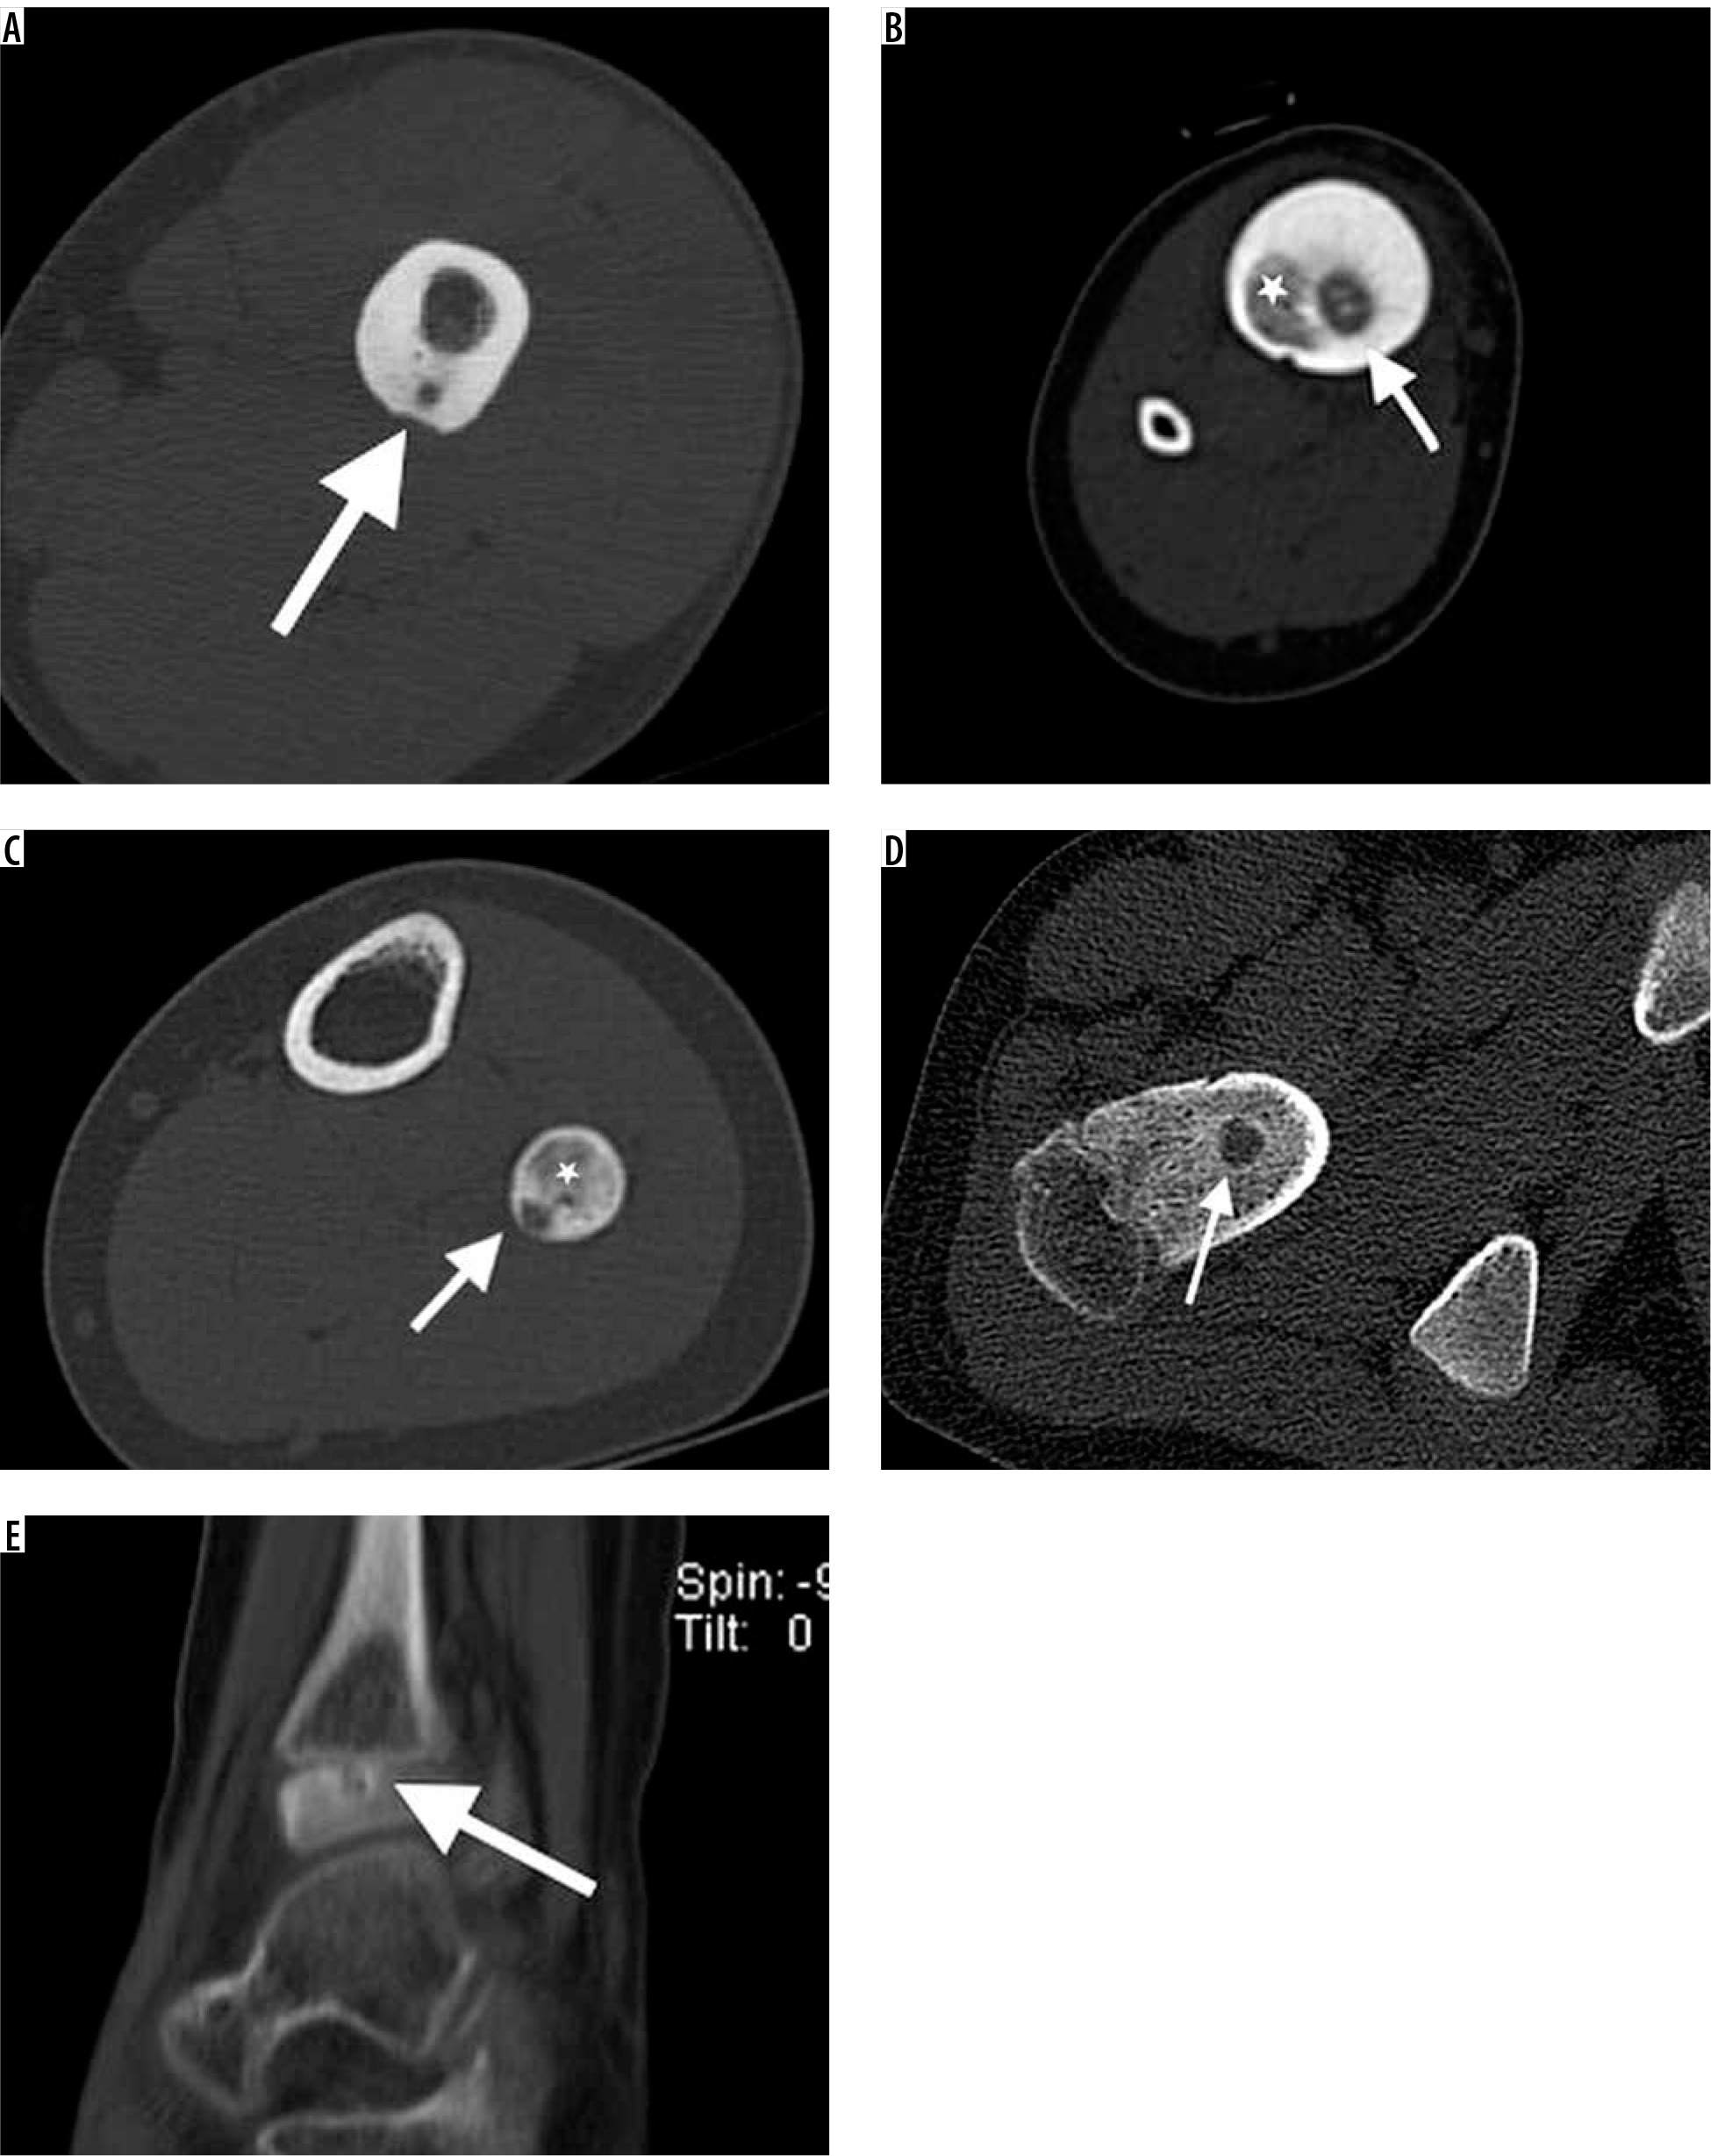
Figure 1
Localisations of niduses of osteoid osteomas (arrows) in bone layers on CTIs. A – Computed tomography shows a radiolucent nidus (arrow) in the middle of the cortex. Cortical thickening surrounding the radiolucent nidus is also noted. In Figures 1B and 1C, radiolucent niduses are seen with central sclerotic dots in endosteal (B) and subperiosteal (C) layers of diaphysis of tibia (B) and fibula (C). Note enlargement of the affected bones and ground-glass attenuating sclerosis within medullary cavities in both patients (star). D) Radiolucent nidus is seen without central sclerotic dot intramedullary layer of femur neck. Enlargement of the femur neck and ground-glass attenuating sclerosis within the medullary cavity is also noted in this patient. E) Sagittal CT scan through the ankle shows a radiolucent nidus without central calcification and with a small amount of sclerosis surrounding the nidus on epiphysis of distal tibia
In 44% of the patients, synovial effusion was presented in MRIs. In 89.4% of these, OO was localised in the joint. A total of 67% of the patients with synovitis had OO in femur head-neck localisation. Synovial effusion findings were presented significantly higher in OOs that were localised in the joint compared to OOs in extra-articular localisation (p < 0.005) (Figure 2). Secondary radiological findings of osteoid osteomas considering proximity to joint and bone layers are shown in Tables 3 and 4, respectively.
Figure 2
A 15-year-old boy with 3-year history of hip pain that awakened him at night and was relieved by anti-inflammatory drugs. Axial T2-weighted STIR-MR images show intraarticular osteoid osteoma with hyperintense nidus (arrow) and perilesional hypointense cortical sclerosis. Note extensive synovitis (star) throughout the joint that enlarges the articular joint space. There is accompanying oedema in bone marrow of femur neck and also in adjacent soft tissue. The size discrepancy between the two legs, due to muscular atrophy related to disuse of extremity, is apparent in these images
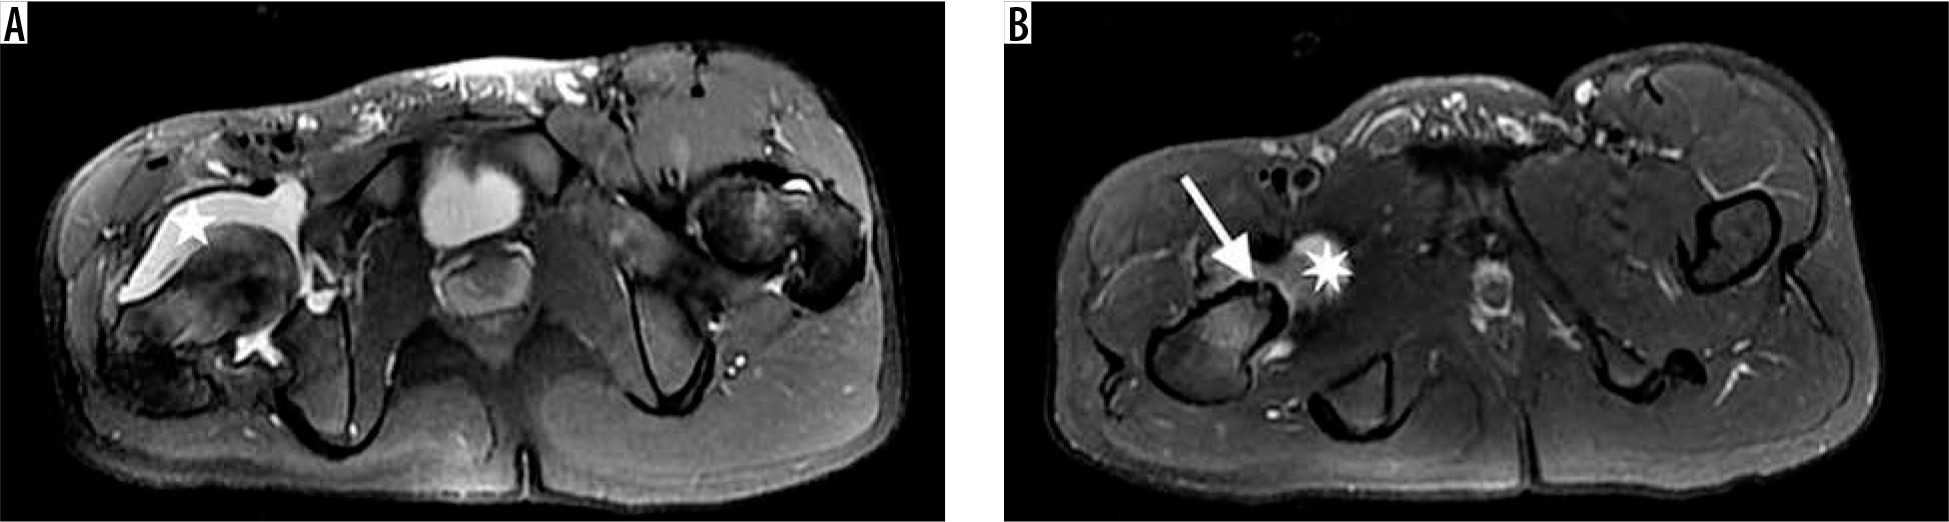
Table 3
Secondary radiological findings of osteoid osteomas considering proximity to joint
Table 4
Secondary radiological findings of osteoid osteomas considering localisation in bone layers
Of the 97 patients who had OO in lower extremities or pelvic bones, 73% had muscular atrophy as a secondary radiological finding (Figure 2). In 6% of them muscular atrophy was severe, and they had posture and gait disorders (Figure 3) with accompanying osteopaenia in the affected bone. A total of 56.9% of the patients with muscular atrophy had OO in femur head-neck localisation. Muscular atrophy findings were presented significantly higher in OOs that were localised in the joint compared to OOs in extra-articular localisation (p < 0.005).
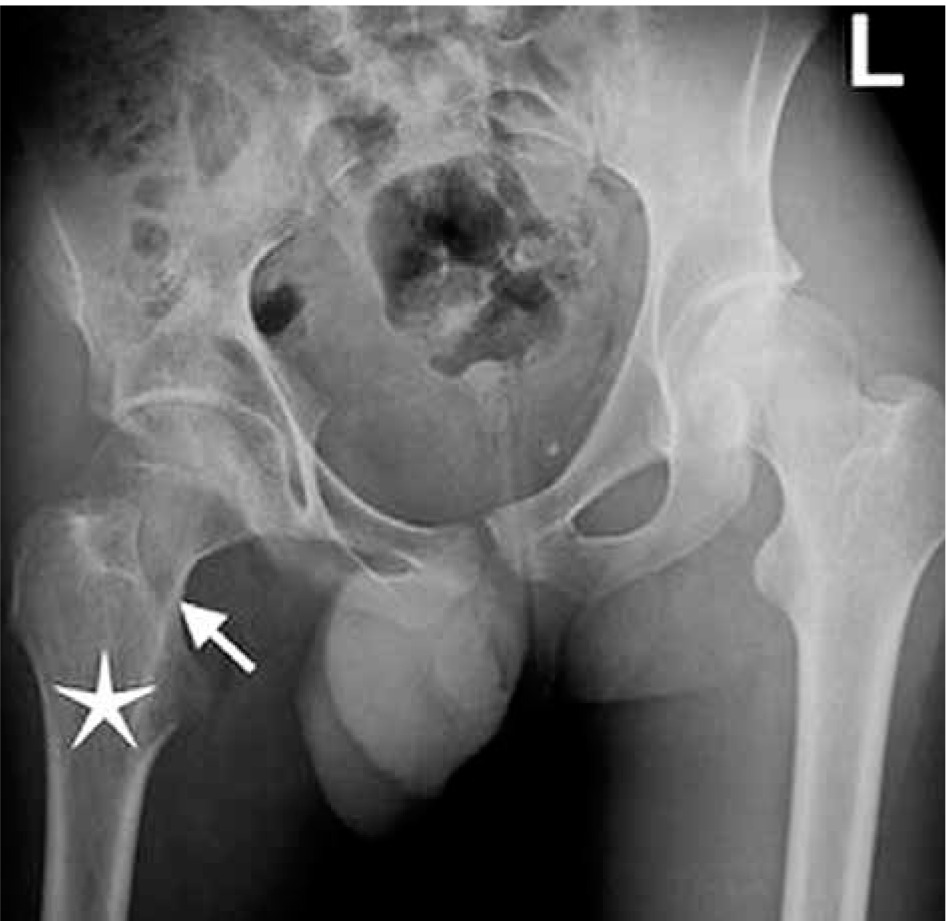
Figure 3
A 16-year-old boy presenting with gait disorder who had 4-year history of hip pain that worsened on nights and was relieved with aspirin. Anteroposterior radiograph image of pelvis demonstrates barely defined lucent nidus (arrow) with a thin peripheral sclerosis in neck of right femur. Note osteopaenia in right femur and right iliac bones and relative (compared to left extremity) hypodensity of thigh muscles due to atrophy. Right femur head is below the horizontal line compared to left side
Bone marrow and soft tissue oedema was present in all the patients. In 96% of the patients OOs caused peri-nidus sclerosis, while in 4% it did not. In 48% of the patients there was reactive periosteal bone formation around the nidus. There was no statistically significant difference between joint proximity and peri-nidus sclerosis or soft tissue-bone marrow oedema (p > 0.05). Reactive periosteal bone formation findings were presented significantly lower in OOs that were localised extra-articularly compared to OOs in intra-articular localisation (p < 0.005). 58% of the OOs that caused reactive periosteal bone formation were localised intra-articularly, and reactive periosteal bone formation was most severe in the intraarticular region (femur head and neck localisation) (Figure 4).
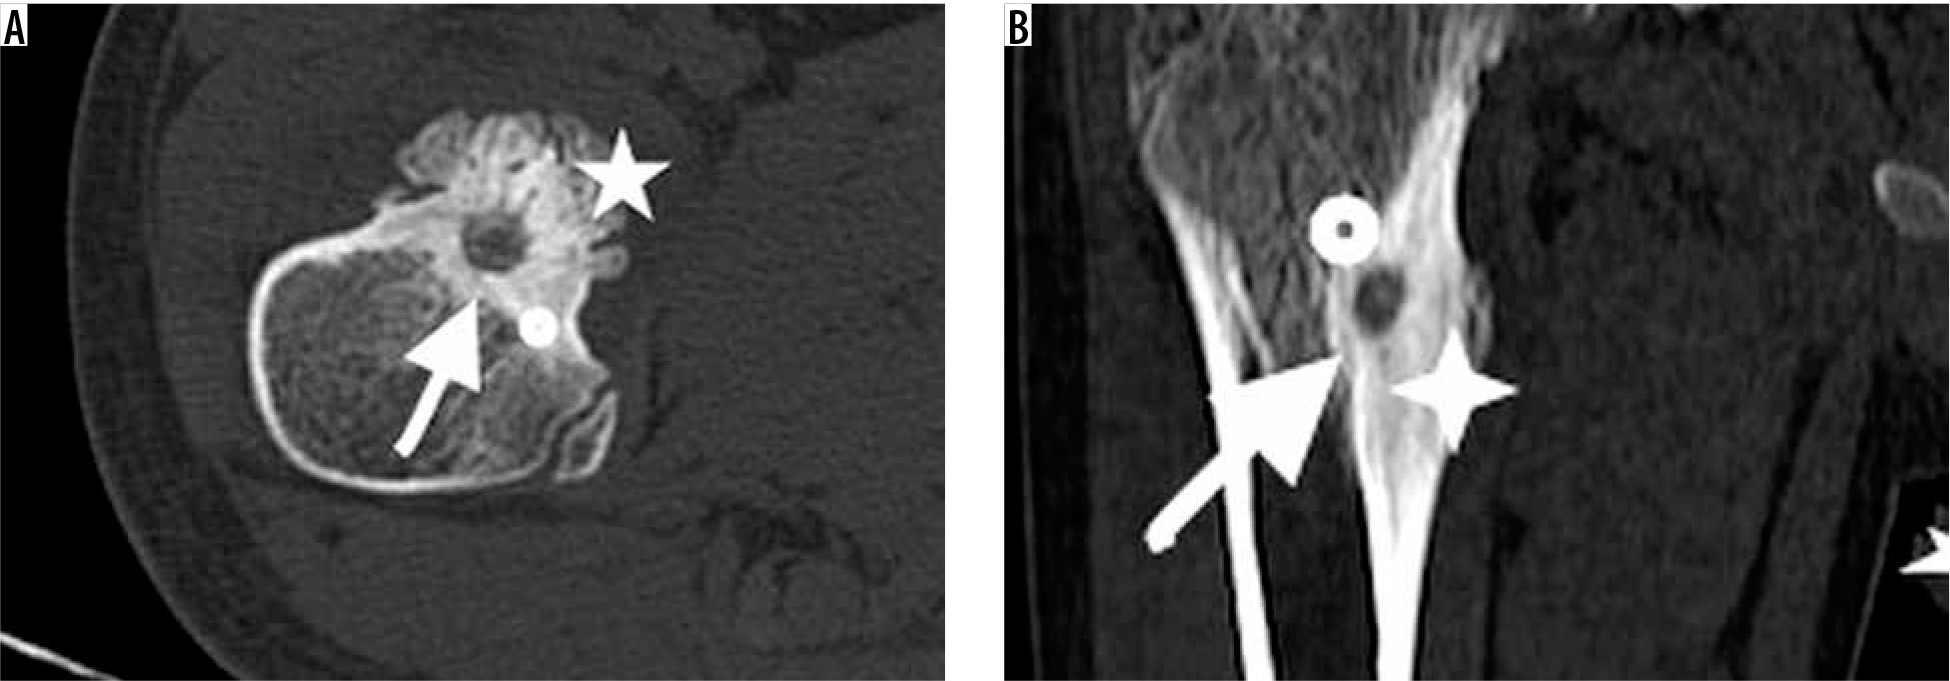
Figure 4
A 9-year-old boy with osteoid osteoma on right femur neck. Computed tomography shows a radiolucent nidus (arrow) with ground-glass radioopacity due to central sclerosis inside. Sclerosis surrounding radiolucent nidus also is noted (dot). A prominent reactive bone remodelling (star) is demonstrated throughout the periosteum. Note fusiform cortical thickening overlying nidus (B). This image may be misdiagnosed as malignancy without a detailed physical examination and lack of clinical history
There was no relationship between the localisations of OOs in the cortical layers (endosteal, subcortical, cortical, or intramedullary) and size of the niduses, severity of periosteal reaction, severity of muscular atrophy, or synovitis amount (p > 0.05).
Discussion
Primary radiological findings of OO are well known, and the diagnosis is easy if OO presents with typical clinical and radiological imaging features [1,2]. However, OO may present with secondary radiological findings such as reactive bone formation, synovitis, muscular atrophy, or posture-gait deterioration, especially when the OO is intra-articular or in an unusual localisation [5-11]. If the primary radiological findings are not prominent but secondary radiological findings are at the forefront, there may be a delay in diagnosis. In accordance with this, the duration until OO diagnosis was longer than 24 months in 33% of the patients in this study.
Reactive bone formation due to periosteum reaction may present as a common secondary radiological finding in OO, and it may mimic malignant bone tumours (Figure 4). To obtain a detailed history of the patient, to conduct a physical examination and to visualise the nidus in a radiological examination are important in this situation, so as not to misdiagnose the lesion and to plan the right treatment method. In this study, 48% of the patients had reactive periosteal bone formation around the nidus. Reactive periosteal bone formation was most severe in the intraarticular region (femur head and neck localisation).
Muscular atrophy may be seen as a secondary radiological finding due to disuse or reduced use of the affected extremity. Of the 97 patients who had OO in lower extremity bones, 73% had muscular atrophy as a secondary radiological finding because of disuse of the extremity due to pain. The degree of discrepancy was more prominent if the diagnosis was delayed and the localisation of the OO was more proximal. In 56.9% of the patients with muscular atrophy, OO was localised in femur head-neck. In 6% of the patients with muscular atrophy, atrophy was severe and they had posture and gait disorder. In three of the patients (one, three, and four years old), muscular atrophy was attributed to neurological reasons and they had brain MRI and neurological follow-up when they were first admitted to a hospital. Also, 40% of the patients who had OO in femur had lumbar or knee MRI because the pain mimicked sciatic or meniscal pathologies. Also, one patient had a knee meniscal operation because the oedema in bone marrow and soft tissue was misdiagnosed as meniscal pathology. All these patients were finally diagnosed with OO after having CT examination because of persistent pain.
Synovitis was another remarkable secondary radiological finding, especially in patients with intraarticular OO [10,11]. Although the definite reason for the mechanism in the development of synovitis is not apparent, there are some reports suggested that COX-2 expressed by the nidus may play a major role in resulting secondary synovitis of the involved joint in intra-articular OOs [11]. Among 44% of the all patients who had synovial effusion, in 89.4% the OO was localised in the joint. Radiological diagnose of synovitis in CT is not so easy. A joint enlargement may be seen with hypodense fluid presentation. In MRI the diagnosis of synovitis is much easier, with a prominent hyperintensity in T2- and PD-weighted images due to fluid. Also, hyperintensity due to oedema in adjacent bone marrow makes the diagnosis easier. As it is shown in the previous literature, MR is superior for the demonstration of bone marrow and soft tissue oedema and reactive synovitis in the diagnosis of OO [6]. Thus, it is though that MRI is more sensitive for the detection of pathology in the first evaluation. Although reactive oedema and synovitis findings are more prominent in MR, it is possible to overlook a nidus if there is not an obvious sclerosis or if MR images do not have high resolution (Figure 5) [12,13]. Because the MRIs were not enough to make correct diagnoses, all the patients were referred for CT examination due to high resolution of CT, and they had OO diagnosed after CT examination in this study.
Figure 5
A 14-year-old girl with 1-year clinical history of elbow pain and osteoid osteoma on metaphysis of distal humeral. She had joint effusion on first magnetic resonance imaging (MRI) and follow-up for tenosynovitis. She had follow-up MR on 6th (A) and 12th (B) months because the pain was not relieved. Although no bony abnormality was detected on the first MRI due to thick sections (A), a suspicious lesion which was hyperintense on T2 (B), hypointense on T1-weighted (C) images was detected on follow-up MRI. The patient was referred to computed tomography (CT) examination for further evaluation. The axial CT image (D) revealed the radiolucent nidus with central sclerosis on metaphysis of distal humeral

In 47% of the radiographies, niduses were not visible on second-look evaluation, even with the knowledge of OO diagnosis in this study. In 136 patients (90%) MRI was performed as a pre-diagnostic imaging method. Even, in 70% of all patients non-contrast-enhanced MRI was preferred as a first cross-sectional imaging method rather than CTI. This was attributed to many reasons. One of them is the age of the patients – most of the patients were of paediatric age, hence MRI was preferred due to being radiation-free. Second, since the diagnosis of OO is very hard and malignant tumours and osteomyelitis are in the differential diagnosis list, MRI was preferred as the first cross-sectional imaging modality because it is superior for the visualisation of soft tissue pathologies and masses, compared to CTI [4,6]. Another reason is that MRI is superior in visualising bone marrow oedema [6]. Although the nidus was visible in only 36% of the MRIs, the localisation of the lesion could be detected in all the MRIs. Hyperintensity on T2-weighted images due to bone-marrow and soft tissue oedema with or without synovial effusion pointed to a possible bone tumour. Hence, all the patients were referred to CT examination to better visualise bone structure, and they had a final diagnosis with CTI and typical clinical history. Although MRI is not enough to diagnose OO, it is valuable for the detection of lesions and for planning the CT examination localisation to avoid high doses of radiation. In MRI, if a patient with joint effusion has bone marrow oedema additionally and no obvious tumour could be detected, diagnosis of OO should be kept in mind at the top of the differential diagnosis list if the patient has typical pain symptoms. A CT examination may be planned to solve the problem. Nevertheless, OO without reactive bone formation, apparent bone sclerosis, or massive synovial effusion may be overlooked in CT examination without guidance of MRI.
As a shortcoming of this study, there was not any case with vertebral body localisation. This situation may be related to the possibility of overlooking an OO diagnosis in patients with dorsal-lumbar pain or scoliosis.
Conclusions
Diagnosis of OO is not easy, especially if the nidus is not apparent on radiographic images. Secondary radiological findings, such as muscular atrophy, synovitis, posture-gait deterioration, and reactive bone formation in a patient with continuous pain that is relieved by anti-inflammatory drugs may point to an OO.