


Introduction
Lesser foot metatarsalgia (MTG) is a common presenting complaint to the foot and ankle specialist, with Morton’s neuroma-bursal complex (MNBC) being one of the most frequent causes. A Morton’s neuroma is a mass, most commonly found in the third intermetatarsal space, caused by peri-neural fibrosis of the plantar digital nerve [1]. Post-operatively, resected neuroma specimens consist of a scarred intermetatarsal bursa and tangled vessels surrounding the abnormal nerve [2]. For this reason, it is more accurate to refer to the mass as a Morton’s neuroma-bursal complex. Diagnosis is usually made through a history and clinical examination. When imaging is requested, this typically takes the form of an ultrasound scan [3]. Ultrasound is recognised as having a high sensitivity and specificity for the detection of MNBC and is able to provide information on size and location in order to guide further intervention [4].
Apart from MNBC, there are other potential differential diagnoses for MTG. These include metatarsophalangeal joint degeneration, Freiberg’s disease, synovitis, bursitis, plantar plate tear and stress fracture [5]. The value of computed tomography (CT) in the investigation of MTG is often to evaluate the presence of arthritis or stress fractures [6]. CT can however also be used to assess soft tissue structures such as tendons and ligaments [7].
In our practice at a tertiary orthopaedic hospital, a cohort of patients underwent both ultrasound and CT to investigate the cause of their MTG. To our knowledge there are no previous studies comparing CT and ultrasound in the diagnosis of MNBC. Our aim was to decide if when reporting CT for MTG the webspaces should routinely be reviewed for the presence of MNBC. To do this we compared CT and ultrasound to determine the sensitivity and specificity of CT for the detection of MNBC.
Material and methods
Hospital review board approval was granted for the retrospective data collection used in this study. The reports on the radiology information system (RIS) of all CT and Ultrasound foot examinations between January 2007 and December 2019 were searched using the terms ‘bursa’, ‘Morton’s’ and ‘neuroma’. This obtained a yield of 3059 CT examinations and 8857 ultrasounds. These examinations were then cross-referenced to identify patients with both a CT and an ultrasound examination. This identified a total of 41 patients. 2 patients had bilateral ultrasound and CT examinations, resulting a total of 43 cases in our cohort.
Each CT was reviewed retrospectively by two fellowship-trained Musculoskeletal Radiology Consultants who were blinded to the ultrasound reports. The CT’s were all performed on a Siemens Somatom Sensation 4 (Siemens, Erlangen, Germany) (2007-2014) and Siemens Somatom Sensation AS (Siemens, Erlangen, Germany) (2014-2019) with spiral acquisition and 1.25 mm axial slices. Multi-planar reformats in the long axis parallel to the metatarsal shaft and short axis perpendicular to the metatarsal shaft were obtained. The images were reviewed on both soft tissue and bone windows. The presence or absence of a MNBC and its size and position was recorded. A MNBC was suspected when there was soft tissue density in the web spaces with obliteration of the fat.
The ultrasound studies were all performed on a Siemens Acuson S2000 (Siemens, Erlangen, Germany) by Consultant Musculoskeletal Radiologists, Musculoskeletal Radiology Fellows or a specialist Musculoskeletal Sonographer. The ultrasound report was taken as the reference standard and was recorded retrospectively by a separate author who was blinded to the CT findings. Again, the presence or absence of MNBC was recorded along with its size and position.
The CT and ultrasound data was tabulated. A true positive consisted of a CT report detailing the presence of a MNBC in the same location as given in the ultrasound report. A false positive consisted of a CT report detailing the presence of a MNBC when the ultrasound was negative. True negatives were both reports showing no MNBC. False negatives were determined when the CT showed no neuroma but the ultrasound was positive. Statistical analysis was performed using SPSS software.
Results
A total of 41 patients were identified (43 examinations). 32 (76%) patients were female, with an average age of 50 years (range of 17-77 years). The mean interval between CT and ultrasound was 17 months. There were 12 ultrasound examinations which demonstrated MNBC; the remaining 31 ultrasound examinations were negative for MNBC.
Compared to US as the reference standard, the mean sensitivity of CT for MNBC was 45.5% and the mean specificity is 62.5%. Mean diagnostic accuracy was 52.3% with a Youden’s index of 0.080. There was fair agreement between the two reviewers with Cohen’s κ of 0.62%. Results for individual reviewers are summarised in Table 1.
Table 1
Sensitivity and specificity for reviewer 1 and 2
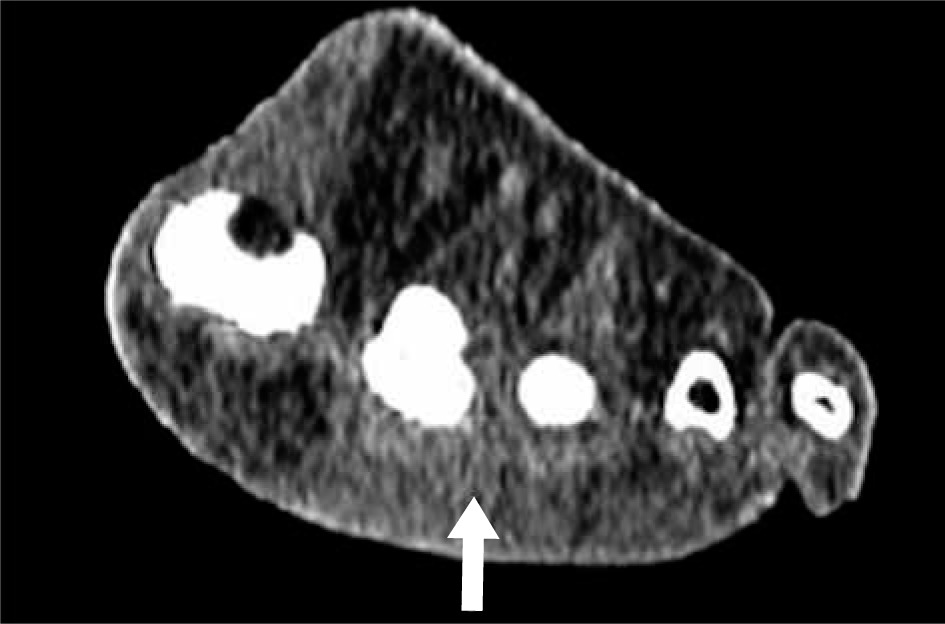
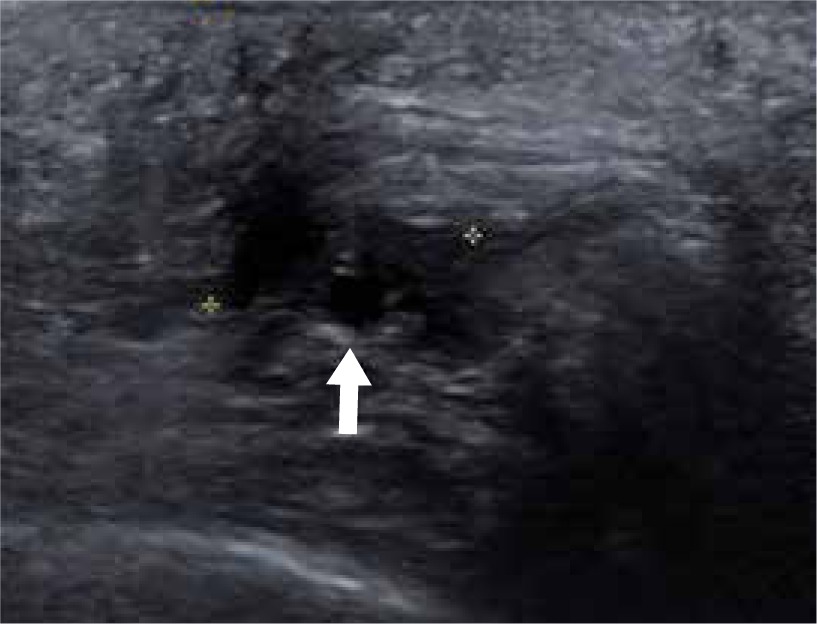
Figures 1 and 2 demonstrate the appearance of MNBC on CT and MRI.
Discussion
The results demonstrate that CT is a poor method for detecting MNBC across all parameters, including sensitivity and specificity. CT cannot reliably identify MNBC nor exclude them. Even when it is felt that CT shows a MNBC, our results demonstrate that this is more often a false positive than a true positive. There was also very poor inter-observer reliability with a 62.8% agreement between the two reviewers. It is undesirable to have a diagnostic test with such variability in its outcomes.
There are a number of possible reasons for the poor diagnostic performance of CT in the diagnosis of MNBC. In comparison to ultrasound and MRI, CT has poor soft tissue contrast discrimination, limiting the ability to detect small changes in the composition of the soft tissues. There is also little scope for dynamic imaging on CT.
As far as the authors are aware, this study is the first to examine the sensitivity and specificity of CT for MNBC. Prior evidence for the use CT in the detection of MNBC in the literature is limited. Turan et al. in 1991 investigated 15 patients who were clinically suspected to have MNBC and analysed their CT imaging features [7]. MNBC was detected on CT in 7 cases which were all confirmed at Surgery. It is not possible to examine the sensitivity and specificity of CT from Turan et al., due to the absence of any measure of identifying neuromas in the non-surgical group.
Limitations of this study are the retrospective nature, and in the operator dependency of ultrasound. Analysis of US was limited to the report and selected images available for review. The US studies were performed by various different members of the team. Nonetheless, ultrasound is widely accepted as a reliable method of detecting MNBC [11], with a sensitivity and specificity of 91% and 85% respectively in a recent review [8]. Typically, US depicts a rounded, well defined hypoechoic mass which is non-compressible in the intermetatarsal space [9]. Ultrasound has good soft tissue differentiation and allows for dynamic imaging with ability to perform forefoot squeeze, and Mulder maneuvers [10]. Further limitation comes from the relatively long length of time between the ultrasound and CT scans.
A total of 3059 foot CTs were performed in our institution for MTG in the study period, either for diagnosis or for planning surgical intervention. Given the large number of CTs performed, it is clinically important to determine whether MNBC can be detected on CT, as this may obviate the need for US if MNBC is suspected in this cohort. Given the poor diagnostic performance of CT for MNBC in our cohort, we suggest that review of the webspaces for the presence of MNBC in CTs performed for MTG is not of any use and the findings are likely to be misleading. If MNBC is clinically suspected, US should be performed regardless of findings on CT.