


Introduction
Osteoarthritis (OA) is a heterogeneous and multifactorial disease characterised primarily by the progressive loss of hyaline articular cartilage. Of all the joints, it is the knee joint that is most commonly affected [1]. The pathogenesis of knee OA has been linked to biomechanical and biochemical changes in joint cartilage, which includes inability to withstand normal mechanical stresses, limited nutrient supply, inadequate synthesis of extracellular matrix components, increased synthesis of proteinases, and overall apoptosis of chondrocytes [2].
Multiple imaging modalities have been used to study articular cartilage in health and disease. Conventional radiography provides an indirect measure of articular cartilage through evaluation of joint space but is unable to detect early chondral damage and focal cartilage loss [3].
Recently, magnetic resonance imaging (MRI) has become an important modality for assessment of pathologic changes in knee cartilage [4]. MRI is sensitive in detecting structural and functional changes during early stages of osteoarthritis, which is valuable for identifying the need for early treatment, monitoring response to treatment, and assessing efforts to prevent disease progression [5].
Standard magnetic resonance techniques include fat-saturated T2-weighted, proton density-weighted fast spin echo (FSE) sequences and T1-weighted spoiled gradient recalled echo (SPGR) sequences. These are inconclusive in quantifying early degenerative changes of the cartilage matrix such as proteoglycan (PG) loss [6]. With the advent of the 3-Tesla (3T) MRI, it is possible to evaluate the collagen network and proteoglycan content in the knee cartilage matrix with compositional assessment techniques such as T2 mapping, delayed gadolinium-enhanced MR imaging of cartilage, T1 rho imaging, sodium imaging, and diffusion-weighted imaging [7].
The most validated MRI image biomarker is T2 mapping, which is based on T2 relaxation time measurements. It correlates with the collagen structure and the water interaction with the extracellular matrix. Small changes in collagen hydration and organisation lead to cartilage degradation, and these early OA findings may be evident through T2 mapping before any other standard procedure [8].
T1 relaxation time is used as an alternative parameter to probe biochemical changes in cartilage [9,10]. The T1 parameter describes the spin-lattice relaxation in the rotating frame. It probes the slow-motion interactions between motion-restricted water molecules and their local macromolecular environment. The extracellular matrix in the articular cartilage provides a motion-restricted environment to water molecules. Changes in the extracellular matrix, such as PG loss, are therefore reflected in measurements of T1. Both T1 and T2 can probe slow motion of water protons describing different MR relaxation mechanisms, thus providing complementary information regarding macromolecular changes in cartilage.
Because OA is a multi-systemic disease, the origin and progression of which is not attributable to disease in only one tissue, such as articular cartilage, but also to disease in other tissues of the joint, including the subchondral bone, synovium, capsule, and meniscus. Thus, attention is also focused on the meniscus because its structure is similar to that of hyaline cartilage [11]. Menisci and hyaline cartilage contain mainly water, collagen, and proteoglycans. T2 and T1 relaxation time measurements are useful non-invasive techniques for identifying early cartilage degeneration and changes in biochemical composition of cartilage and menisci.
Quantitative and physiological imaging of the articular cartilage and menisci by MRI is an important step in OA research, and has become an essential tool in epidemiologic investigation and for development of therapies attempting to modify cartilage structure. With the improvement in cartilage resurfacing procedures and development of disease modifying drugs for OA, MR imaging of the articular cartilage and menisci is a promising noninvasive method to monitor early cartilage degeneration or restoration, and response to therapeutic procedures. This allows clinicians to noninvasively assess the cartilage, rendering consistent outcome measures, and thus preventing the need to perform an arthroscopy or a biopsy.
In this study, we aim to analyse the changes in morphology and T1 and T2 relaxation times of articular cartilage and menisci in normal healthy volunteers and in patients of early osteoarthritis of the knee using 3T MRI.
3T MRI T1 and T2 mapping to detect and quantify cartilage matrix and meniscal degeneration between normal healthy volunteers and early osteoarthritis patients.
Material and methods
Study population
The study was conducted in the Department of Radiodiagnosis. This was a cross-sectional study. The study was conducted in 25 patients of either sex with symptoms and radiographic findings of early osteoarthritis of the knee referred from the Department of Orthopaedics.
Ten healthy adult volunteers drawn from patient’s relatives/hospital employees/colleagues were also included in the study.
Inclusion criteria
For patients
In patients with clinical suspicion of early osteoarthritis, plain radiograph was done in the standing, weight-bearing position (antero-posterior view) required for Kellgrens-Lawrence (KL) grading [12]. Patients with KL grade I and grade II (early osteoarthritis) were included in the study.
Exclusion criteria
Outcomes
Primary outcome – to compare the thickness of articular cartilage and menisci; and average T1 and T2 relaxation times of cartilage and menisci in patients with early OA of the knee with normal healthy volunteers.
Methodology
For patients
The procedure was explained to the patient and informed consent in vernacular language was obtained in every case. Clinical details like age, sex, relevant clinical examination and KL grade on plain radiograph of knee in patients with OA of the knee was recorded.
Patients with KL grade I and grade II OA were taken for MRI of the knee. In the case of bilateral knee joint osteoarthritis, MRI was performed for the knee that was more severely affected.
For normal healthy volunteers
The procedure was explained to the volunteers, and informed consent in vernacular language was obtained in every case. Relevant details were recorded, and MRI of the dominant knee joint was performed in healthy volunteers. The dominant knee was identified by asking the control subject which leg he or she would use to kick a ball.
Magnetic resonance imaging
The study was conducted on 3-TESLA MR imaging (MAGNETOM SKYRA). Cartilage-specific T1 and T2 sequences were obtained in multiple planes using a 15-channel dedicated knee coil in addition to standard sequences mentioned below:
axial and coronal T1-weighted turbo spin-echo (TSE) sequence,
sagittal proton density fat suppressed TSE sequence,
three-dimensional (3D) T2-weighted double echo steady state (DESS) sequence,
sagittal T2-weighted TSE sequence,
3D T2-weighted spoiled gradient recalled echo (SPGR) sequence,
sagittal T1 anatomical map,
sagittal T2 anatomical map,
coronal T1-weighted turbo inversion recovery magnitude (TIRM) sequence,
MRI findings were recorded and analysed as follows:
a) cartilage thickness:
Quantitative articular cartilage thickness analysis was done. The articular cartilage of the knee joint was subdivided into regions as shown in Figure 1. The mean articular cartilage thickness of the all the regions was calculated.
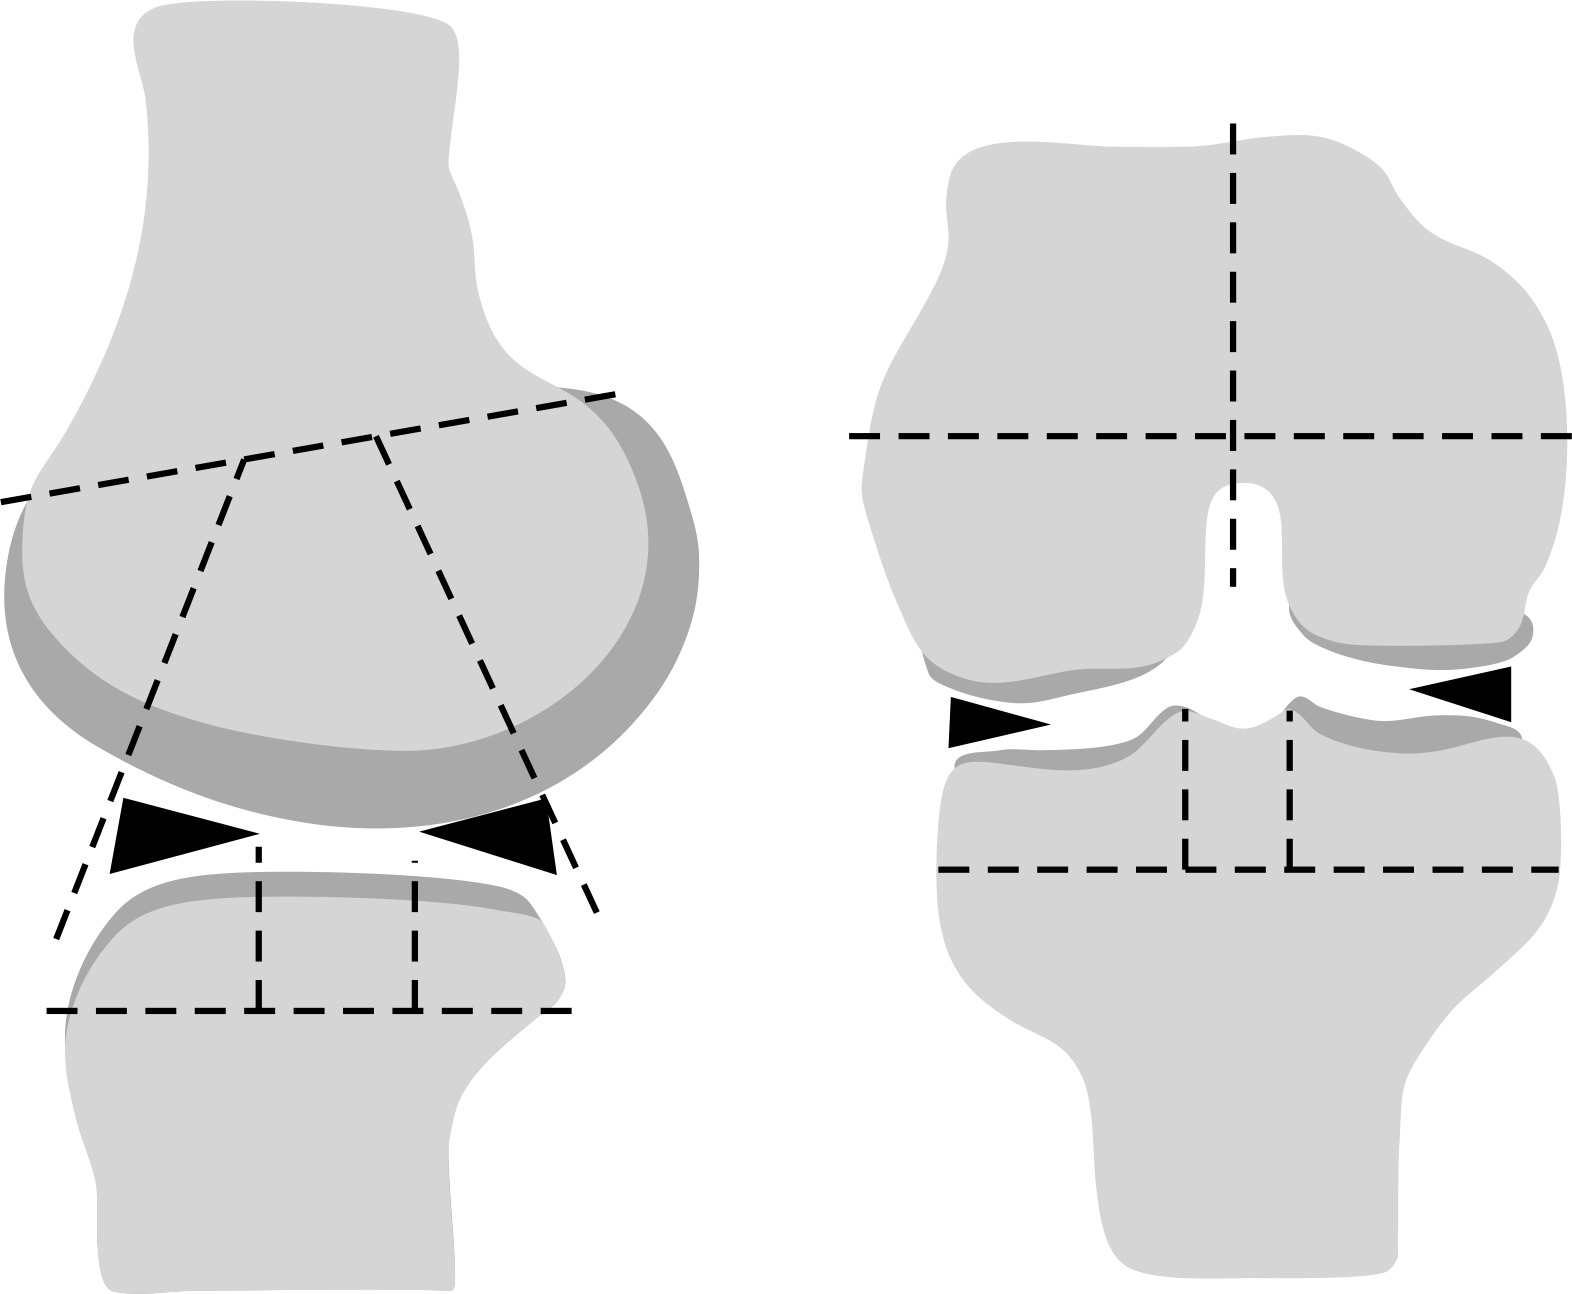
Regional subdivision of the articular surfaces.
The femur and tibia were divided into medial (M) and lateral (L) regions, with the trochlear groove of the femur considered part of the M region (right image). Region S represents the portion of the tibia beneath the tibial spines. The femoral and tibial surfaces are further subdivided into anterior (A), central (C), and posterior (P) regions (left image). Region A of the femur corresponds to the patellofemoral articulation; region C is the weight-bearing surface, and region P is the posterior convexity that articulates only in extreme flexion. Region C of the tibial surface corresponds to the uncovered portion between the anterior and posterior horns of the meniscus centrally and the portion covered by the body of the meniscus peripherally as shown in Figure 1.
b) meniscal thickness:
Medial and lateral menisci were subdivided into anterior horn, body, and posterior horn. The thickness of menisci was taken in these three sub-regions and then the average thickness of medial and lateral menisci was calculated.
c) T1 and T2 relaxation times of cartilage and menisci:
For calculation of T1 and T2 relaxation times, the femur and tibia were again divided into medial and lateral regions with the trochlear groove of the femur considered part of the M region. The femoral and tibial surfaces were further subdivided into anterior, central, and posterior regions. T1 and T2 relaxation time measurements were obtained at appropriate regions of interest in regional subdivisions of articular cartilage. Average T1 and T2 relaxation time values were then calculated for articular cartilage in different compartments of the knee joint.
T1 and T2 relaxation times were also taken at appropriate region of interests in regional subdivisions (anterior horn, body, and posterior horn) of medial and lateral menisci. Average T1 and T2 values were then calculated for both the menisci.
Patient information sheet
You are being invited to participate in a research study.
Before you take part in this research study, we wish to explain the study to you and give you the chance to ask questions. Please read carefully the information provided here. If you agree to participate, please sign the informed consent form.
Title: “T1 and T2 mapping of articular cartilage and menisci in early osteoarthritis of the knee using 3-Tesla MRI.”
Introduction: This statement describes the purpose, procedures, benefits, risks, and discomforts of the study and your right to withdraw from the study at any point of time.
Purpose: This study involves MRI of patients with early OA of the knee and a comparison of changes in articular cartilage and menisci with normal healthy volunteers.
Study procedure: Your relevant clinical history and investigations will be recorded; magnetic resonance imaging will be performed using dedicated extremity coil.
Benefits: Any new information that comes to light regarding osteoarthritis of the knee will help in further management of this disease.
Possible risks: You will be treated for any study-related adverse event or injury at no additional cost at this hospital.
Confidentiality: Records of your study participation will be kept confidential. Any publication of data will not identify you by name. By signing the consent form, you authorise the sharing of your study-related medical records to the regulatory authorities and the Institutional Ethical Committee.
Information regarding withdrawal: You have the right to withdraw from the study at any time during its course without any prejudice to you or your family’s right to undergo future treatment.
Statistical analysis
The collected data were entered in an MS-excel spreadsheet, and analysed and statistically evaluated using SPSS-21 (Statistical Package for the Social Sciences, Version 21).
Quantitative data was expressed by mean and standard deviation. The normalcy of distribution was assessed using Shapiro-Wilk test while Levene’s test was used to determine the homogeneity of variance. The average thickness of articular cartilage and menisci was calculated in each compartment of the knee joint in healthy volunteers and osteoarthritis knee patients. The average T1 and T2 values of articular cartilage and menisci were calculated in each compartment of knee joint in healthy volunteers and in osteoarthritic knee joints.
Qualitative data were expressed as proportions and percentages.
Statistical tests of significance were applied accordingly to compare average cartilage and meniscal thickness, and average T1 and T2 values, between healthy volunteers and patients with early osteoarthritis of the knee. The data were normally distributed in the two groups (healthy volunteers and early OA patients), and thus the two groups were compared using an “unpaired t test” for continuous variables. P-value of < 0.05 was considered statistically significant.
Results
A total of 25 patients with symptoms and radiographic findings suggestive of early OA of the knee were included in the study and underwent 3-Tesla MR imaging (MAGNETOM Skyra) using 15-channel dedicated knee coils.
Our study group comprised 11 males (44%) and 14 females (56%) with ages ranging from 32 to 63 years. The majority of the patients belonged to age group of 41-60 years.
Of the 25 patients included in the study, all of them (100%) had pain in either unilateral or bilateral knees. Eighty-four per cent presented with difficulty in walking and 76% reported difficulty in squatting. Out of the 25 patients evaluated for early OA on plain radiographs, nine (36%) had KL grade I OA and 16 (64%) had KL grade II OA.
The mean and standard deviation for cartilage thickness was calculated in each compartment of the knee for healthy volunteers and OA patients. The average thickness of articular cartilage ranged from 1.40 mm to 1.52 mm in OA patients and from 1.59 mm to 1.67 mm in healthy volunteers. There was no significant difference in average thickness of articular cartilage for any compartment between OA patients and healthy volunteers, with p value > 0.05 (Table 1).
Table 1
Comparison of average thickness of articular cartilage in healthy volunteers and osteoarthritis patients
The average thickness of medial meniscus ranged from 3.39 mm to 4.31 mm in healthy volunteers and from 3.42 mm to 4.46 mm in patients with early osteoarthritis. The average thickness of lateral meniscus ranged from 3.25 mm to 4.15 mm in healthy volunteers and from 2.91 mm to 4.33 mm in early OA patients. There was no significant difference in average thickness of medial and lateral meniscus in healthy volunteers and in patients with early OA of the knee, with p value > 0.05 (Table 2).
Table 2
Comparison of average thickness of medial and lateral meniscus between healthy volunteers and osteoarthritis patients
The average T1 relaxation time values obtained in our study for articular cartilage ranged from 886.59 ms to 928.25 ms for healthy controls and from 1035.39 ms to 1141.97 ms for patients with early OA. T2 relaxation time values obtained in our study range from 45.04 ms to 46.9 ms for healthy volunteers and from 54.11 ms to 55.03 ms for patients with early OA. We observed that the T1 and T2 relaxation times of articular cartilage were significantly higher in all the compartments of the knee in patients with early OA as compared to those of healthy volunteers, with p value < 0.05 (Tables 3 and 4).
Table 3
Comparison of average T1 relaxation times of articular cartilage (in different compartments – MFC, MTC, LFC, and LTC) in healthy volunteers and osteoarthritis patients
Table 4
Comparison of average T2 relaxation times of articular cartilage (in different compartments) in healthy volunteers and in osteoarthritis patients
It was also observed that the average T2 relaxation times in patients with KL grade I OA ranged from 51.93 ms to 54.79 ms, and in patients with KL grade II OA the T2 values ranged from 55.07 ms to 56.93ms. The T2 relaxation time values were higher in KL grade II as compared to KL grade I; however, the difference was not statistically significant, with p value > 0.05 (Table 5).
Table 5
Average T1 and T2 relaxation times in articular cartilage of osteoarthritis patients vs. Kellgrens-Lawrence (KL) grades evaluated on plain radiographs
Average T1 relaxation times in patients with KL grade I OA ranged from 920.34 ms to 1034.52 ms, and in patients with KL grade II OA the T1 values ranged from 1092.47 ms to 1203.05 ms. The difference reached a statistically significant level (p < 0.05) in the medial compartment of the knee joint whereas no significant difference in T1 values was observed in the lateral compartment of the knee joint (p > 0.05) (Table 5).
The average T1 relaxation time of medial meniscus in our study ranged from 610.91 ms to 969.21 ms in healthy volunteers and from 764.91 ms to 1272.47 ms in patients with early OA of the knee (p < 0.05). The average T1 relaxation time of lateral meniscus ranged from 611.54 ms to 1021.22 ms in healthy volunteers and from 790.90 ms to 1202.32 ms in early OA patients (p < 0.05) (Table 6).
Table 6
Comparison of average T1 relaxation times of medial and lateral meniscus between healthy volunteers and osteoarthritis patients
The average T2 relaxation time of medial meniscus in our study ranged from 17.14 ms to 24.94 ms in healthy volunteers and from 19.86 ms to 40.34 ms in patients with early OA of the knee (p < 0.05). The average T2 relaxation time of lateral meniscus ranged from 17.8 ms to 27.4 ms in healthy volunteers and from 19.35 ms to 41.07 ms in early OA patients (p < 0.05) (Table 7). Both average T1 and T2 relaxation times of medial and lateral menisci were significantly higher in patients with OA when compared with those of healthy volunteers.
Table 7
Comparison of average T2 relaxation times of medial and lateral meniscus between healthy volunteers and osteoarthritis patients
Discussion
The present study was undertaken to detect and quantify the cartilage matrix and meniscal degeneration in patients with features suggestive of early OA of the knee and to compare them with normal healthy volunteers.
A total of 25 patients with symptoms and radiographic findings suggestive of early OA of the knee were included in the study, of whom 11 were males (44%) and 14 were females (56%) with their age ranging from 32 to 63 years. This was consistent with the findings of a cross-sectional study conducted by Singh et al. [13] in the Indian population, which stated that OA of the knee was more common in females than in males, and its prevalence increases with age.
Clinical presentation of patients
All the patients evaluated had pain in either unilateral or bilateral knees. A few patients, in addition, had difficulty in walking, difficulty in squatting, stiffness, and swelling in knee joints. This was in agreement with a previous study conducted by Altman et al. [14], which stated that OA invariably presents with joint pain in addition to other symptoms like joint stiffness, difficulty in squatting, and joint swelling.
Plain radiographs were obtained for patients with clinical symptoms of OA of the knee in a standing, weight-bearing position (antero-posterior view), and grading of OA of the knee was done by Kellgren and Lawrence grade [15] (KL grade). Those patients with early OA on plain radiographs, i.e. KL grade I and KL grade II, were included in the study. Out of the 25 patients evaluated for early OA, nine (36%) had KL grade I OA and 16 (64%) had KL grade II OA.
Comparison of average thickness of articular cartilage in healthy individuals and in patients with early osteoarthritis of the knee
The mean and standard deviation for cartilage thickness was calculated in each compartment of the knee joint for healthy volunteers and OA patients (Figures 2 and 3). No significant difference was observed in the average thickness of articular cartilage for any compartment between OA patients and healthy volunteers (p > 0.05). Watson et al. [16] conducted a study in which some OA patients displayed cartilage thickening whereas others showed cartilage loss. The actual onset of disease process is not well defined, which posed a major challenge in the assessment of cartilage morphology in early OA patients. Because of the slow progression of the disease [17], it is difficult to identify the right “time window” in which cartilage degeneration and deformation occurs, and limitations of cross-sectional analyses also arise from the large inter-subject variability of normal cartilage thickness. This increased the variability of longitudinal observations and substantially reduced the capability of demonstrating efficacy for structure-modifying therapies.
Figure 2
A) Plain anterior-posterior radiograph of right knee joint showing medial joint space narrowing – KL score I1. B) Sagittal T1 weighted SPGR image shows thinning of medial femoral and tibial articular cartilage. C) Sagittal T1 weighted SPGR image shows thinning of lateral femoral and tibial articular cartilage. D) Sagittal T2 weighted DESS image showing medial femoro-tibial compartment (average thickness of articular cartilage in MFC ~1.28 mm and MTC ~0.83 mm). E) Corresponding color coded sagittal T1 map of medial femoro-tibial compartment (average T1 relaxation time of articular cartilage [in ROI 1, 2 and 3] for MFC ~1084.57 ms and [in ROI 4, 5 and 6] MTC ~936.3 ms). F) Color coded sagittal T2 map of medial femoro-tibial compartment (average T2 relaxation time of articular cartilage (in ROI 1, 2 and 3) for MFC ~60.25 ms and (in ROI 4, 5 and 6) for MTC ~55.71 ms] G) Sagittal T2 weighted DESS image showing lateral femoro-tibial compartment (average thickness of articular cartilage in LFC ~1.76 mm and LTC ~4.36 mm). H) Corresponding color coded sagittal Tl map of lateral femoro-tibial compartment (average T1 relaxation time of articular cartilage [in ROI 1, 2 and 3] for LFC ~1052.53 ms and [in ROI 4, 5 and 6] for LTC ~1189.78 ms). I) Color coded sagittal T2 map of lateral femoro-tibial compartment (average T2 relaxation time of articular cartilage [in ROI 1, 2 and 3] for LTC ~59.6 ms and [in ROI 4, 5 and 6] for LTC ~63.91 ms). J) Coronal Tl weighted STIR image shows average thickness of body of medial meniscus. K) Sagittal T1 weighted SPGR image shows average thickness of anterior and posterior horn of medial meniscus L) and M) Color coded sagittal T1 map shows average T1 relaxation time (in ROI 1, 2 and 3) of medial meniscus ~911.34 ms. N) and O) Color coded sagittal T2 map shows average T2 relaxation time (in ROI 1, 2 and 3) of medial meniscus ~27.54 ms. P) Coronal T1 weighted STIR image shows average thickness of body of lateral meniscus (Q). Sagittal T1 weighted SPGR image shows average thickness of anterior and posterior horn of lateral meniscus R) and S) Color coded sagittal T1 map shows average T1 relaxation time (in ROI 1, 2 and 3) of lateral meniscus ~797.01 ms. T) and U) Color coded sagittal T2 map shows average T2 relaxation time (in ROI 1, 2 and 3) of lateral meniscus ~24.58 ms
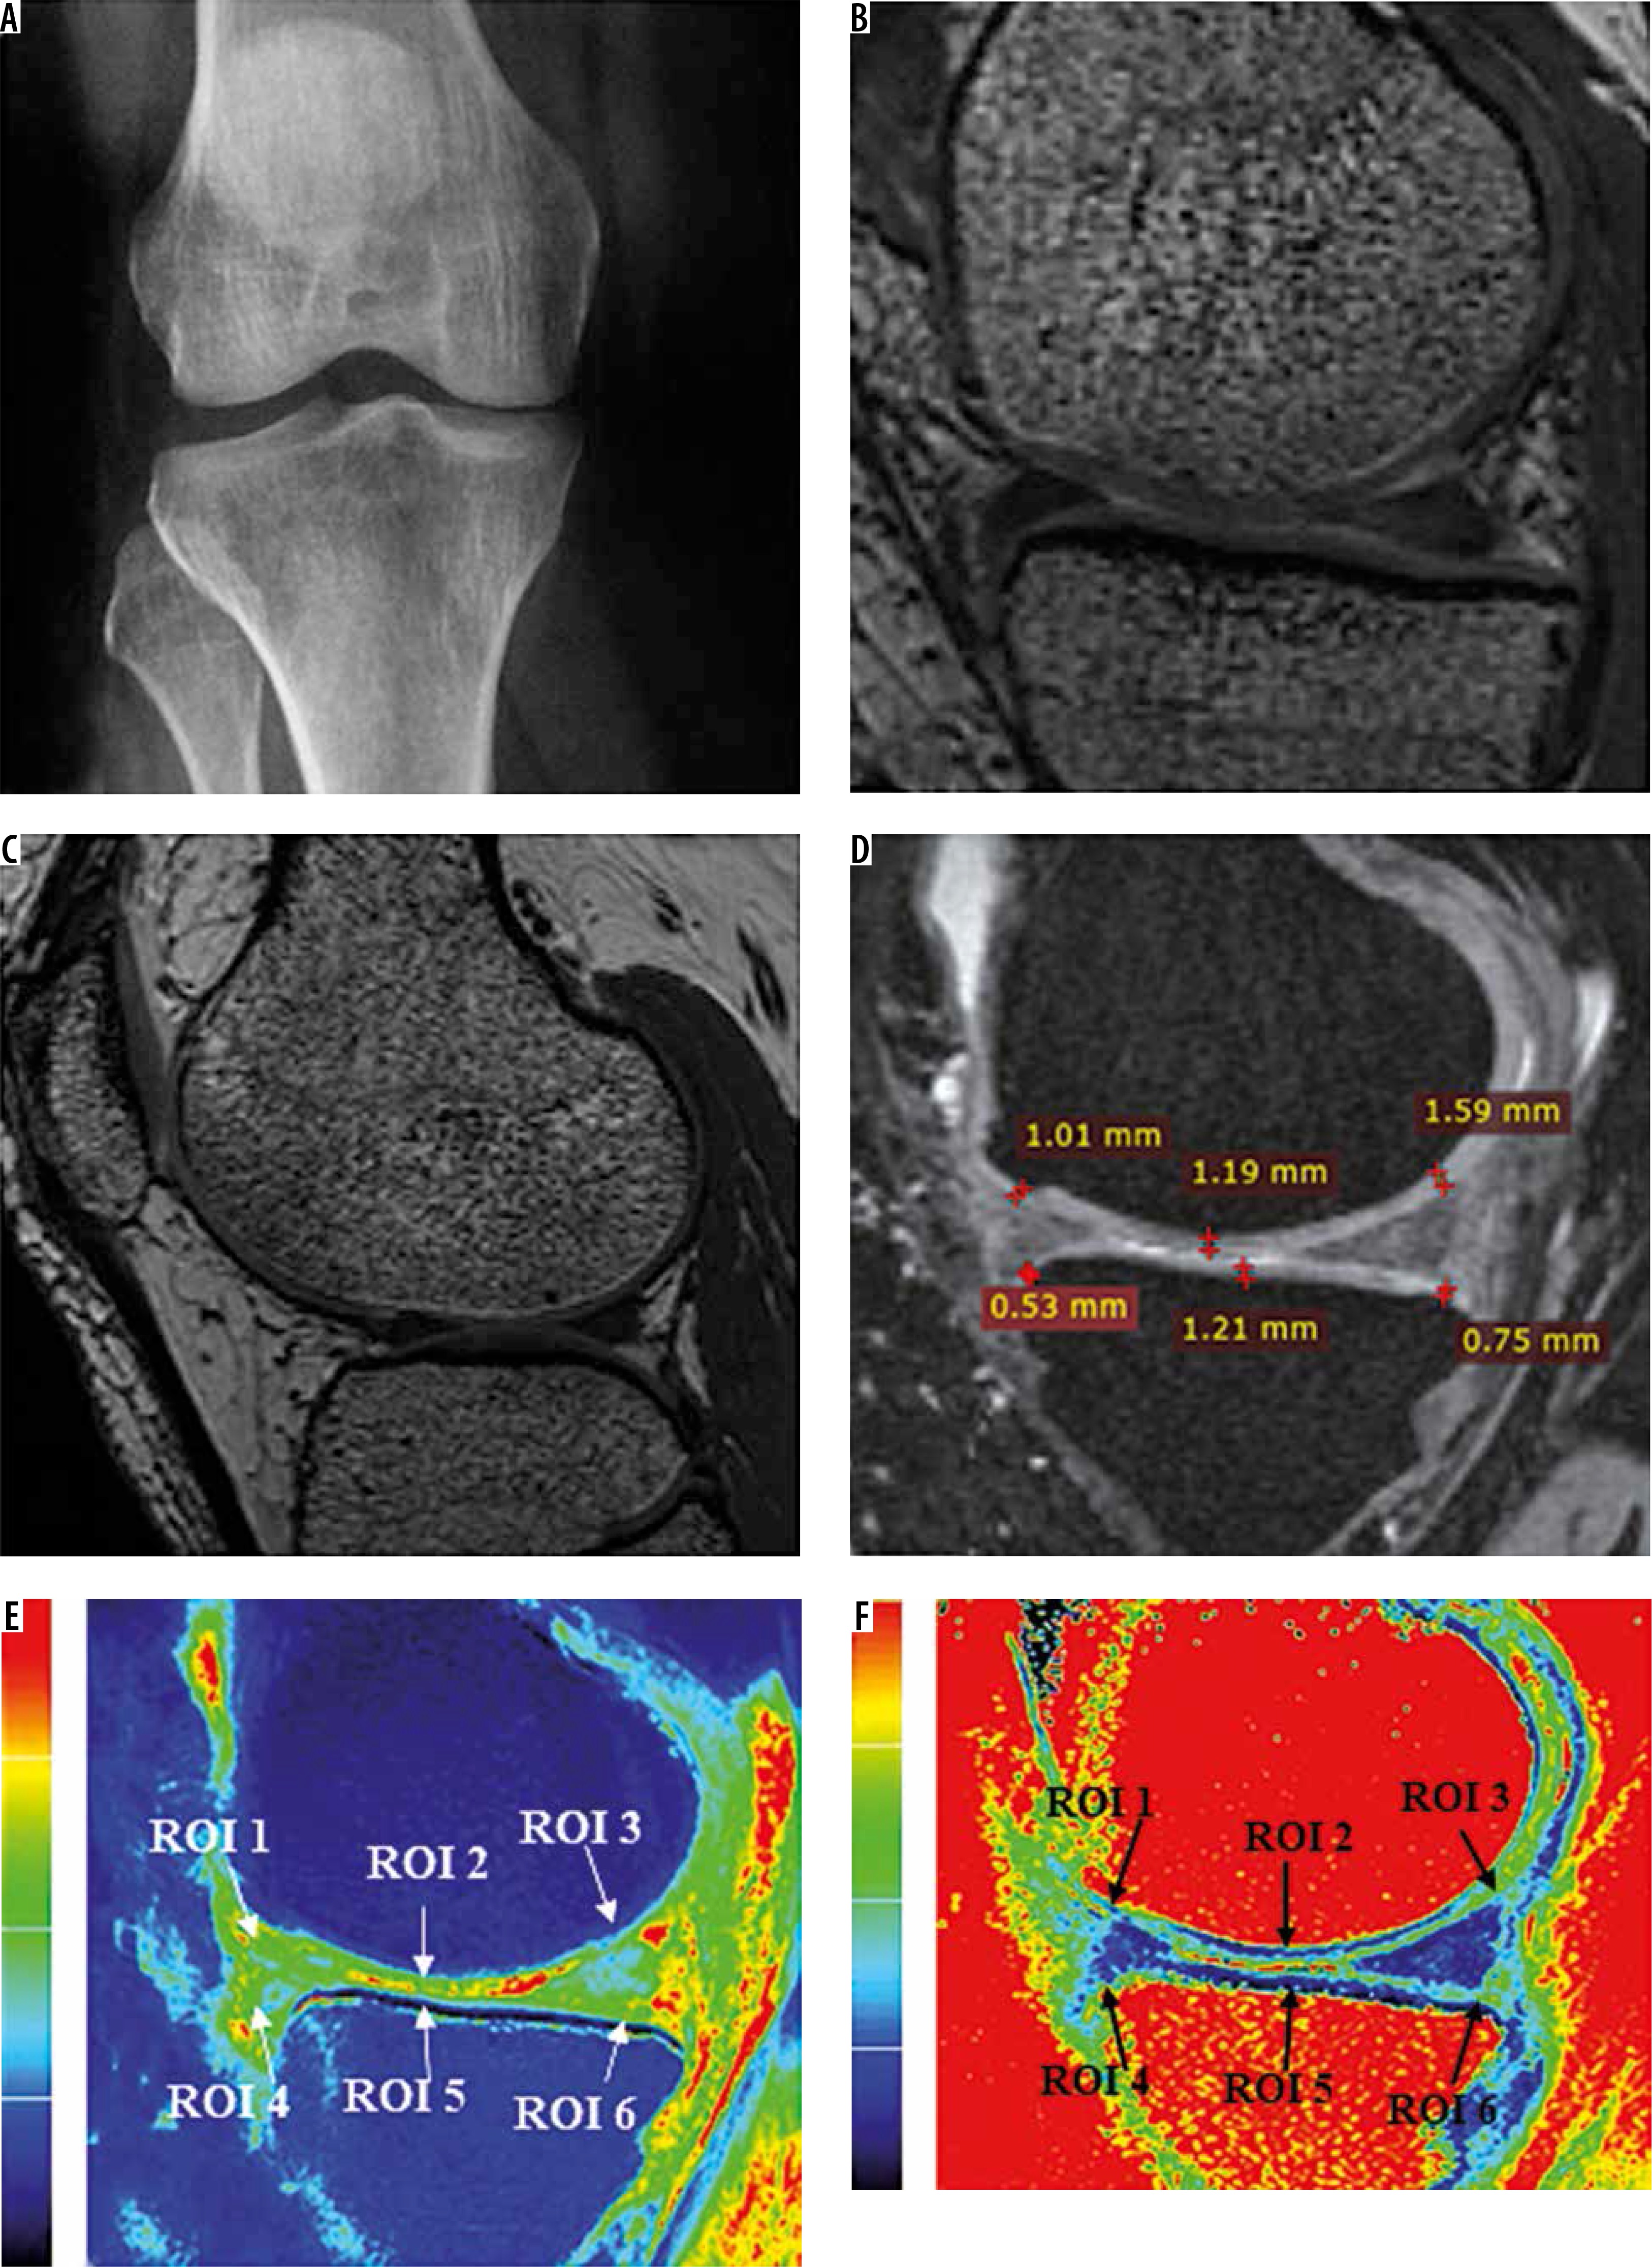
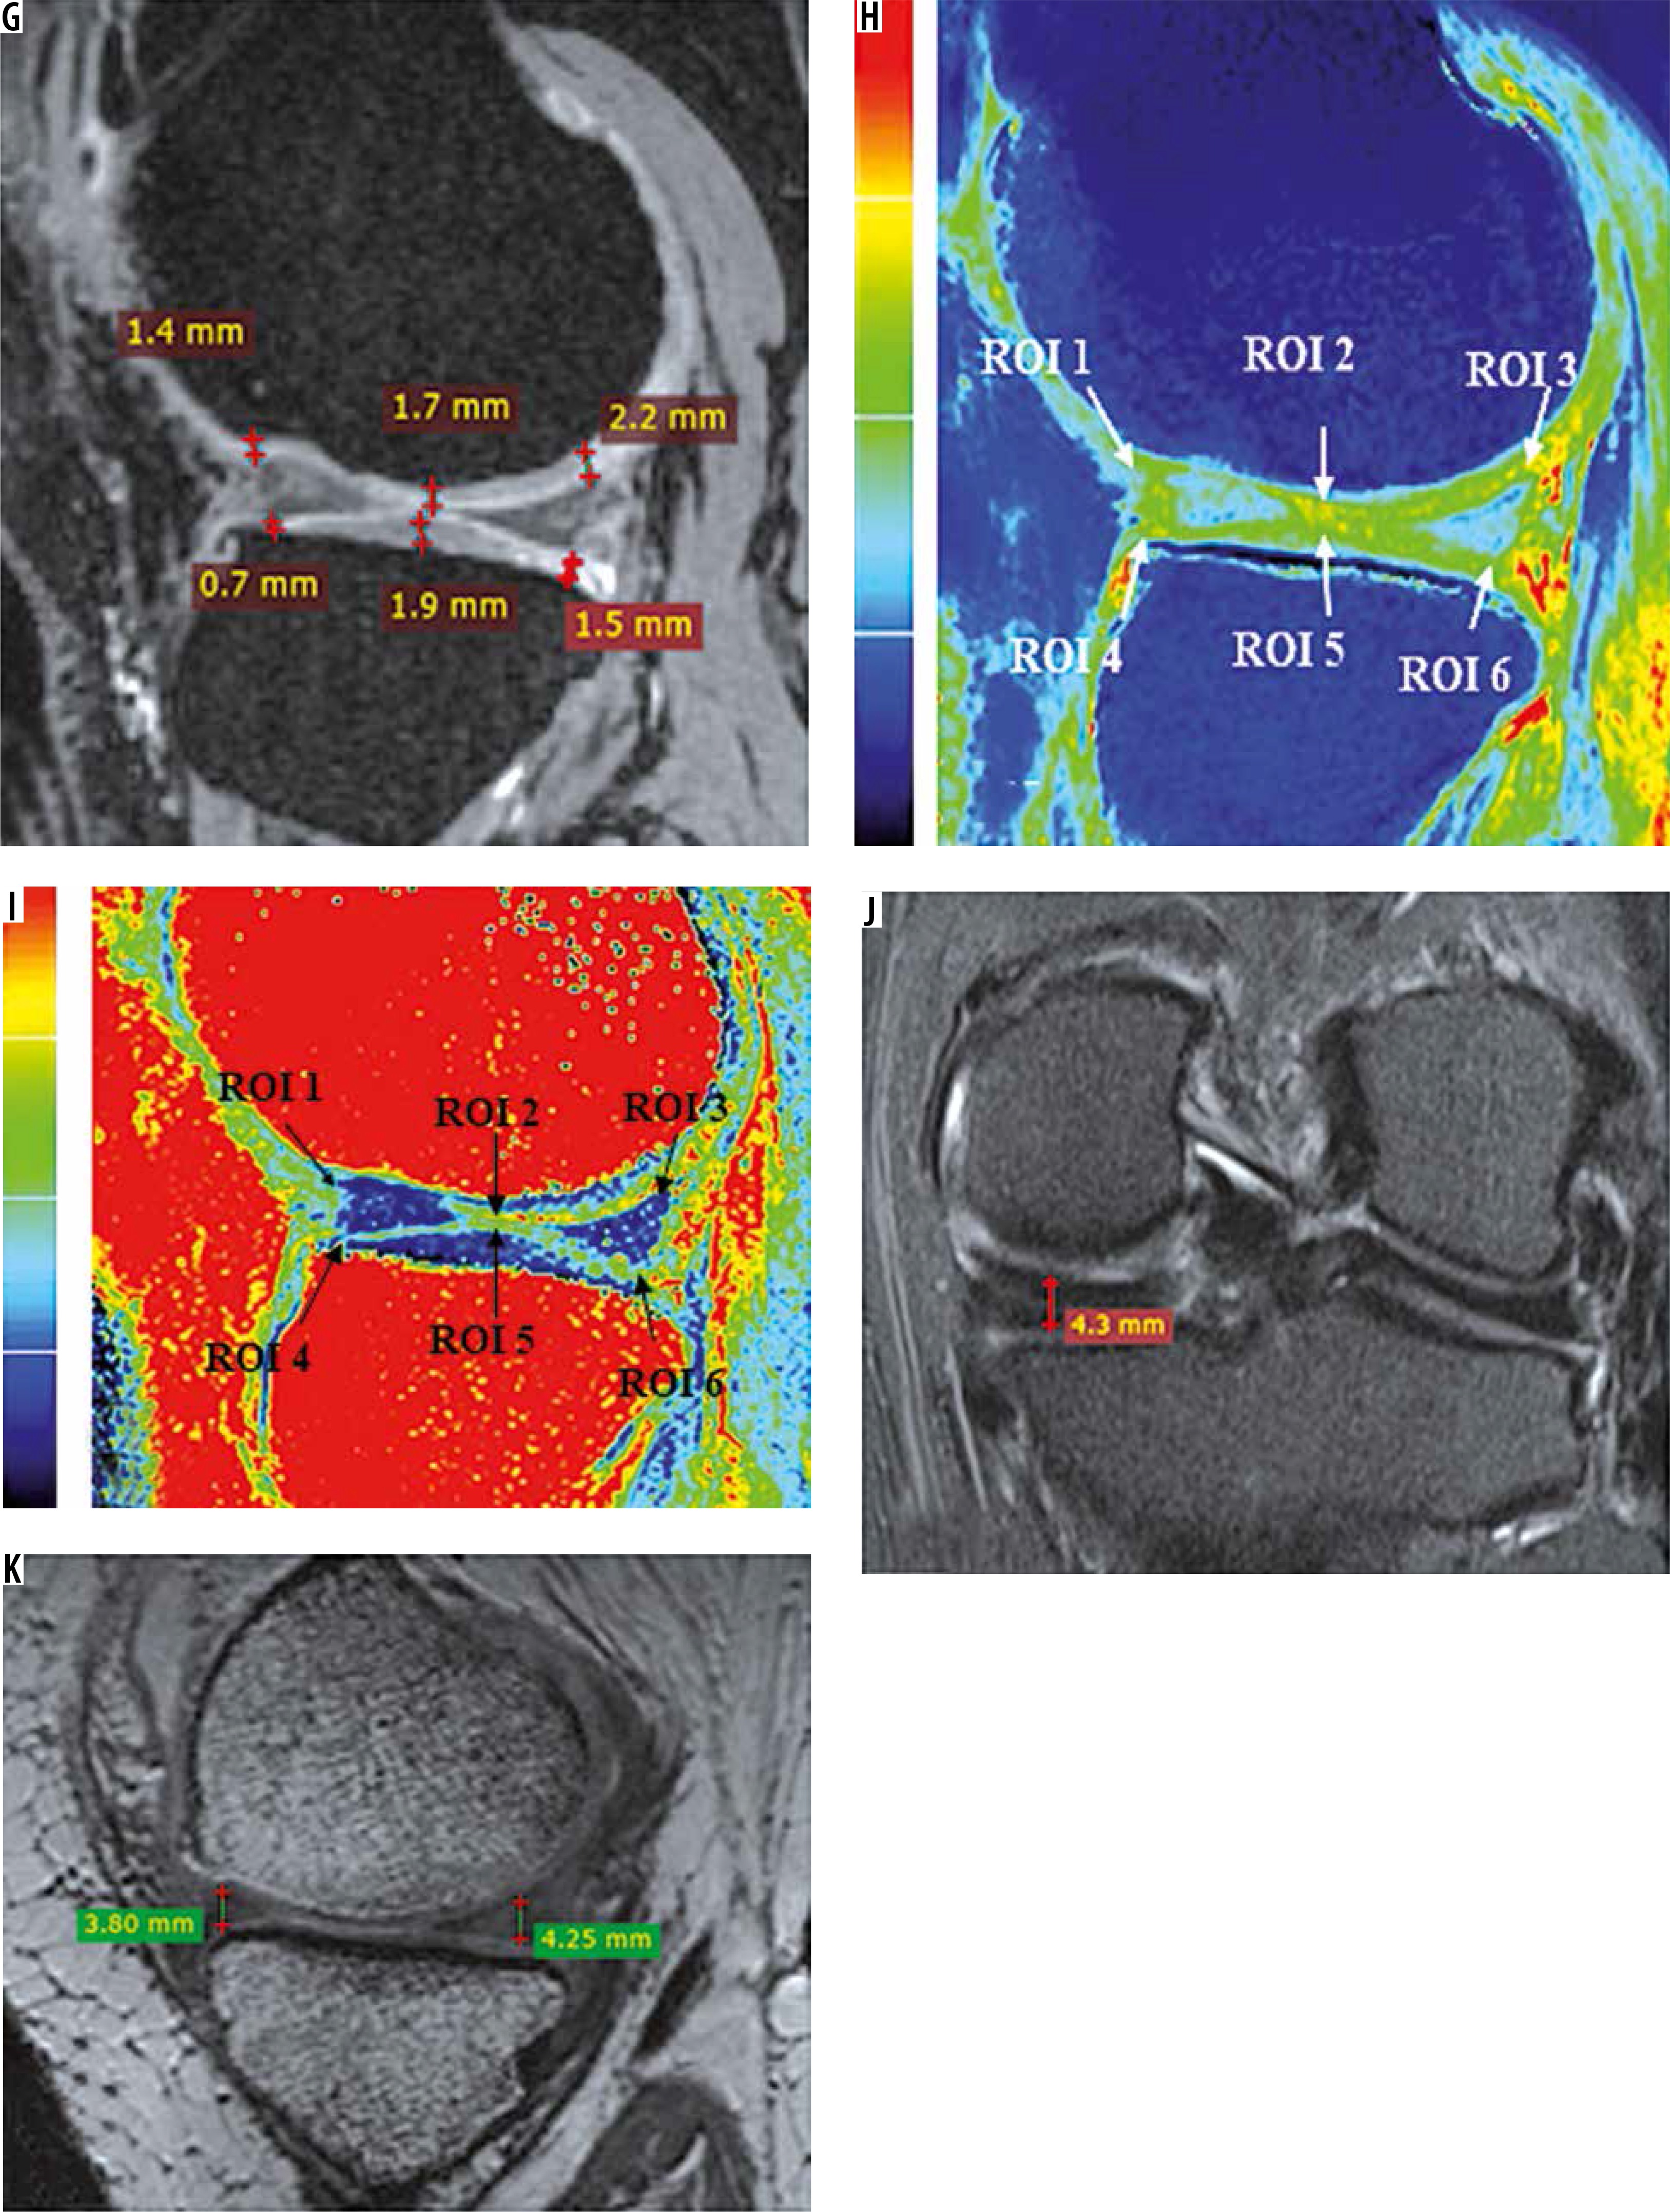

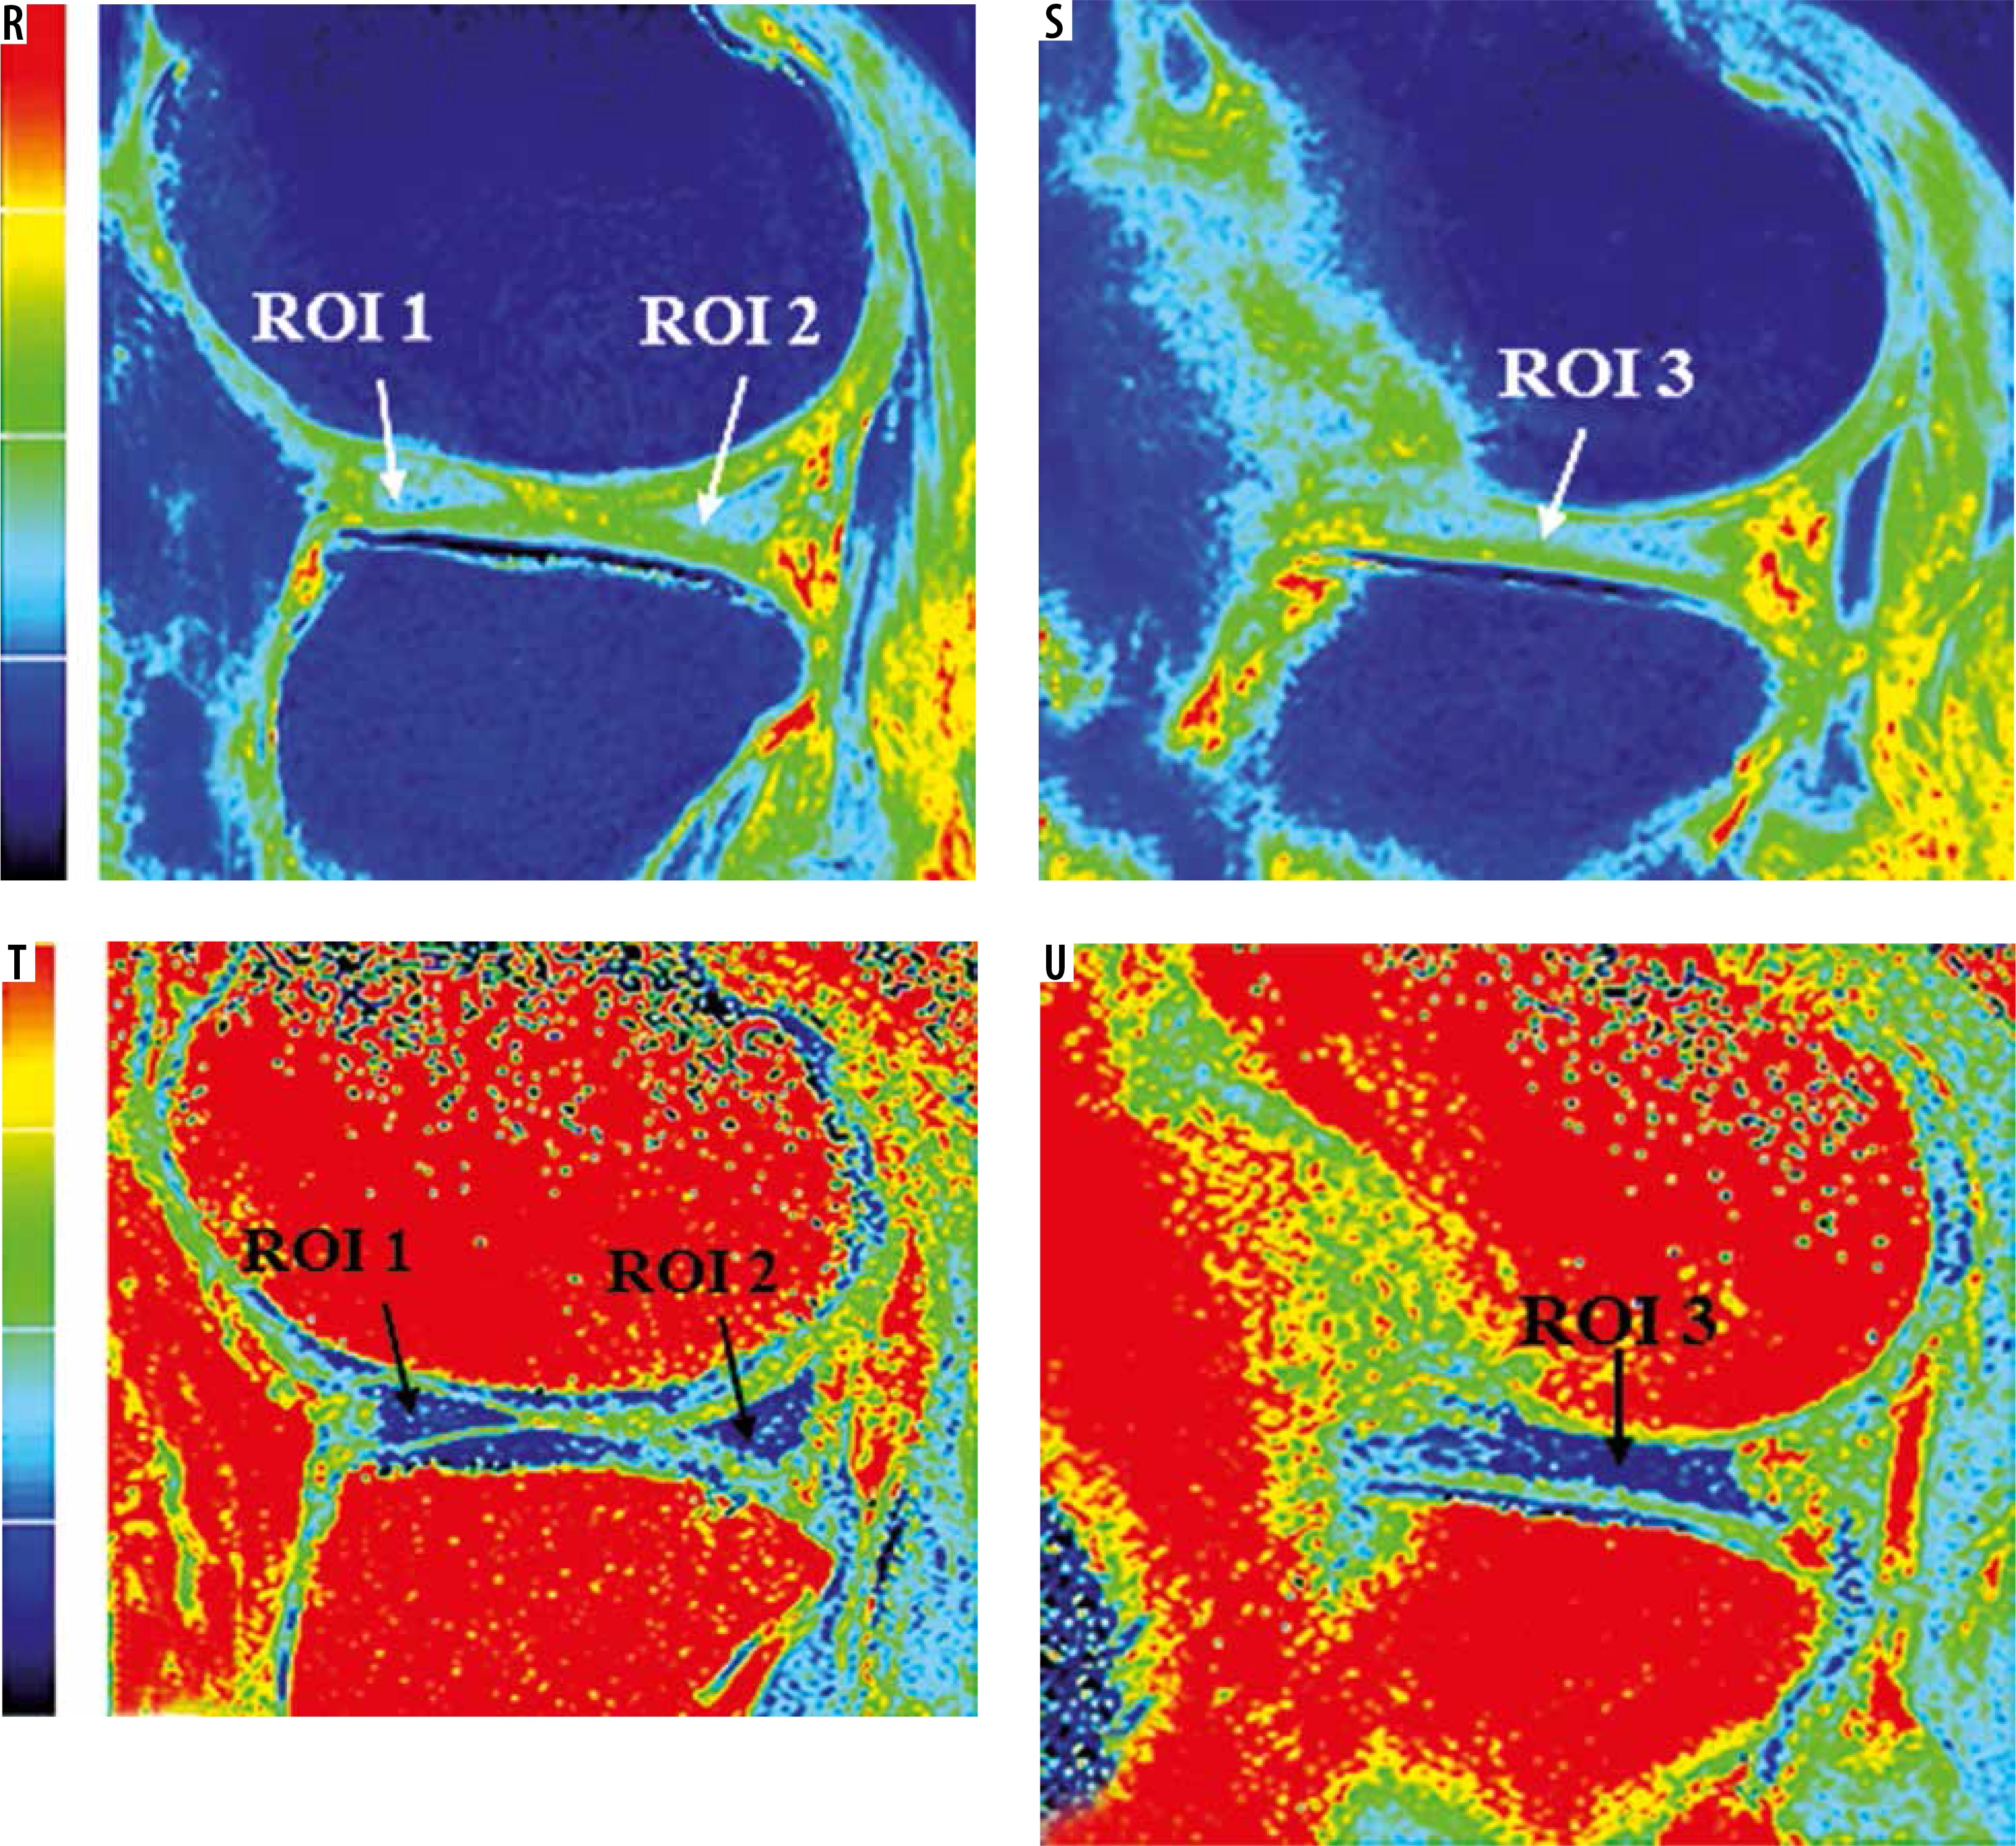
Figure 3
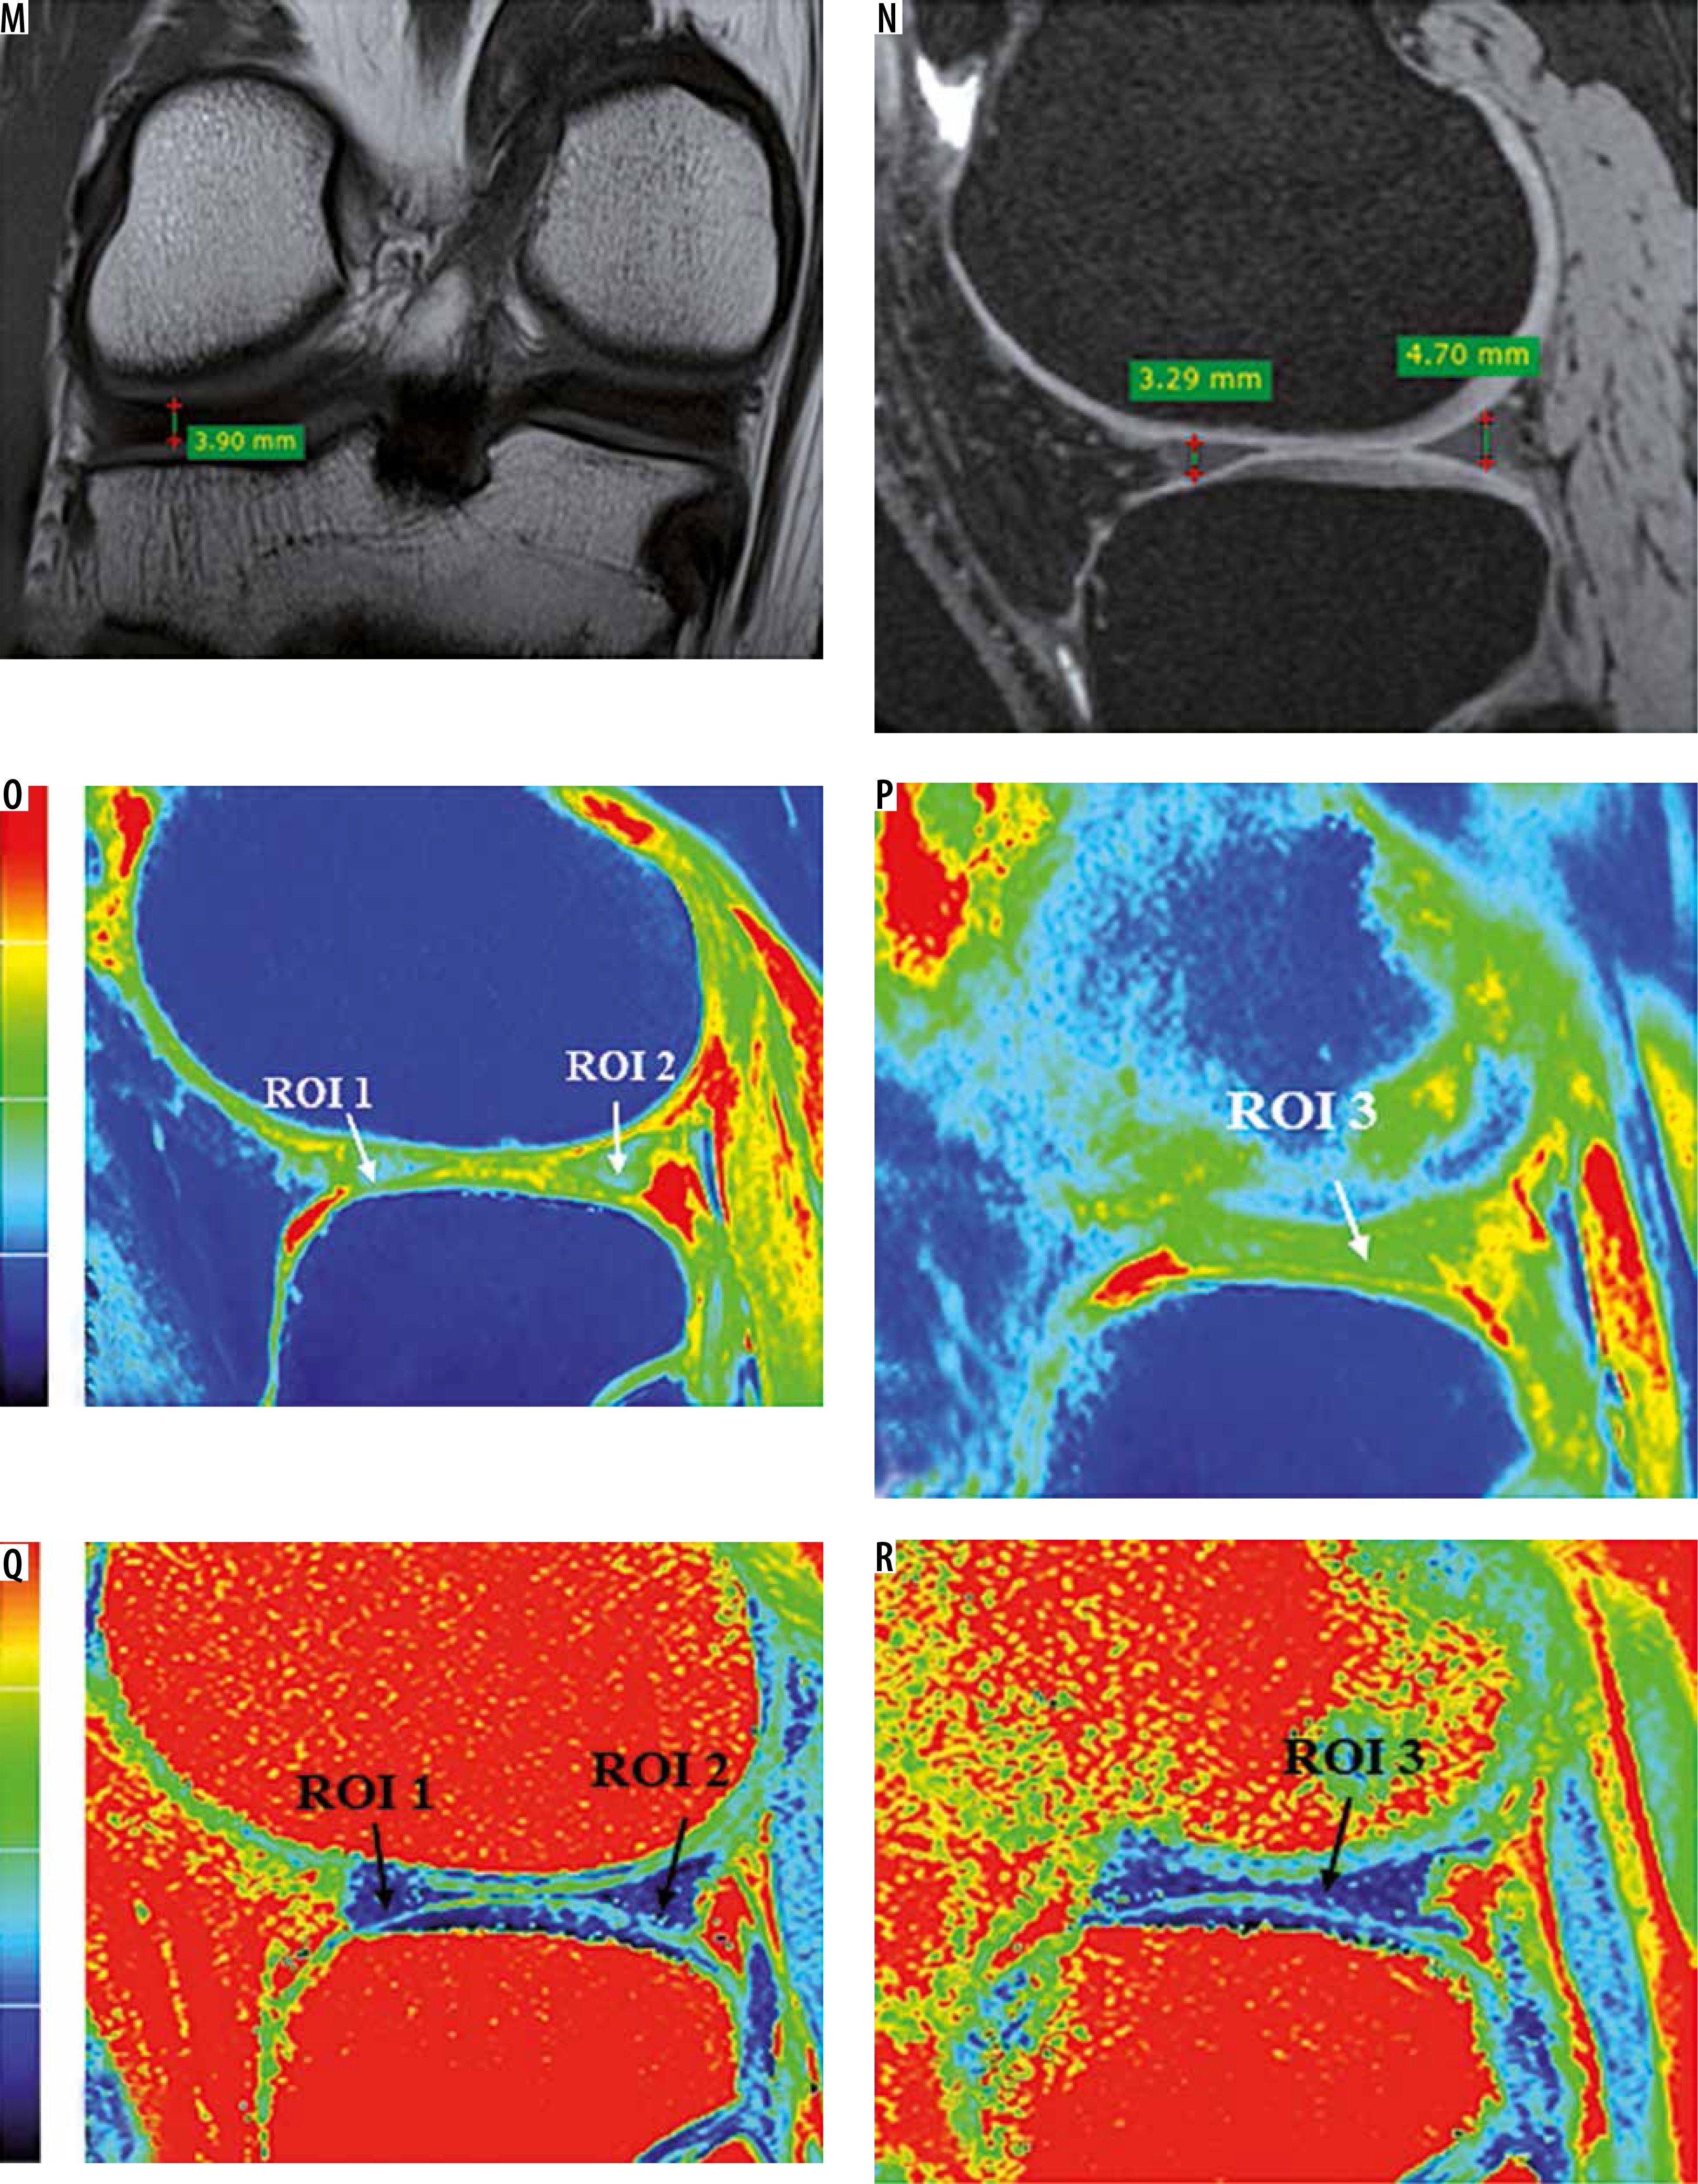
A) Sagittal T2 weighted DESS image shows medial femoro-tibial compartment (average thickness of articular cartilage in MFC ~1.5 mm and MTC ~1.15 mm). B) Corresponding color coded sagittal T1 map of medial femoro-tibial compartment (average T1 relaxation time of articular cartilage [in ROI 1, 2 and 3] for MFC ~895.3 ms and [in ROI 4, 5 and 6] for MTC ~854.81 ms). C) Color coded sagittal T2 map of medial femoro-tibial compartment (average T2 relaxation time of articular cartilage [in ROI 1, 2 and 3] MFC ~36.3 ms and [in ROI 4, 5 and 6] for MTC ~33.18 ms). D) Sagittal T2 weighted DESS image shows lateral femoro-tibial compartment (average thickness of articular cartilage in LFC ~2.25 mm and LTC ~2.03 mm). E) Corresponding color coded sagittal T1 map of lateral femoro-tibial compartment (average T1 relaxation time of articular cartilage [in ROI 1, 2 and 3] for LFC ~946.26 ms and [in ROI 4, 5 and 6] for LTC ~928.1 ms). F) Color coded sagittal T2 map of lateral femoro-tibial compartment (average T2 relaxation time of articular cartilage [in ROI 1, 2 and 3] for LFC ~38.21 ms and [in ROI 4, 5 and 6] for LTC ~40.1 ms) G) Coronal Tl weighted STIR image shows average thickness of body of medial meniscus. H) Sagittal T1 weighted SPGR image shows average thickness of anterior and posterior horn of medial meniscus. I) and J) Color coded sagittal Tl map shows average T1 relaxation time (in ROI 1, 2 and 3) of medial meniscus ~598.45 ms. K) and L) Color coded sagittal T2 map shows average T2 relaxation time (in ROI 1, 2 and 3) of medial meniscus ~14.63 ms. M) Coronal T1 weighted STIR image shows average thickness of body of lateral meniscus. N) Sagittal T1 weighted SPGR image shows average thickness of anterior and posterior horn of lateral meniscus. O) and P) Color coded sagittal T1 map shows average T1 relaxation time (in ROI 1, 2 and 3) of lateral meniscus ~603.31 ms. Q) and R) Color coded sagittal T2 map shows average T2 relaxation time (in ROI 1, 2 and 3) of lateral meniscus ~17.46 ms


Comparison of average thickness of medial and lateral menisci in healthy individuals and patients with early osteoarthritis of the knee
In our study, mean and standard deviation for thickness of medial and lateral menisci were calculated for healthy volunteers and for OA patients (Figures 2 and 3). It was observed that there was no significant difference in average thickness of medial and lateral meniscus in healthy volunteers and patients with early OA of the knee (p > 0.05).
This was in agreement with the study conducted by Wirth et al. [18] in the year 2010, in which three-dimensional parameters were computed to describe the shape, position, and signal intensity of the entire meniscus and its three sub-regions (body, anterior, and posterior horn). Their key results included the observation that a greater size (i.e. volume, surface areas, and thickness), increased medial extrusion (i.e. greater extrusion distance, greater meniscal area uncovered by the tibial surface), and elevated signal intensity of the medial meniscus is observed in osteoarthritic than in non-osteoarthritic knees, particularly in the meniscus body. However, the difference was not found to be significant. The meniscus tended to be thicker in OA knees than in healthy knees. This is because the menisci may undergo swelling with degeneration and tears, which are known to be more frequent in OA than in healthy knees [19]. Jung et al. [20] also conducted a study in the year 2010 with two-dimensional measurements of meniscal height, and they observed that meniscal hypertrophy had a frequent association with late stages of osteoarthritis.
Comparison of average T1 and T2 relaxation times of articular cartilage between healthy volunteers and patients with early osteoarthritis of the knee
In this study, we observed that the average T1 and T2 relaxation times of articular cartilage were significantly increased in patients with OA as compared to healthy controls (Figures 2 and 3). The T1 and T2 relaxation time values also increased with severity of radiographic OA and cartilage degeneration on MRI.
Various studies have attempted to find a correlation between the T2 relaxation times and biochemical changes in cartilage. Baum et al. [21] conducted a study in the year 2013 and demonstrated that cartilage T2 relaxation time values were significantly increased in subjects with radiographic OA and focal knee lesions as compared to those without radiographic OA. They also demonstrated that subjects with knee pain and risk factors like overweight/obesity had significantly higher T2 values as compared to control subjects. T2 values are mainly affected by the collagen content and orientation and water content of the cartilage. It has been observed that loss of PG is an initiating event in early OA, while neither the content nor the type of collagen is altered in early OA. Previous in vitro studies have reported that T2 correlated poorly with proteoglycan (PG) content [22,23], and PG cleavage did not affect T2 values significantly [8]. Therefore, the lack of specificity to quantify PG loss makes T2 mapping less appealing for early detection of cartilage degeneration. The angular dependency of T2 values with respect to the external magnetic field also made it difficult to define the normal appearance of T2 maps. As a result, it is difficult to apply T2 values to quantify cartilage degeneration longitudinally, and the clinical results obtained with T2 quantification remain inconclusive.
T1 relaxation time is an alternative way to evaluate biochemical changes in cartilage matrix noninvasively. It was observed that the average T1 relaxation time of articular cartilage was significantly higher in all the compartments of the knee in patients with early OA as compared to that of healthy volunteers (p < 0.05). Duvvuri et al. [24] first described the measurement of T1 relaxation time in a rotating frame (T1r) in articular cartilage, demonstrating that T1r was greater in proteoglycan-depleted bovine cartilage than in normal cartilage samples. A Few years later, Mlynarik et al. [25] measured T2 and T1, and T1 with Gd-DTPA (a modified dGEMRIC method) in articular cartilage specimens following joint replacement, to determine the effects of proteoglycan depletion on proton MR imaging relaxation times. T1r relaxation time was similar to T2 in both magnitude and spatial variation across the cartilage, with regions of fibrillation having higher times than non-fibrillated regions. They observed that there are several factors that contribute to variations in T1r, including collagen fibre orientation, and concentration of collagen, proteoglycan, and possibly other macromolecules. Further studies conducted by Makela et al. [26] and Duvvuri et al. [27] suggested that proton exchange between chemically shifted NH and OH groups of PG and the tissue water could be an important relaxation mechanism contributing to T1 relaxation. Therefore, T1 relaxation time is more specific to changes of PG in cartilage matrix during the early stages of OA.
Regatte et al. [22] also found that T1-weighted MR imaging is more sensitive to proteoglycan depletion than T2-weighted MR imaging. These data suggested that T1 might be a useful metric in assessing OA, particularly for early degeneration, when significant changes in proteoglycan are thought to occur.
The T2 values were found to be higher in patients with KL grade II as compared to KL grade I; however, the difference was not found to be significant (p > 0.05). This was consistent with the previous study conducted by Dunn et al. [28] correlating in vivo T2 values and OA disease severity as defined by KL scores. The study showed that the T2 values were significantly elevated in mild OA as compared to healthy controls, although there was an increasing trend of T2 values from mild OA to severe OA, but this difference was not significant.
The average T1 values were found to be higher in patients with KL grade II as compared to KL grade I. In our study, the difference reached a significant level (p < 0.05) in the medial compartment of the knee joint whereas no significant difference in T1 values was observed in the lateral compartment of the knee joint (p > 0.05). Preliminary in vivo studies have shown increased cartilage T1 relaxation time values for patients with OA vs. healthy controls. Li et al. [9] conducted a study in the year 2005 and demonstrated that the T1 values also increased with increasing severity of OA; however, the difference was not significant.
In our study, we observed that T1 values of articular cartilage for KL grade II OA patients were significantly higher than in KL grade I OA patients in the medial compartment of the knee joint. This difference was attributed to the small sample size of patients in our study and variations in the calculation of T1 relaxation times in different regions of interest. The results of our comparison study demonstrate that both T1 and T2 techniques are sensitive to cartilage degeneration. Because T1 and T2 MRI mapping techniques represent two relaxation mechanisms in tissues, they provide complementary information on cartilage degeneration. Combining these two techniques and the information enhances our ability to detect early cartilage degeneration, as well as to distinguish between different stages of degeneration.
Comparison of average T1 and T2 relaxation times of medial and lateral menisci between healthy volunteers and patients with early osteoarthritis of the knee
In our study, we observed that average T1 and T2 relaxation times of medial and lateral menisci were significantly higher in patients with OA when compared with those of healthy volunteers (p > 0.05).
T1 correlates highly with PG content in the cartilage [29], and the concentration of PG in the meniscus is comparatively low, at approximately 1-2% [30]. Because the loss of PG is the initiating event in early OA, and the fact that neither the content nor the type of collagen in the cartilage is modified during early OA [31], the T1 parameter appears to be well suited for differentiating patients with early OA from healthy control subjects. Krishnan et al. [32] analysed the T1 of gadolinium-based contrast material in the meniscus and the relationship between this parameter and the T1 of delayed gadolinium-based contrast material in the articular cartilage in gadolinium-enhanced MR imaging of cartilage datasets. Their study results showed that the T1 values of the meniscus correlated significantly with those of the articular cartilage, potentially demonstrating associated degenerative processes in the knee joint.
In a study conducted by Baum et al. [21] in the year 2013, it was demonstrated that meniscal T2 relaxation time values were significantly increased in subjects with radiographic OA and focal knee lesions as compared to those without radiographic OA. T2 values are sensitive to interactions between water molecules and the macromolecular concentration and structure of the extracellular matrix, which are based on the content, orientation, and anisotropy of collagen [33]. Compared with articular cartilage, which has a type 2 collagen concentration of 10-20%, the meniscus has a higher concentration of type 1 collagen approximately, at 15-25%. The higher collagen concentration in the meniscus also explains the lower meniscal T2 values compared with the cartilage T2 values. Most studies on the subject have reported that the depletion of PG had little influence on T2 values; therefore, the correlation of T2 with PG remains controversial [23].
The differences in the average T1 and T2 relaxation times between the healthy volunteers and OA patients reflect degeneration within the matrix of the menisci of patients with osteoarthritis of the knee. Therefore, the calculated T1 and T2 values in the menisci have the potential to be used as biomarkers for diagnosing early OA, i.e. the disease stage at which potential therapeutic interventions may be most useful.
Conclusions
The following conclusions were drawn from our study:
Our study comprised of 25 patients with early osteoarthritis of the knee (KL grade I and II) and 10 healthy volunteers. Most of the patients were females, and the majority of the patients were 40-60 years old.
There was no significant difference (p > 0.05) in average thickness of articular cartilage and menisci among different age groups of early OA patients and healthy volunteers in our study.
The average T1 and T2 relaxation times of articular cartilage were significantly higher (p < 0.05) in all the compartments of knee joint in OA patients as compared to healthy volunteers.
The average T1 relaxation times of articular cartilage increased with the severity of osteoarthritis. The T1 values were significantly higher (p < 0.05) in the medial compartment of the knee joint in KL grade II OA patients as compared to that of KL grade I OA patients, whereas no significant difference was observed for T1 relaxation time values in the lateral compartment of the knee joint.
The average T2 relaxation time values of articular cartilage also showed an increasing trend with the severity of osteoarthritis. However, in our study no significant difference (p > 0.05) was observed in T2 values of articular cartilage in OA grade II patients as compared to OA grade I patients among all the compartments of the knee joint.
The average T1 and T2 relaxation time values of medial and lateral meniscus were significantly higher (p < 0.05) in OA patients as compared to healthy volunteers.
It was observed that some OA patients had cartilage thickening whereas others showed cartilage loss. The actual onset of disease is not well defined, and due to the slow progression of the disease there is no correct window during which changes in cartilage morphology occur. These factors posed a major challenge in measurement of changes in cartilage morphology.
T1 relaxation time values are specific to changes in proteoglycan content of articular cartilage and menisci. The loss of proteoglycan is an initiating event in early OA. Therefore, T1 mapping is a noninvasive method to evaluate biochemical changes in cartilage and menisci in early OA patients.
T2 values are sensitive to interaction between water molecules and the macromolecular concentration and structure of extracellular matrix, which are based on the content, orientation, and anisotropy of collagen. The menisci have a higher concentration of type 1 collagen (~15-25%) as compared to articular cartilage, which has a type 2 collagen concentration of ~10-20%. Loss of PG is an initiating event in early OA, while neither the content nor the type of collagen is altered in early OA. The lack of specificity to quantify PG loss makes T2 mapping less appealing for early detection of cartilage degeneration. It is difficult to apply T2 values to quantify cartilage degeneration longitudinally, and the clinical results obtained with T2 quantification remain inconclusive.
T1 and T2 imaging are potential MR imaging techniques that reflect changes in the biochemical composition of articular cartilage and menisci. These non-invasive methods help in assessing early cartilage and meniscal matrix degenerative changes in patients with early OA of the knee. These techniques also help in initiating early treatment, and in monitoring disease progression and follow-up of operative cartilage repair and resurfacing procedures.