


Introduction
Vascular malformations are widespread heterogeneous vascular lesions that occur in all parts of the body and can cause significant morbidity and even mortality in a wide range of ages [1]. In the past, the term haemangioma was commonly applied to vascular lesions with different causes and clinical behaviours, and the use of this unclear nomenclature caused clinicians to have problems with diagnosis and treatment [1,2]. In 1982, Mulliken et al. proposed a classification system for the most useful and widely accepted vascular abnormalities today [3]. They classified vascular abnormalities as either haemangiomas or vascular malformations, and in 1996 these systems were adopted and expanded by the International Society for Vascular Abnormalities [4]. Currently, vascular malformations are broadly classified into (1) low-flow vascular malformations (venous malformations [VMs], lymphatic malformations [LMs], capillary malformations) and (2) high-flow vascular malformations (arteriovenous malformations [AVMs]). Low-flow vascular malformations account for over 90% of vascular lesions [5].
Because treatment strategies for vascular malformations depend on the type of malformation, accurate diagnosis and classification of vascular abnormalities are important. In addition, it is important to distinguish between VMs and LMs because of the high frequency of occurrence and different treatment methods of these 2 malformations. Both VMs and LMs commonly use sclerotherapy, but LMs more rarely perform surgery compared to VMs, which relatively require surgery [2].
Magnetic resonance imaging (MRI) is the most valuable modality in the classification of vascular abnormalities [6]. It provides important information for treatment planning because it defines the anatomical relationship between the enlargement of vascular lesions and adjacent structures [7]. In particular, high-precision T2-weighted images showing the extent of vascular malformations have previously been described, and this technique is widely used in clinical practice [8-10]. However, the MRI findings of VMs and LMs are similar, and it is difficult to distinguish VMs and LMs from signal strength alone [2,10]. Due to the low blood flow of VMs and LMs, it can be difficult to distinguish them by ultrasonography. In addition, computed tomography and scintigraphy are examinations that involve radiation exposure. Therefore, it is challenging for radiologists to distinguish between VMs and LMs, which are low-flow vascular malformations, using MRI.
In recent years, texture analysis has been widely used in the field of diagnostic imaging as a method of image analysis [11-20]. Texture analysis is a method that can quantitatively evaluate the texture of an image from the spatial positional relationship of pixel values, and it can identify slight differences in lesions that cannot be discerned by the human eye. In addition, the parameters obtained by texture analysis are applied in computer-aided diagnostic systems. MRI texture analysis is often used for head and neck diseases; however, to our knowledge, no studies have performed MRI texture analysis for low-flow vascular malformations. Thus, this study aimed to differentiate VMs from LMs using non-contrast-enhanced MRI texture analysis.
Material and methods
Patients
This retrospective case-control study included 12 LM patients (6 men and 6 women; mean age 43.58 [range 7-85] years) and 29 VM patients (7 men and 22 women; mean age 53.10 [range, 19–76] years) who underwent MRI for suspected vascular malformations in the oral and maxil-lofacial region from April 2006 to October 2021. LM patients and VM were identified by histopathological examination of tissues excised during surgery.
Patients with severe metal or motion artifacts on T2-weighted images (n = 2) were excluded from the study.
This study was approved by the institutional review board of our institution (No. EC15-12-009-1). The requirement for written informed consent was waived owing to the retrospective nature of this study. All procedures followed the guidelines of the Declaration of Helsinki and ethical principles for medical research involving human subjects.
Imaging protocol
MRI was performed using a 1.5-T superconductive MR unit (Intera Achieva 1.5T Nova; Philips Medical Systems, Best, Netherlands) with a 5-channel phased-array coil. MR images were obtained using a spin-echo sequence with the following parameters: axial T2-weighted imaging (repetition time 4092.8 ms; echo time 120 ms; slice thickness 6 mm; matrix 368 × 294; field of view 230 × 195.5 mm).
Image analysis and assessment on magnetic resonance imaging
The radiomics features of the LMs and VMs were analysed using the open-access software MaZda version 3.3 (Technical University of Lodz, Institute of Electronics, Poland) [21-23].
In total 279 radiomics features were extracted from each region of interest (ROI) on T2-weighted images in Digital Imaging and Communications in Medicine format (Figure 1). Two-dimensional ROIs were manually placed by tracing the contours of the LM or VM on one axial slice that demonstrated the maximal area of the LM or VM. ROIs were segmented by a maxillofacial radiologist (K.I.) with 11 years of experience. Details of these textural features are described in the software package website (http://www.eletel.p.lodz.pl/programy/mazda). After extracting 279 parameters, MaZda feature reduction methods (Fisher and probability of error and average correlation coefficients [POE + ACC] methods) were used to reduce the 279 radiomics features. The 10 features with the largest Fisher coefficients and the 10 features with the smallest POE + ACC were extracted, and 17 features were selected.
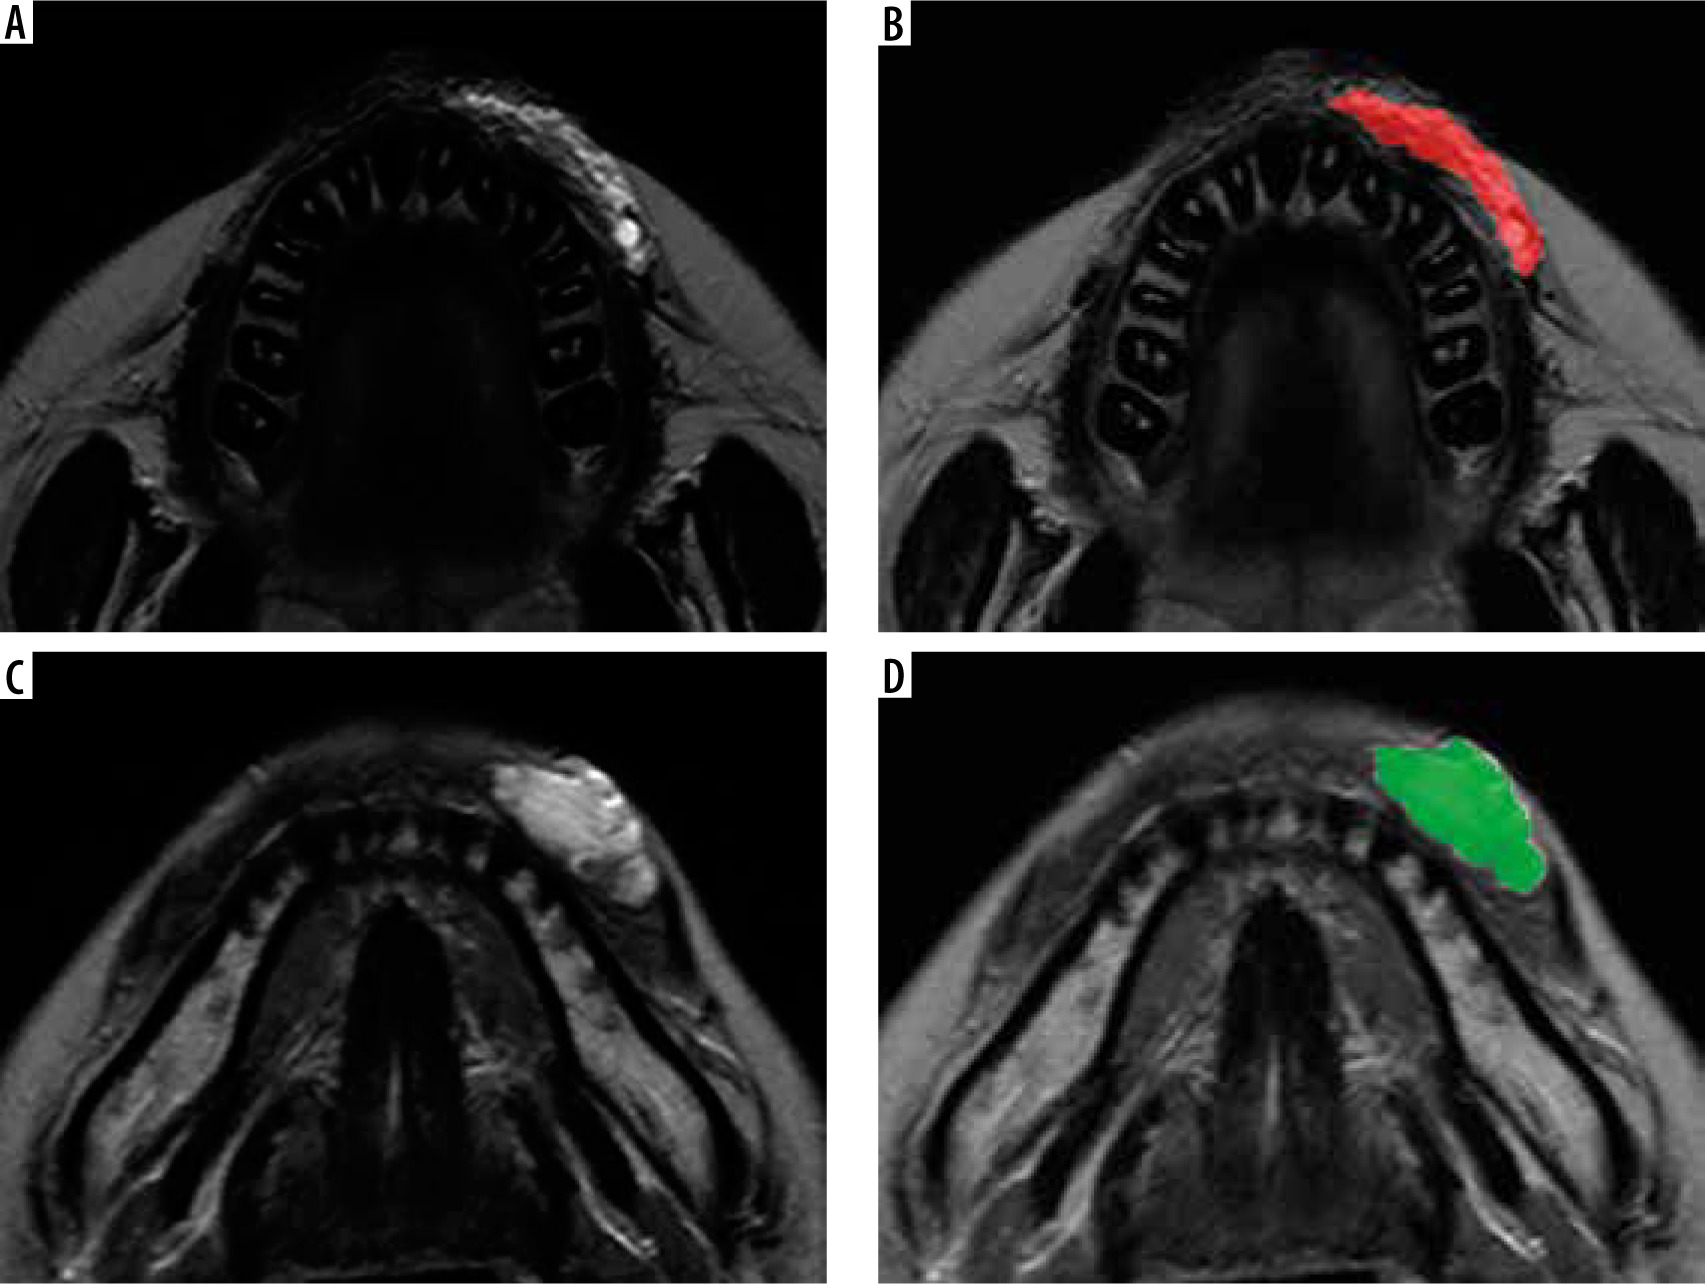
Figure 1
Region of interest (ROI) placement of lymphatic malformation (LM) and venous malformation (VM). A, B) T2-weighted magnetic resonance images showing the LM and ROI drawn on the LM (red region). C, D) T2-weighted magnetic resonance images showing the VM and ROI drawn on the VM (green region). ROIs were manually placed by tracing the contours of the LM or VM on axial slices that demonstrated the maximal area of the LM or VM
Furthermore, T2-weighted images were used to identify the location of LM and VM.
Statistical analyses
All selected texture parameters and patient characteristics were compared between LM and VM. Results for continuous variables are presented as mean ± standard deviation. After performing the Shapiro-Wilk test and F-test for continuous variables, where appropriate, the Student t-test, Welch t-test, or Mann-Whitney U test was used to assess for differences in continuous variables based on patient characteristics and texture parameters. For categorical variables, frequencies are presented as the number of patients (column percentage). Fisher’s exact test was used to examine differences in categorical variables according to patient characteristics. Receiver operating characteristic (ROC) curve analysis was performed to assess the ability of texture features to differentiate between LM and VM, and the area under the curve (AUC) was calculated. A p-value < 0.05 was considered significant. In addition, post-hoc power analysis was performed on the parameters that were significantly different between LM and VM. R version 3.6.3 (R Development Core Team, Auckland, New Zealand) was used for the analyses.
Results
Table 1 shows the characteristics of the patients with LM or VM. There were no significant differences in age and sex between LM and VM patients. The buccal area was the most common site of LM (50.0%) and VM (41.4%).
Table 1
Patients’ characteristics
One histogram feature (skewness), 8 grey-level cooccurrence matrix (GLCM) features (S[0, 2] correlation, S[0, 3] correlation, S[0, 4] correlation, S[0, 5] correlation, S[1, 1] correlation, S[2, 2] correlation, S[2, −2] correlation, S[3, −3] correlation), and 1 grey-level run-length matrix (GLRLM) feature (135° short-run emphasis [SRE]) showed significant differences between LM and VM patients (p < 0.05) (Table 2). The 2-dimensional ROI sizes of LM and VM were 575.2 ± 349.1 mm2 and 609.1 ± 417.5 mm2, respectively, and there was no significant difference (p = 1.00).
Table 2
Texture features differentiating between lymphatic malformation and venous malformation using Student’s t-test, Welch’s t-test, and Mann-Whitney U test
Table 3 shows the diagnostic performance of texture features for differentiating between LM and VM. The AUCs of all selected texture features, except 135° SRE (0.698), were greater than 0.700, which can be interpreted as showing acceptable accuracy [24].
Table 3
Diagnostic performances of texture parameters to differentiate venous malformation from lymphatic malformation
Post-hoc power analysis showed that the power between the 2 groups was 0.624 for skewness, 0.874 for S(0, 2) correlation, 0.933 for S(0, 3) correlation, 0.885 for S(0, 4) correlation, 0.670 for S(0, 5) correlation, 0.899 for S(1, 1) correlation, 0.830 for S(2, 2) correlation, 0.843 for S(2, –2) correlation, 0.863 for S(3, –3) correlation, and 0.213 for 135° SRE.
Discussion
Among the 17 selected texture features, the patients with LM and VM revealed significant differences in 1 histogram feature, 8 GLCM features, and 1 GLRLM feature. Moreover, these texture features, except for the GLRLM feature, exhibited an acceptable diagnostic performance. Thus, texture analysis may be useful for differentiating VMs from LMs using T2-weighted images of non-contrast-enhanced MRI.
We used a histogram – a statistical graph with frequency on the vertical axis and brightness value on the horizontal axis – to visually recognize the distribution of data. The skewness indicates the asymmetry of the brightness value distribution in the histogram. In this study, the skewness of VM was significantly smaller than that of LM and was less than 0. If the skewness is less than 0, the distribution of the brightness values is considered to be biased toward higher values. In addition, because kurtosis was less than 0 in both LM and VM, it is probable that the white and black parts were unevenly distributed on T2-weighted images. Most LMs consist of multiple chyle-filled cysts [5,25]. We believe that these multiple cysts provide LM with a wide range of pixel values, reducing the overall pixel value.
GLCM correlation is a feature that represents linear dependence. In this study, VM had a higher GLCM correlation than LM. This suggests that VM has a more linear structure compared to LM. The meandering blood vessels in VM may represent a strong linear structure in the image. Significant differences in several types of GLCM correlation suggest that a linear structure appears on T2-weighted images at different angles and distances.
GLRLM SRE is defined as the distribution of short homogeneous runs in an image. In this study, LM showed a higher SRE than VM. LM may have multiple fine grain-like structures. This is hypothesized to reflect the large number of chyle-filled cysts in LM. The AUC of the SRE was slightly smaller, but a cut-off value of ≤ 0.893 showed high diagnostic accuracy.
The histogram, GLCM, and GLRLM selected in this study for the differentiation between LM and VM are general texture features, and the results of this study are considered to be applicable to a wide variety of image analysis software. In addition, GLCM and GLRLM are quantitative parameters derived from the spatial positional relationship of pixel values, and they are hypothesized to be less affected by MRI models. Therefore, the cut-off values with high dia-gnostic accuracy obtained in this study may change the dia-gnostic imaging for vascular malformations.
Our study has some limitations. First, AVM, which is a high-flow vascular malformation, was not included in the cases. AVM is characterized by a clear flow void in the spin-echo sequence [1,4]. It is important to evaluate the presence or absence of flow voids before distinguishing between VL and VM. Second, our study did not include patients with LM with infection. LM with infection may show different imaging findings than LM without infection and should be considered in the future. Third, the sample size was relatively small. The small number of cases was because the subject of this study was limited to vascular malformations in the oral and maxillofacial region. However, because many of the indicators proposed in this study showed high power by post-hoc power analysis, it is considered that there is no extreme shortage of sample size. In addition, it was not possible to place a 3-dimensional ROI due to the thick MRI slices and relatively small lesions in this study. Future prospective studies using thin-slice MR images are required to obtain 3-dimensional texture parameters.