


Introduction
The most common malignancy affecting females all over the world is breast cancer (BC), and its early diagnosis allows successful treatment. Preoperative or neoadjuvant chemotherapy (NAC) is considered the standard treatment for inoperable, locally advanced breast cancer, while for those with operable cancer, NAC may be used to shrink the tumour, thereby improving the prognosis to allow breast preservation. Also, patients who achieve pathologic complete response (pCR) after NAC have better disease-free survival rates [1,2]. pCR is defined as the disappearance of all invasive cancer in the breast after completion of neoadjuvant chemotherapy, although some authors require clearance of residual disease in axillary nodes as well [3].
The accurate assessment of breast cancer response to chemotherapeutic agents is important to evaluate the efficacy of chemotherapy and to avoid the toxicity of ineffective treatments. The Response Evaluation Criteria in Solid Tumour (RECIST) is widely used in the assessment of tumour response to treatment, based on uni-dimensional measurements of the longest tumour diameter by contrast-enhanced dynamic magnetic resonance imaging (MRI) [4].
MRI may be the most commonly used method to evaluate the tumour response to NAC as regards the tumour size, but this does not reflect the real extent of disease because of the changes in cellularity or vascularity of tumours. Although cancer cells are destroyed, the fibrous stroma within remains. So, if MRI contrast enhancement only is used the residual disease may be overestimated or underestimated [5].
Tumour response to NAC can be classified into types I and II where there is a concentric shrinkage pattern with or without residual surrounding lesions. Types III and IV are nonconcentric shrinkage pattern (which involves shrinkage with residual multinodular lesions and diffuse contrast enhancement). Types III and IV are both multicentre and scattered lesions; the framing structure of lesions remains so the residual tumour size is difficult to judge [6].
Hydrogen 1 (1H) magnetic resonance spectroscopy (1H-MRS) is the only method that can be used to monitor chemicals in living tissue quantitatively, and it has proven to be helpful for the diagnosis of breast cancer, while its role for evaluating therapy response and monitoring of the efficacy of NAC is less established and the results are variable [7].
The objective of this study is to assess the role of 1H-MRS in the confirmation of the pathological complete response after neoadjuvant chemotherapy in breast cancer patients willing to undergo breast conservation.
Material and methods
This is a prospective study that was approved by the Research Ethics Committee of the Faculty of Medicine at Mansoura University in Egypt. All patients included in this study gave written, informed consent to participate in the research. The study was conducted at the Department of Radiology of Mansoura University Hospital between September 2017 and November 2018. The patients were referred from Mansoura University Oncology Centre and Outpatient Surgery Clinics.
All patients were clinically examined for breast and axillary diseases and then underwent core needle biopsy for histopathological diagnosis. All of them received four cycles of anthracycline-based combination chemotherapy with three-week intervals, AC protocol (adriamycin 60 mg/m2 and cyclophosphamide 600 mg/m2). Each patient had two separate breast MRI examinations using a 1.5 T system (Philips Ingenia, Best, Netherland). The first examination was done before starting NAC and the second examination after completing it before surgical intervention.
Magnetic resonance imaging
Preparation of patients:
before examination the patient was instructed to remove all metallic items,
the patient was asked to stay motionless during the examination.
Position:
Image acquisition
Localising sagittal protocol (scout view).
T1-weighted pulse sequence: axial non-fat saturated TIWI was done by FSE using the following parameters: TR 512 ms, TE 8 ms, slice thickness 3 mm, the field of view (FOV) was 400-500 mm, and the matrix was 256 × 256.
Short TI inversion recovery (STIR) was done using the following parameters: TR 4000 ms, TE 70 ms and inversion time (TI) was 175 ms, slice thickness was 3 mm with interslice gap 1 mm, the field of view (FOV) was 400-500 mm, and the matrix was 256 × 256.
MR spectroscopy: 2D multi-voxel spectroscopy was performed for all patients on a single 10-mm-thick sagittal section by using point resolved spectroscopy sequence PRESS sequence, followed by global and voxel-level automatic and manual shimming on the water signal. Also, simultaneous water and lipid suppression were done using MEGA pulses, where the transverse magnetisation was selectively de-phased before and also after the second 180 8 spin-echo pulses. 2D-MRSI was carried out by using the following parameters: TR 2000 ms and TE 272 ms. To improve the SNR, four scans (acquisitions) were carried out with a total data acquisition time of approximately 12 minutes. The CSI grid was carefully placed to allow maximum coverage of the lesion. The FOV used was 80 × 80 mm with a scan resolution of 16 × 16 mm. The resultant voxel size was 5 × 5 × 10 mm.
As regards the 2D CSI slab placement, we tried to place it on the same part of the breast in pre- and post-chemotherapy measurements on the same patient, or it was placed in the most suspicious place for tumour residue.
The time-domain signal intensity was processed to remove any residual water signal. Post-processing of the spectroscopic data consists of frequency shift and phase and linear baseline corrections after Fourier transformation. The frequency-domain curve was fitted to the Gaussian line shape by using the software provided by the manufacturer to define the choline-containing components (Cho) peak.
No IV contrast was given to the patients before MR spectroscopy, to prevent the potential interference of metal chelate with the detectability of Cho related compounds [8]. The contrast material was administered later in this study, to allow us to combine the results of dynamic contrast-enhanced MR imaging with MR spectroscopy.
Analysis of 1H-MRS data
We measured the Cho peak from the water and fat-suppressed spectrum using a narrow frequency range (e.g. 2.92-3.52 ppm was selected to analyse Cho peak to quantify its amplitude). Choline peak was considered positive if present at 3.2 ppm and negative if absent.
For dynamic MRI
The dynamic study was made in the axial plane with fat suppression by applying a fat-saturated pulse. The sequence used was FLASH 3 D GRE-T1W1 with the following parameters: TR 3-4 ms, TE 1.5 ms, the flip angle was 10 degrees, slice thickness 2 mm with no inter-slice gap, the field of view (FOV) 450 mm and the matrix was 256 × 256. The dynamic study included single pre-contrast and five post-contrast series, each of them lasted for about 1.16 min with a pause between the pre-contrast and post-contrast study of about 20 sec. Gadopentate dimeglumine was given to the patients in a dose of 0.2 mmol/kg using an automated injector system. The rate of injection was 3-5 ml/sec through an 18- or 20-gauge intravenous cannula, which was inserted in an ante-cubital vein. This was followed by a bolus injection of saline (total of 20 ml at 3-5 ml/sec). The phase-encoding direction was oriented to minimise motion artefacts across the breast tissue.
Kinetic curves
The ROI was placed within the most enhancing part of the suspicious lesions. The size of the used ROI varied according to the size and the shape of the lesions. The time to signal intensity curve for each ROI was obtained. The horizontal axis of the obtained curve represented the series number or time, and the vertical axis represented the signal intensity that was automatically calibrated by the machine.
Pharmacokinetic study
The localisation of breast lesions was done using post-contrast, high-spatial-resolution images. Then the mean and median values of the transfer constant (Ktrans) and the rate constant (Kep) were calculated.
Image post-processing
Image subtraction: Image subtraction was obtained by subtracting each of the pre-contrast images from each post-contrast series image.
Creation of time to signal intensity curves: Time enhancement curves were obtained for all patients.
Maximum intensity projection (MIP): The MIP views were obtained for all patients.
Analysis of enhancement kinetics
Considering the contrast enhancement pattern during the dynamic series, three different phases were distinguished:
the early phase (between contrast injection and the second postcontrast minute),
the post initial phase (3rd to 4th post-contrast minute),
the late phase (later than the 4th post-contrast minute).
The curves were classified into type 1 (persistent), type 2 (plateau), and type 3 (washout) curves.
Histopathological evaluation
The evaluation of the pathologic response to NAC and the residual tumour size were examined grossly and microscopically after tumour excision. Surgical specimens were cut into slices and fixed in 10% neutral-buffered formalin to prepare paraffin blocks. Each block of the gross tumour was cut into slides and stained with haematoxylin-eosin for examination to detect residual tumour tissue and confirm the complete response.
Evaluation of response to neoadjuvant chemotherapy
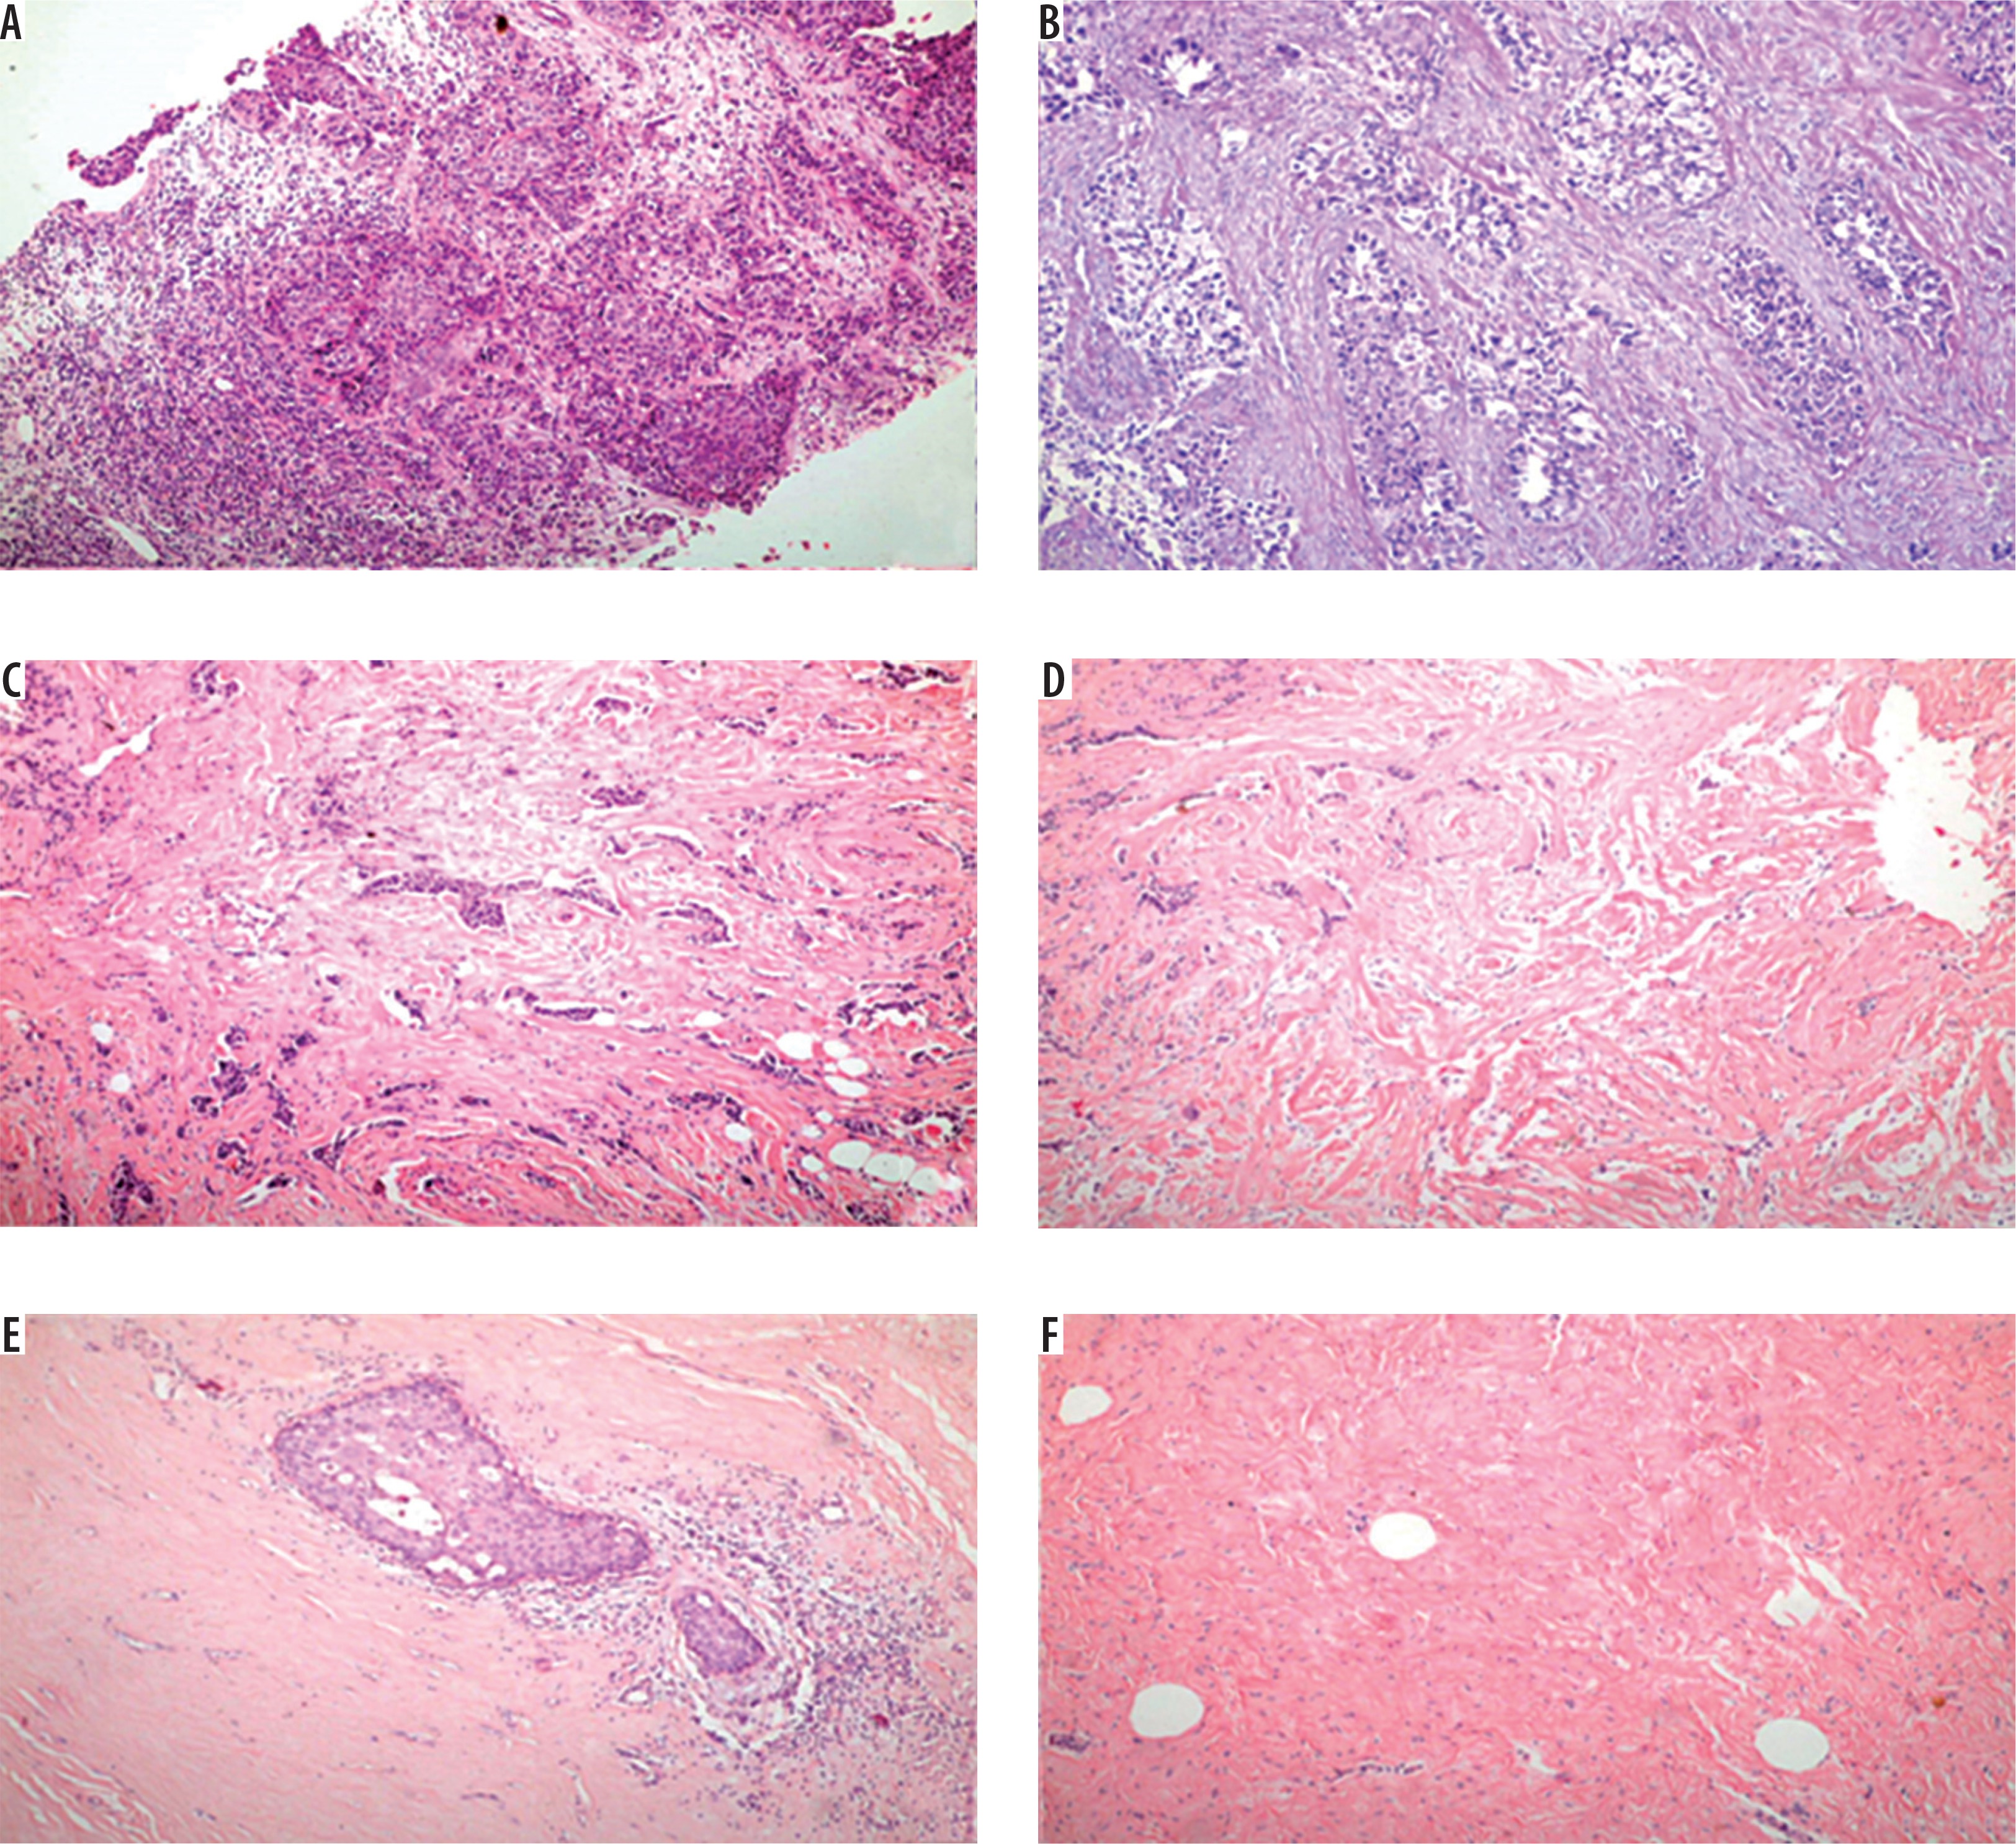
Patients who had no remaining invasive cancer in the breast (pT0) and who were lymph node-negative (pN0) were considered to have a pCR. The pathological tumour response to neoadjuvant chemotherapy (Figure 1) was evaluated pathologically by classifying the regressive changes using a semi-quantitative scoring system from 0 to 4 (0 = no effect, 1 = resorption and tumour sclerosis, 2 = minimal residual invasive tumour [< 0.5 cm], 3 = residual non-invasive tumour only, 4 = no tumour detectable) according to the tumour regression grading described by Sinn et al. [9].
Figure 1
A) Invasive ductal carcinoma by haematoxylin-eosin revealed sheets and strands of malignant cells with pleomorphic nuclei surrounded by desmoplastic stroma. B) Tumour cells show no effect after neoadjuvant therapy (score 0). C) Tumour cells show resorption and tumour sclerosis after neoadjuvant therapy (score 1). D) Minimal residual invasive tumour (< 0.5 cm) after neoadjuvant therapy (score 2). E) Residual non-invasive tumour only after neoadjuvant therapy (score 3). F) No tumour detectable after neoadjuvant therapy (original magnification ×100)
Statistical analysis
Data were fed into the computer and analysed using IBM SPSS software package version 20.0. Qualitative data were described using the number and percentage. Quantitative data were described using the range (minimum and maximum), mean, and standard deviation.
The used tests were as follows:
χ2 test: for categorical variables, to compare between different groups,
Fisher’s exact correction: correction for χ2 when more than 20% of the cells had an expected count less than 5,
Mann-Whitney U test: to compare 2 groups of abnormally quantitative variables,
ROC curve: to detect Cho SNR cut-off point to differentiate between residual disease and complete pathological response.
For all above mentioned statistical tests done, the threshold of significance was fixed at 5% (p-value).
The results were considered:
non-significant when the probability of error is more than 5% (p > 0.05),
significant when the probability of error is less than 5% (p < 0.05),
highly significant when the probability of error is less than 0.1% (p < 0.001).
The smaller the p-value obtained, the more significant the result.
Results
In our study, the pathologic diagnosis before starting chemotherapy was invasive ductal carcinoma in 47 patients, while after surgery the final pathological results showed that 12 patients were diagnosed as complete responders and 35 patients showed residual disease (Figure 1).
The mean age ± SD was 53.72 ± 8.53 years. The tumoural size mean ± SD (min-max) before NAC was 4.21 ± 0.99 cm. While the mean ± SD (min-max) size after chemotherapy was 0.9 ± 0.44 cm (all the tumour sizes were measured by the longest diameter).
Regarding the 1H-MRS there was positive total choline signal (tCho) in all 47 cases at baseline (Figures 3 and 5), the mean Cho SNR before NAC was 9.53 ± 1.7, and the mean Cho SNR after NAC was reduced to 2.53 ± 1.3.
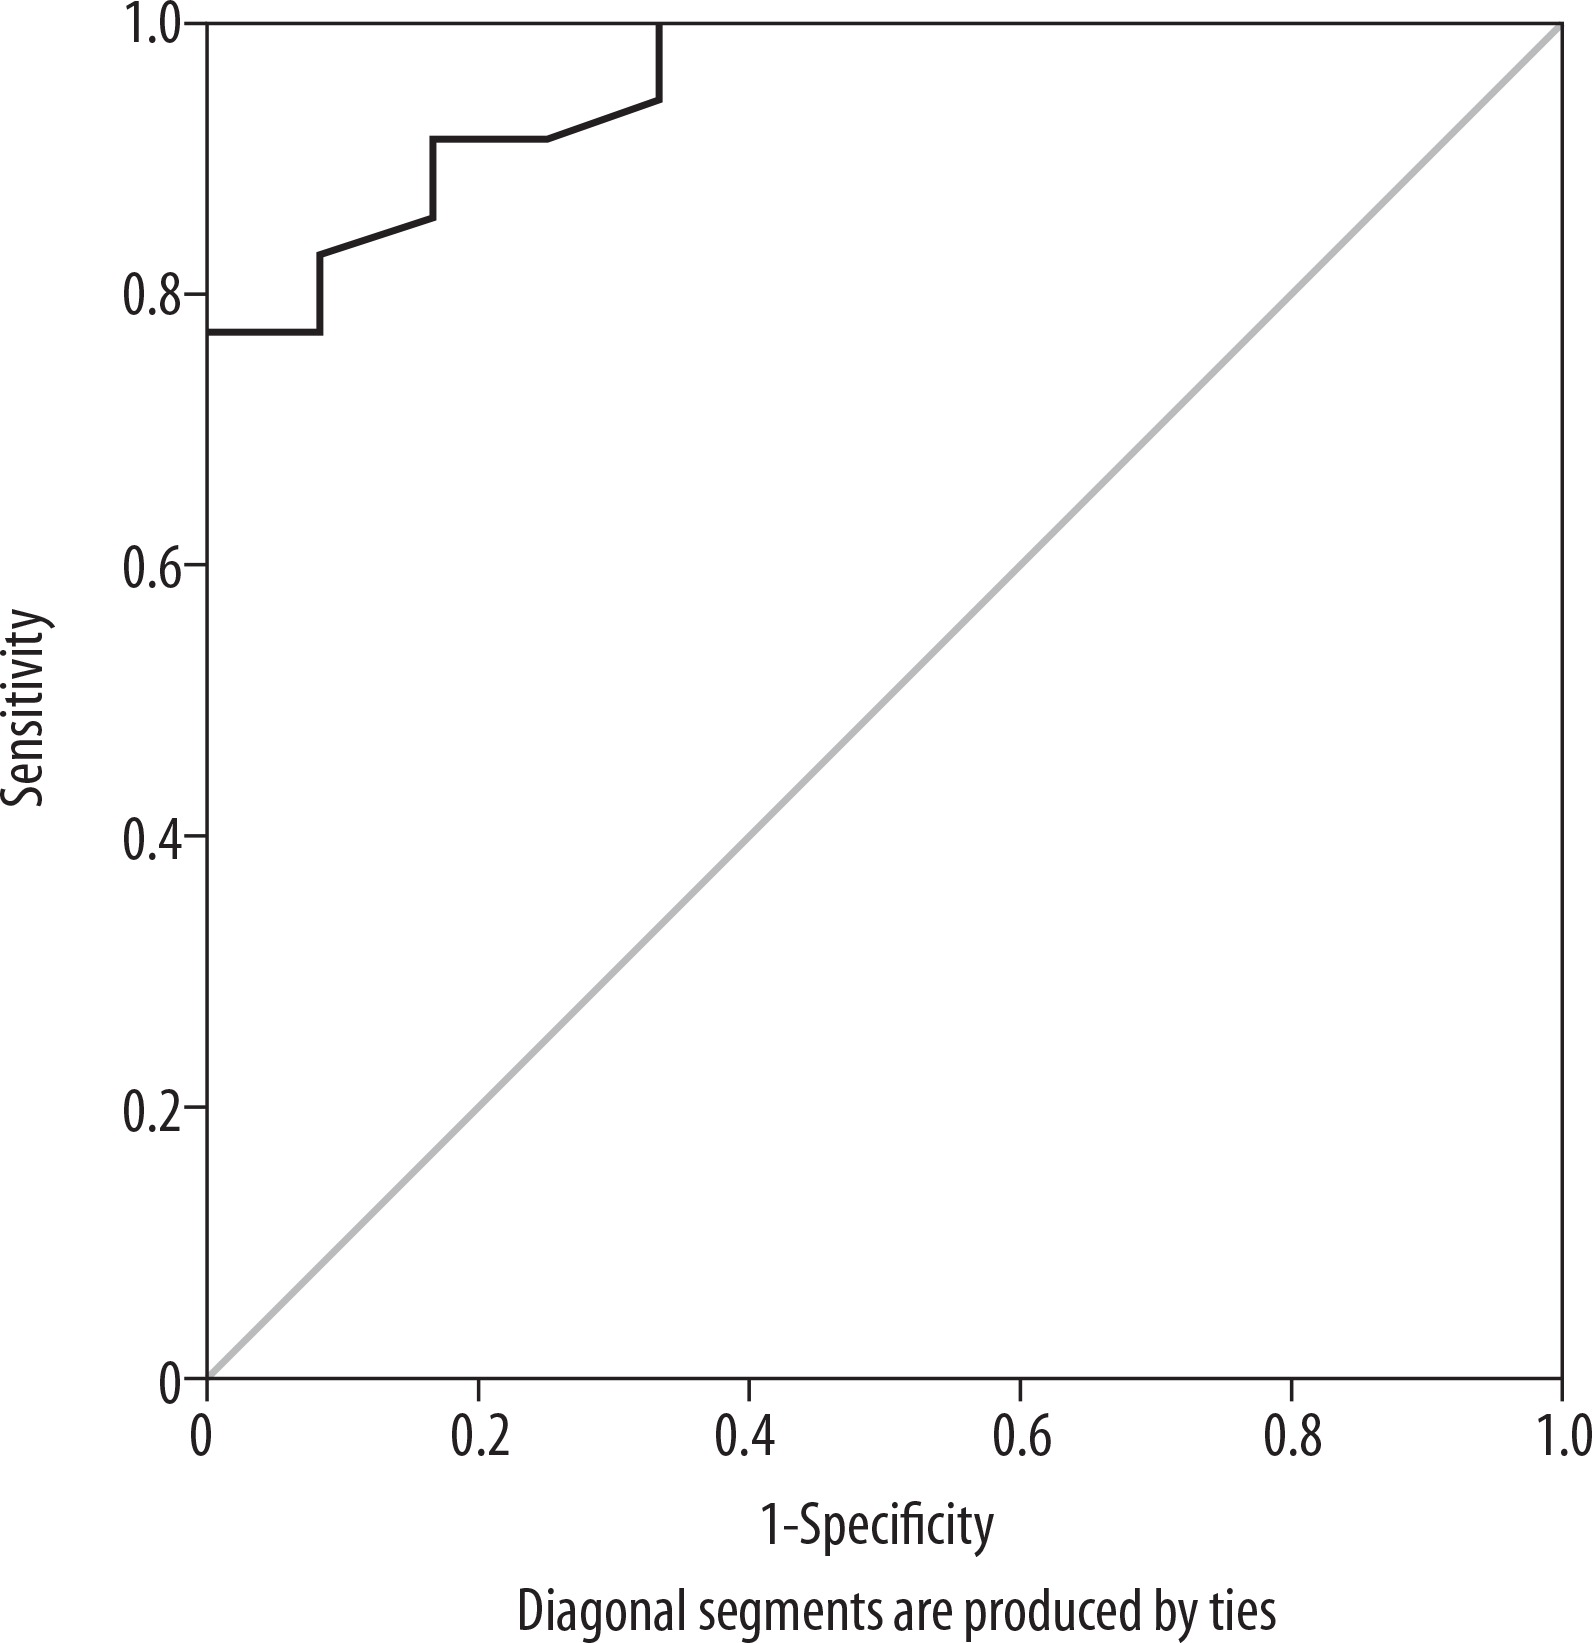
Figure 3
Images of a 59-year-old patient with left breast cancer IDC, Grade III before starting NAC. A) SITR image showing large left upper outer quadrant infiltrative lesion. B) Baseline subtraction image showing the large heterogeneous enhancing mass. C) Subtraction image showing malignant left axillary lymph nodes. D) The lesion showed type III dynamic MRI curve. E) The MRS study showed high Cho levels
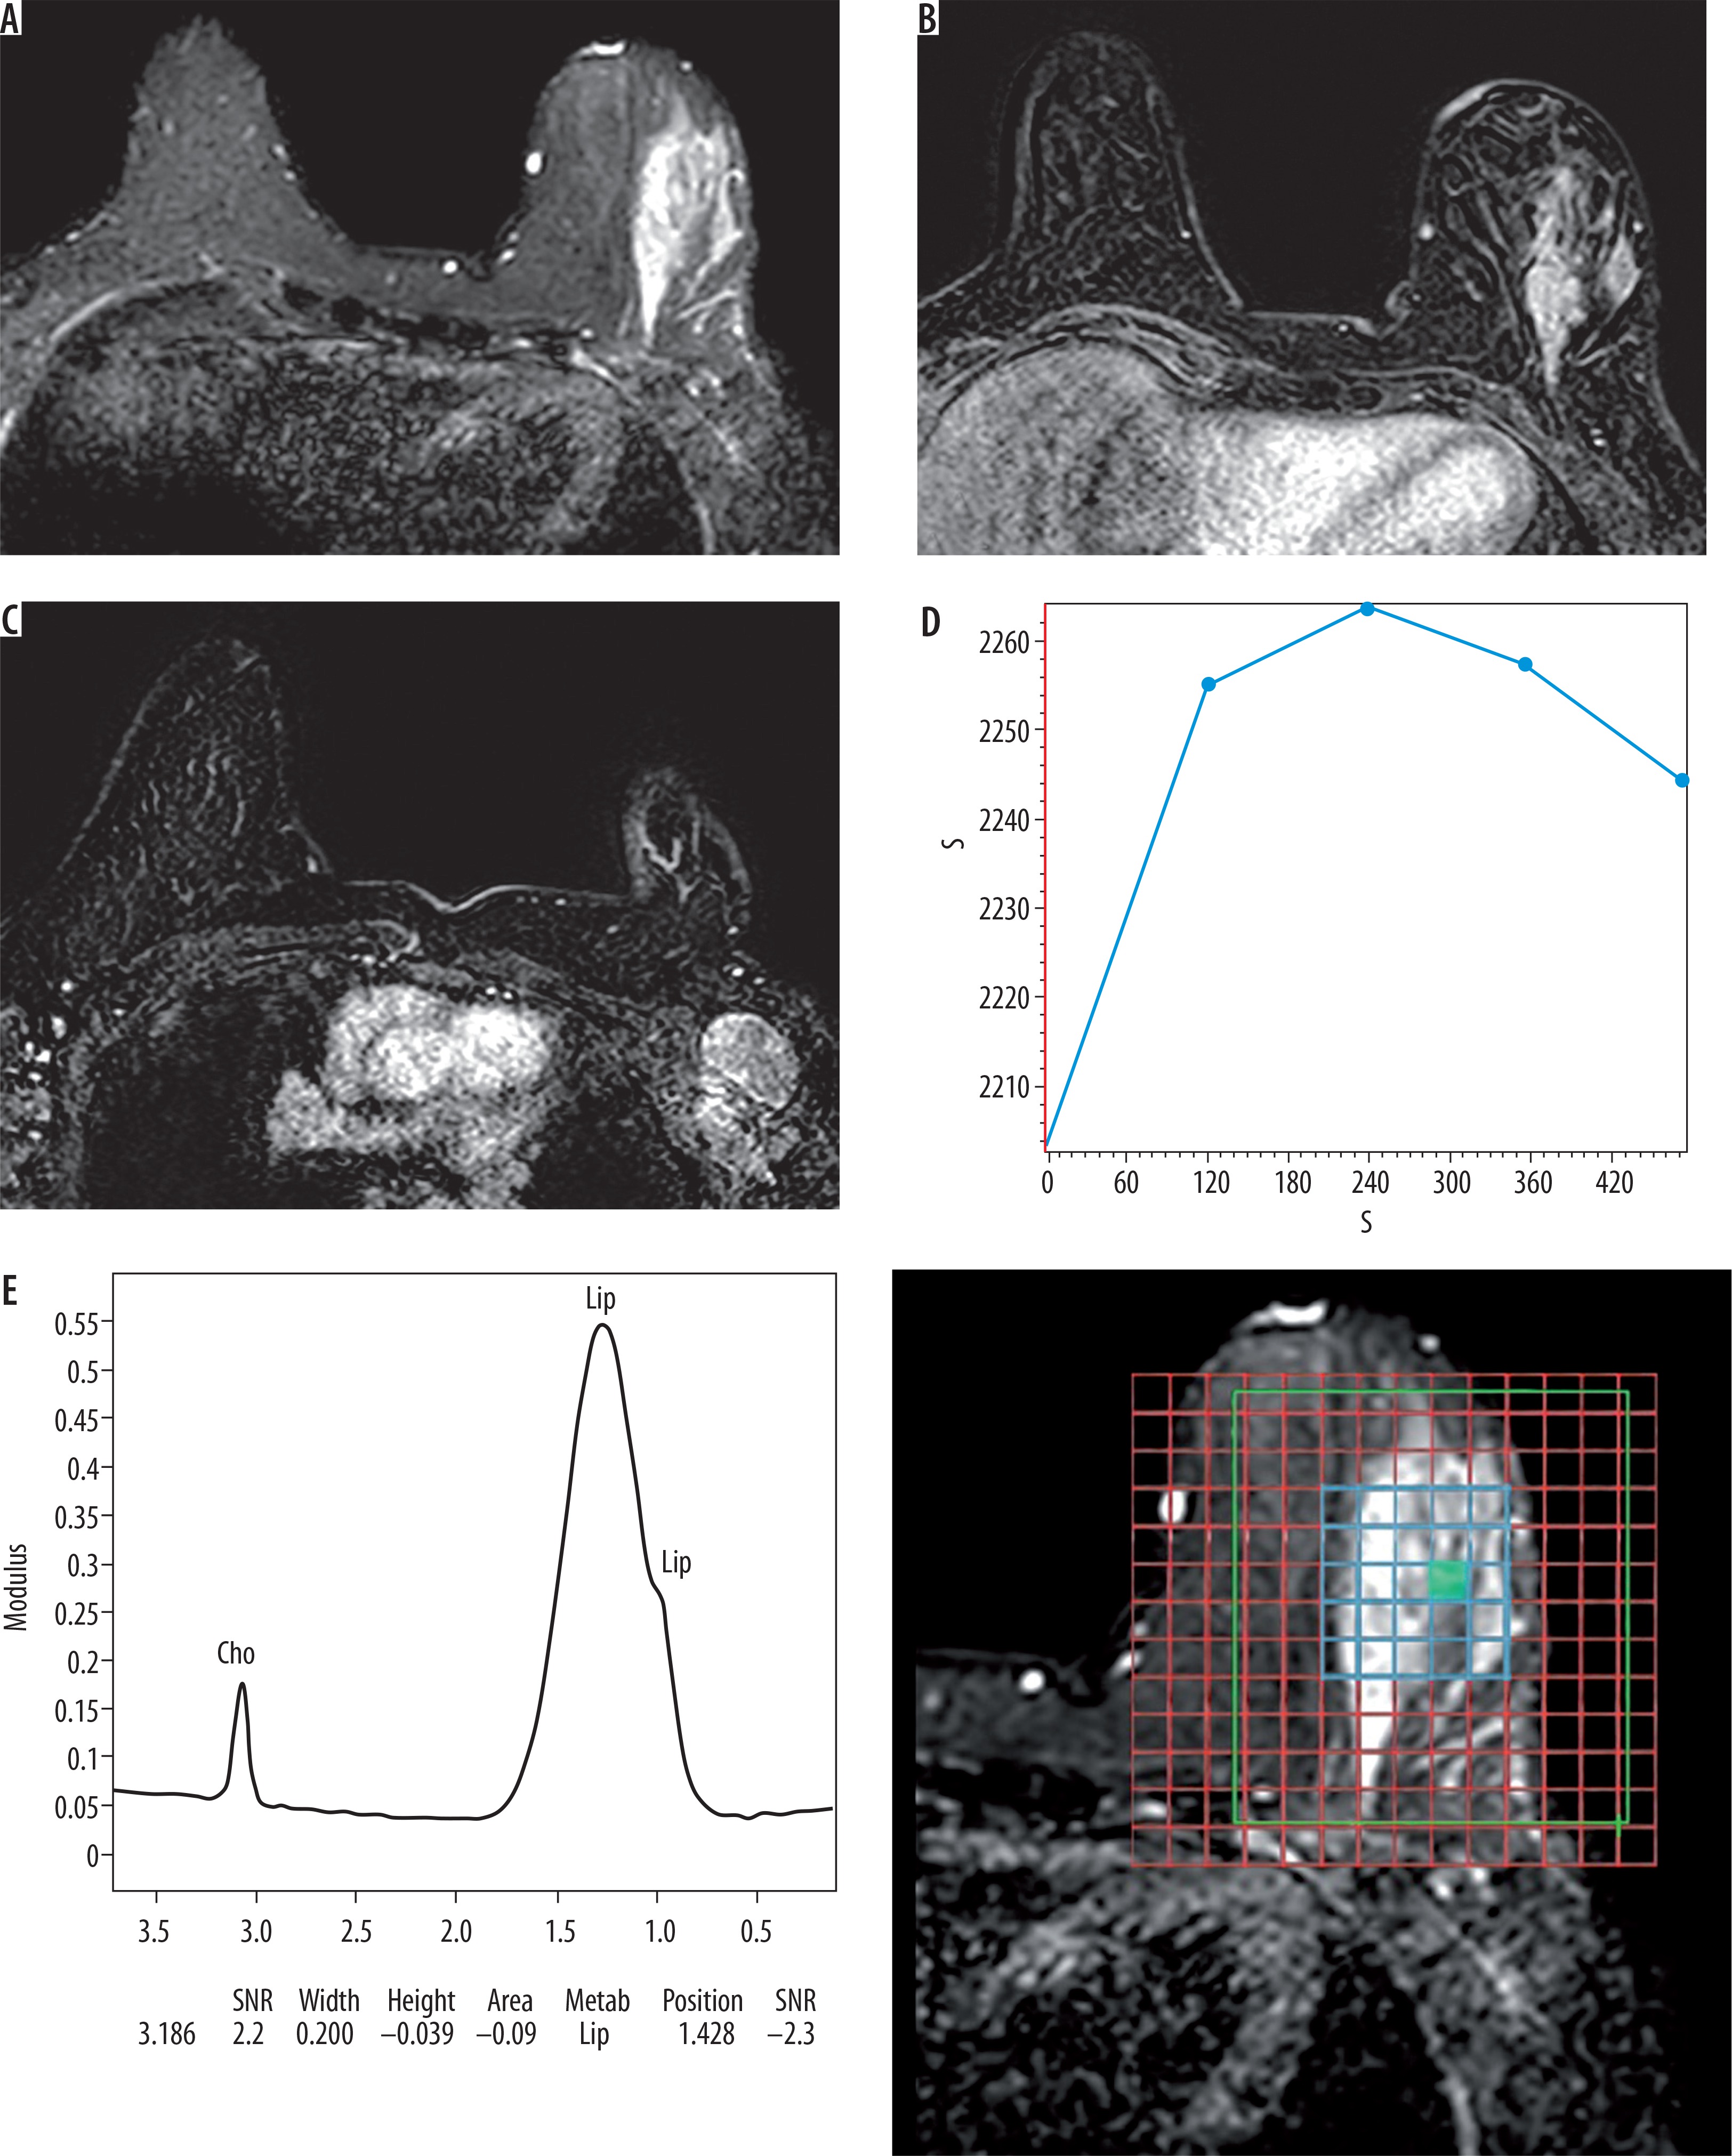
Figure 4
The same case after finishing NAC. A) SITR image showing left upper outer quadrant residual high SI. B) Subtraction image showing that there is no detected residual enhancement. C) Subtraction image showing reduced size of the malignant left axillary lymph nodes. D) The MRS study showed absent Cho peak. E) By histopathology there is no residual tumor detected (score 4) (original magnification ×100)

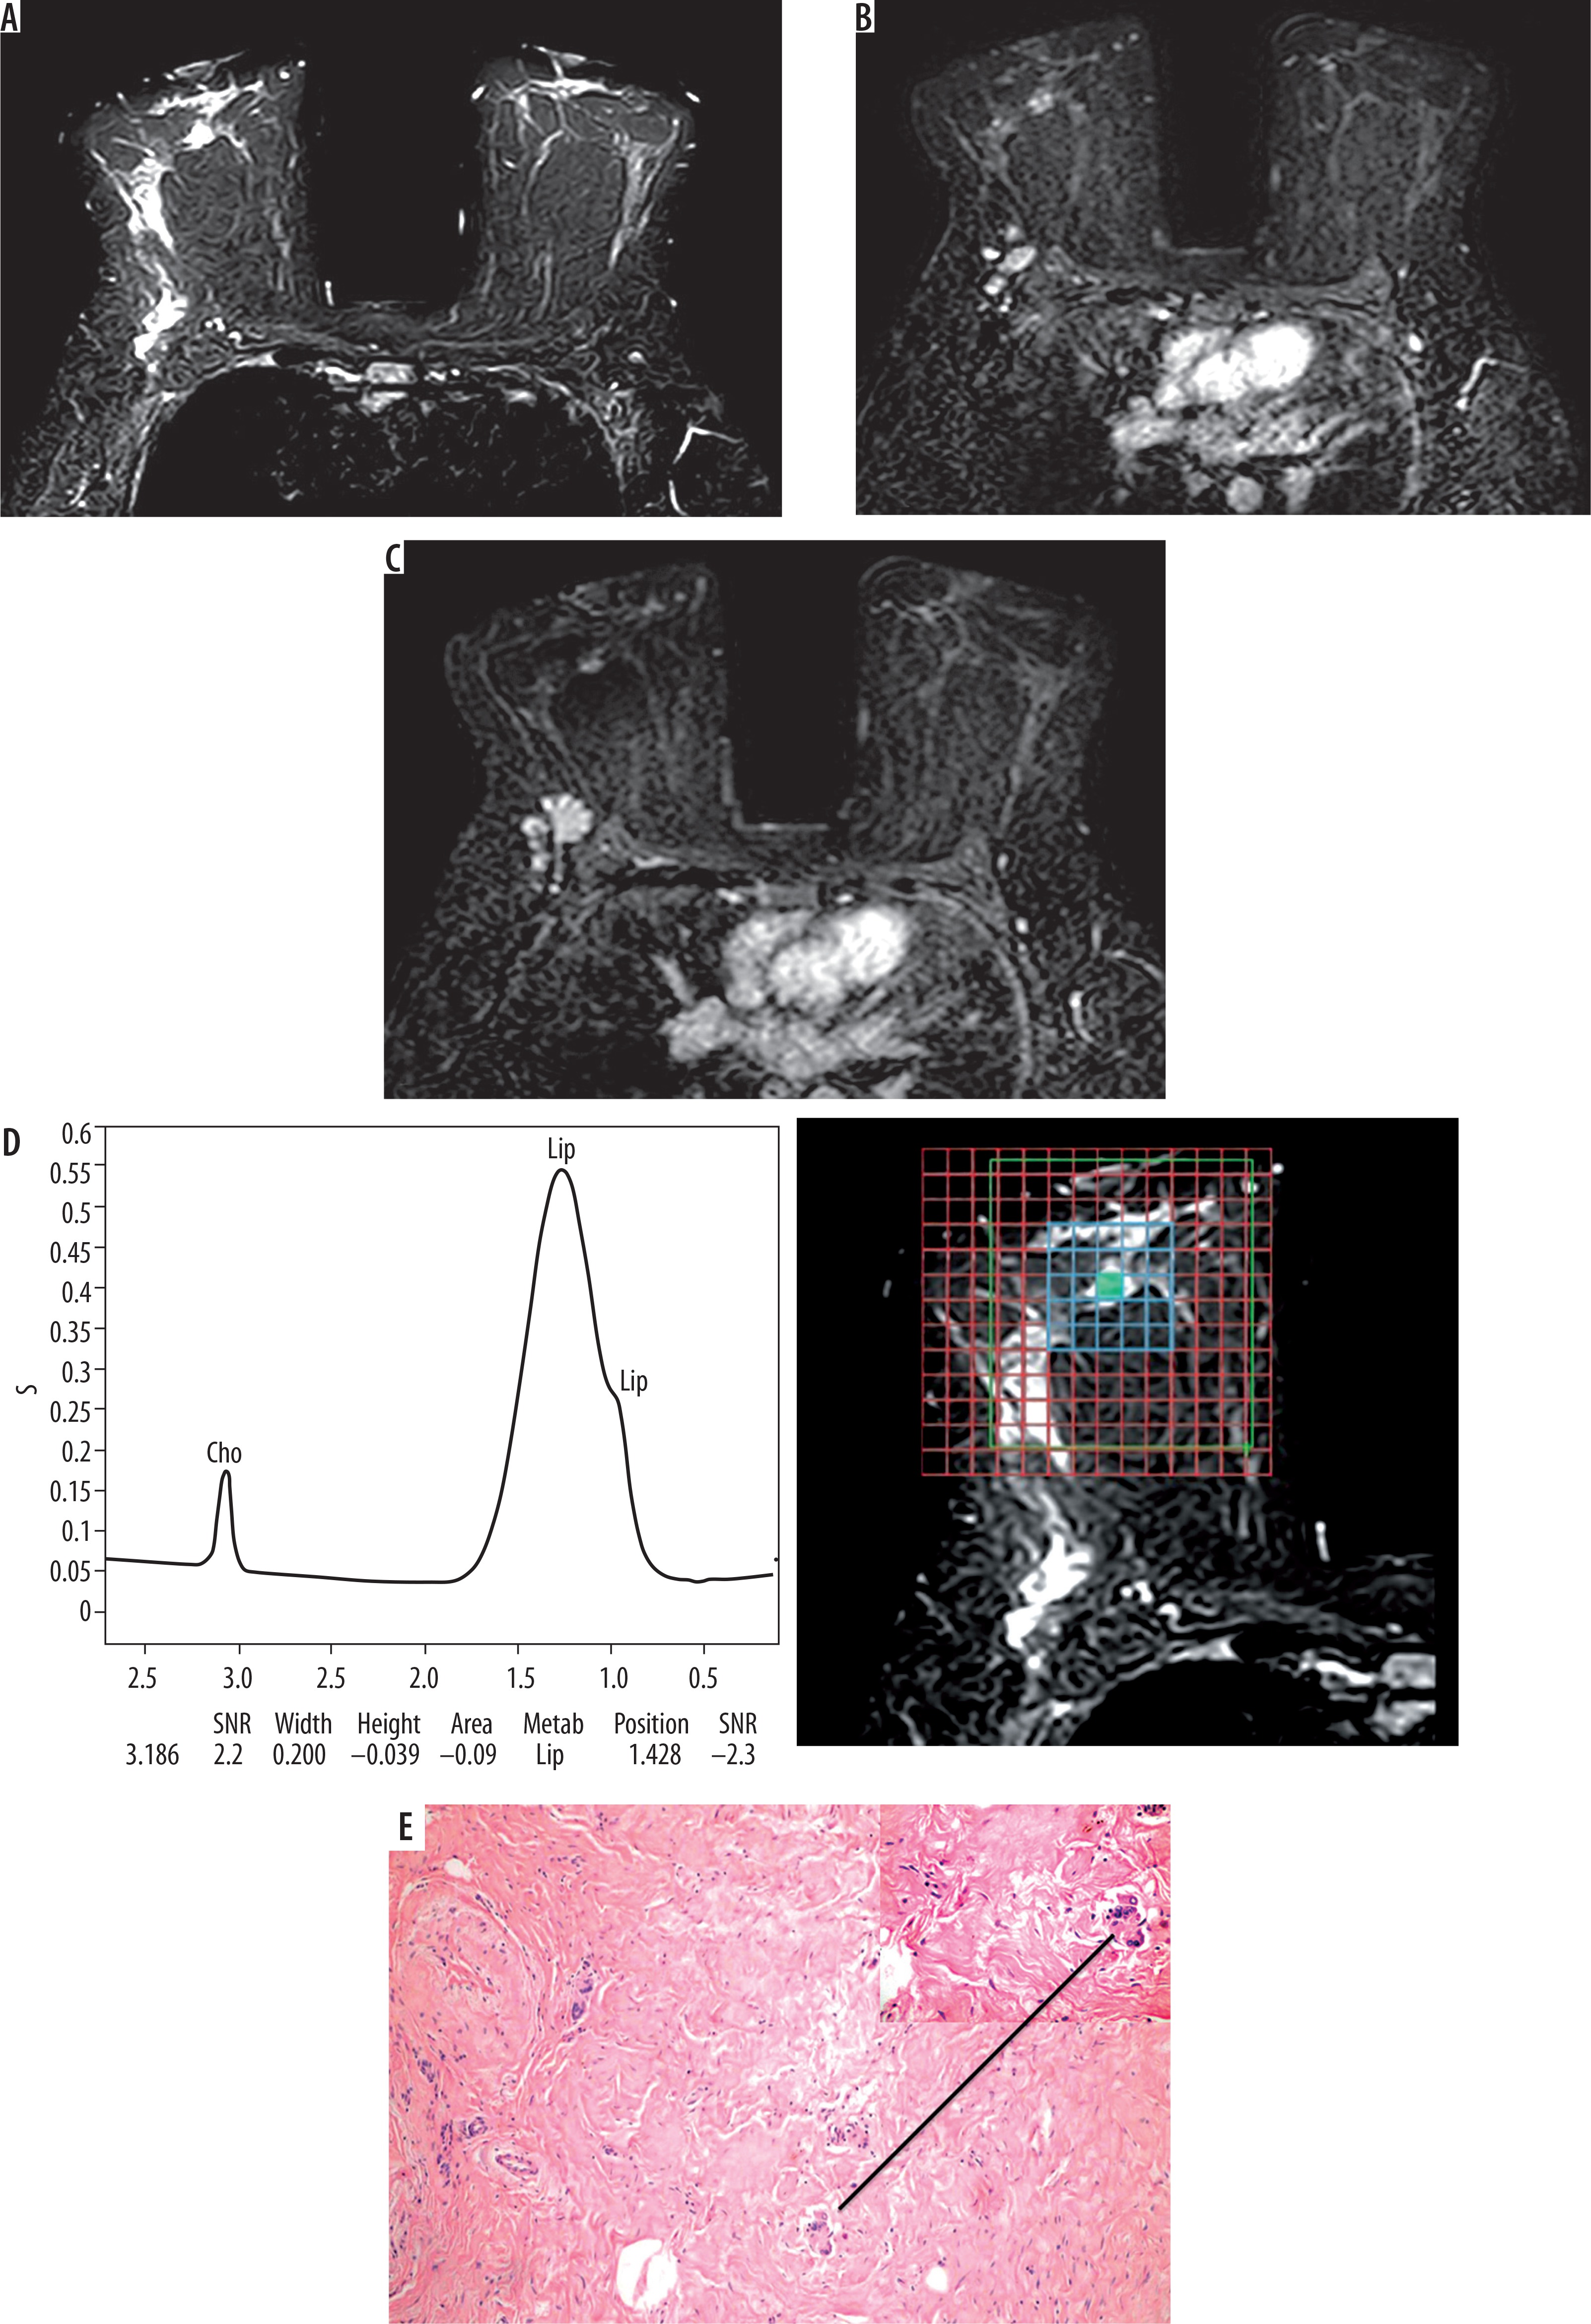
Figure 5
Images of a 52-year-old patient with right breast cancer IDC, Grade II before starting NAC. A) SITR image showing right retro-areolar infiltrative lesion, malignant right intra-mammary and axillary lymph nodes. B) Baseline subtraction image showing the heterogeneous enhancing retro-areolar mass. C) Subtraction image showing malignant right intra-mammary and axillary LNs. D) The lesion showed type III dynamic MRI curve. E) The MRS study showed high Cho levels

1H-MRS revealed a negative tCho in six cases after NAC (Figure 4); all of them showed complete pathological response.
By post-contrast dynamic MRI 22 patients showed complete response and 25 patients showed residual disease (Figure 6). So post-contrast dynamic MRI showed 83.3% sensitivity, 65.7% specificity, 45.5% positive predictive value, 92% negative predictive value, and the diagnostic accuracy was 70.2%. By using the combined evaluation using the post-contrast MRI and 1H-MRS together the diagnostic accuracy improved, and it was 91.5% with 75.0% sensitivity, 97.1% specificity, 75% positive predictive value, and 91.9% negative predictive value.
Figure 6
The same case after finishing NAC. A-SITR image showing residual right retro-areolar high SI lesion. B-Subtraction image showing the small residual retro-areolar enhancing lesion. C-Subtraction image showing reduced size of the malignant right axillary LNs. D-The MRS study showed residual Cho peak.
The ROC curve of total choline ratio (Figure 2) showed statistically significant differences and good validity for differentiating residual disease and complete response with maximum AUC of 0.955 and 82.9% sensitivity, 91.7% specificity, 96.7% positive predictive value, 64.7% negative predictive value, and 85.11% diagnostic accuracy. The cut-off value for differentiating residual disease and complete response was 1.95 (Table 1).
Discussion
The objective of this study was to assess the added value of 1H-MRS to post-contrast dynamic MRI to ensure complete pathological response in breast cancer patients after completing neoadjuvant chemotherapy.
Our results showed that there are statistically significant changes in the tumour size before and after the termination of NAC, which are easily detected by post-contrast MRI, which is an important indicator for the final response [7,8]. However, this morphological change does not provide sufficient information about the metabolic activity of the remaining tumour cells, which could be better judged by other techniques such as 1H-MRS [9]. Hence, we tried to combine the results of the post-contrast MRI with the results of tCho measurements after the termination of NAC to differentiate pathological complete responders from non-responders.
Many published papers have focused on the effect of chemotherapy on the mitotic activity and tumoural cellularity of breast cancer during the early phases of treatment, and they reported that the changes in the Cho within the early 24 hours of treatment were significantly different between clinical responders and non-responders [10-12].
Baek et al. [13] added that early Cho change is associated with later clinical response; also the change in Cho concentration can be greater than the change in the tumoural size in the pathological responders [14].
Our study differs from these publications because we wanted to focus on discussing the final effect of NAC on breast cancer through the final structural changes occurring in the tumour size and the important functional changes obtained through 1H-MRS alterations after finishing chemotherapy. Most of the chemotherapeutic changes in the tumour usually occur relatively later during treatment; in particular, the changes in Cho SNR as determined by 1H-MRS using the external reference method may be more sensitive than changes in the tumour size to predict the pathological response to achieve better diagnostic results [15,16].
Also, the final assessment after the termination of NAC and before surgical management helps to choose the proper operative approach better than the early assessment of chemotherapeutic effects on the tumour tissue [16].
In this study, we used the multi-voxel spectroscopic method, which is considered more efficient than single voxel spectroscopy because it helps in the acquisition of spectroscopic data from multiple voxels occupying a large volume of interest in a single measurement [17]. Also, the multi-voxel method provides the ability to get data from smaller voxel sizes with higher spatial resolution as well as a simultaneous sampling of the tumour and necrotic areas, so it is suitable for analysing the regional distribution of tumoural metabolites [8,18].
We assessed the value of using the biomarker Cho SNR along with the structural parameter (tumour size) in breast cancer patients to assess the tumour response to chemotherapy. In this study the mean Cho SNR before chemotherapy was 9.53 ± 1.7, and the mean Cho SNR after chemotherapy was 2.53 ± 1.3.
The sensitivity, specificity, and accuracy of 1H-MRS and dynamic post-contrast MRI were evaluated in assessing the tumour response and were compared with the histopathological results. All patients in the current study suffered from invasive ductal carcinoma, and they had an elevated level of tCho before chemotherapy. Elevated tCho concentration was previously reported in many studies in malignant neoplasms [19-21].
The composite Cho resonance reflects the abnormal cellular proliferation and is considered as a biomarker of the rapid growth rate of malignant tumours that can be assessed in association with tumour size to achieve better diagnostic accuracy [22,23]. Hence, all the pathologically proven malignant tumours (47 lesions) in the current study showed increased Cho levels before starting NAC. Also, the Cho SNR showed a significant reduction after the termination of NAC; moreover, the Cho peak was negative in six cases that showed complete clinical response.
Thus, when we used combined evaluation for assessment of tumoural response to chemotherapy including postcontrast MRI and 1H-MRS together, the diagnostic accuracy improved; it was 91.5% with 75.0% sensitivity, 97.1% specificity, 75% positive predictive value, and 91.9% negative predictive value, and the ROC curve analysis of total choline ratio showed statistically significant differences and good validity for differentiating residual disease, and complete response with the maximum AUC was 0.955 and 82.9% sensitivity, 91.7% specificity, 96.7% positive predictive value, 64.7% negative predictive value, and 85.11% diagnostic accuracy when we used the off value of 1.95 to differentiate between malignant and benign tumours. Different values for the cut-off value of Cho SNR to differentiate malignant from benign neoplasms were given, Jacobs et al. [24] reported a Cho SNR of 4 as a cut-off value. Another study was carried out by Baek et al. [25], who reported a Cho SNR of 3.2.
There are some limitations to this study, chiefly the restricted role of 1H-MRS in characterising small lesions less than 1 cm due to the partial volume averaging effect [24]; this effect can be less apparent in larger lesions. Secondly, lipid contamination and possible patient’s motion can lower the sensitivity of Cho detection [26]. Finally, multi-parametric imaging combining diffusion-weighted imaging with MR spectroscopy and dynamic contrast MRI will improve the results in the future.