


Introduction
Primary sclerosing cholangitis (PSC) is a chronic progressive hepatic disease affecting intrahepatic and/or extrahepatic bile ducts (IHBD and EHBD). PSC leads to bile duct fibrosis, stricture, cholestasis, and ultimately biliary cirrhosis. Genetic and environmental factors contribute to PSC development. However, its pathogenesis is not fully elucidated. With a pre-valence of less than 20 per 100,000 population, PSC is a rare disease, more common in men, and usually diagnosed in the 30s-50s. Despite ongoing research, no optimal treatment has been reported to improve transplant-free survival of PSC patients [1,2]. Given the higher risk of cholangiocarcinoma and colorectal cancer in patients with inflammatory bowel disease (IBD)-PSC, early diagnosis of PSC can facilitate treatment management and cancer surveillance in these patients [3].
In approximately 70% of patients, PSC is associated with IBD. Ulcerative colitis (UC) and Crohn’s disease (CD) are the 2 most frequent IBD types, characterized by idiopathic inflammation of the gastrointestinal tract. On the other hand, more than one-third of IBD patients present with extraintestinal complications, and PSC is the most frequent hepatobiliary comorbidity, particularly in patients with UC [4]. Patients with PSC and IBD present a distinctive IBD phenotype with a higher frequency of backwash ileitis, pancolitis, and rectal sparing [5].
The diagnosis of PSC mainly relies on characteristic laboratory findings, i.e. a cholestatic pattern of liver function tests, and imaging findings, i.e. biliary stricture and dilation in cholangiography. Magnetic resonance cholangiography (MRCP) is the preferred non-invasive imaging modality [1,6]. Other modalities, such as abdominal ultra-sound (particularly for assessment of EHBD), can also detect parenchymal and ductal pathologies [7,8].
Magnetic resonance enterography (MRE) is the preferred imaging modality for detecting intestinal changes in IBD patients with high sensitivity and specificity in both adults and children because it does not involve radiation exposure, unlike computed tomography (CT) [9]. In addition to the intraluminal and extraluminal pathologies, MRE enables the assessment of extraintestinal complications of IBD, which may result in early accidental findings. Considering the association of IBD and PSC, hepatobiliary pathologies suggestive of PSC can be among the most important extraintestinal accidental findings on MRE examination, but the MRE field of view might not provide a perfect visualization of the liver.
Whether the benefits of reporting and following up on hepatobiliary findings outweigh its drawbacks is not well established. On the one hand, the incidental findings can lead to early PSC diagnosis, potentially resulting in better treatment outcomes and early screening for cholangiocarcinoma. On the other hand, these findings may cause further unnecessary evaluations and increased health care costs as well as patient anxiety [10,11]. Radiologists might be reluctant to include biliary findings in MRE reports of IBD patients concerning the risk of over- or underestimation of PSC secondary to motion artifacts, background noise, or limited view of the biliary tree.
To the best of our knowledge, the clinical relevance of hepatobiliary findings on MRE examination of IBD patients has not been reported. Therefore, in this study, we aimed to investigate the significance and clinical relevance of the abnormal hepatobiliary findings on MRE of IBD patients to find the most specific indicators of PSC on MRE examination.
Material and methods
Study design and participants
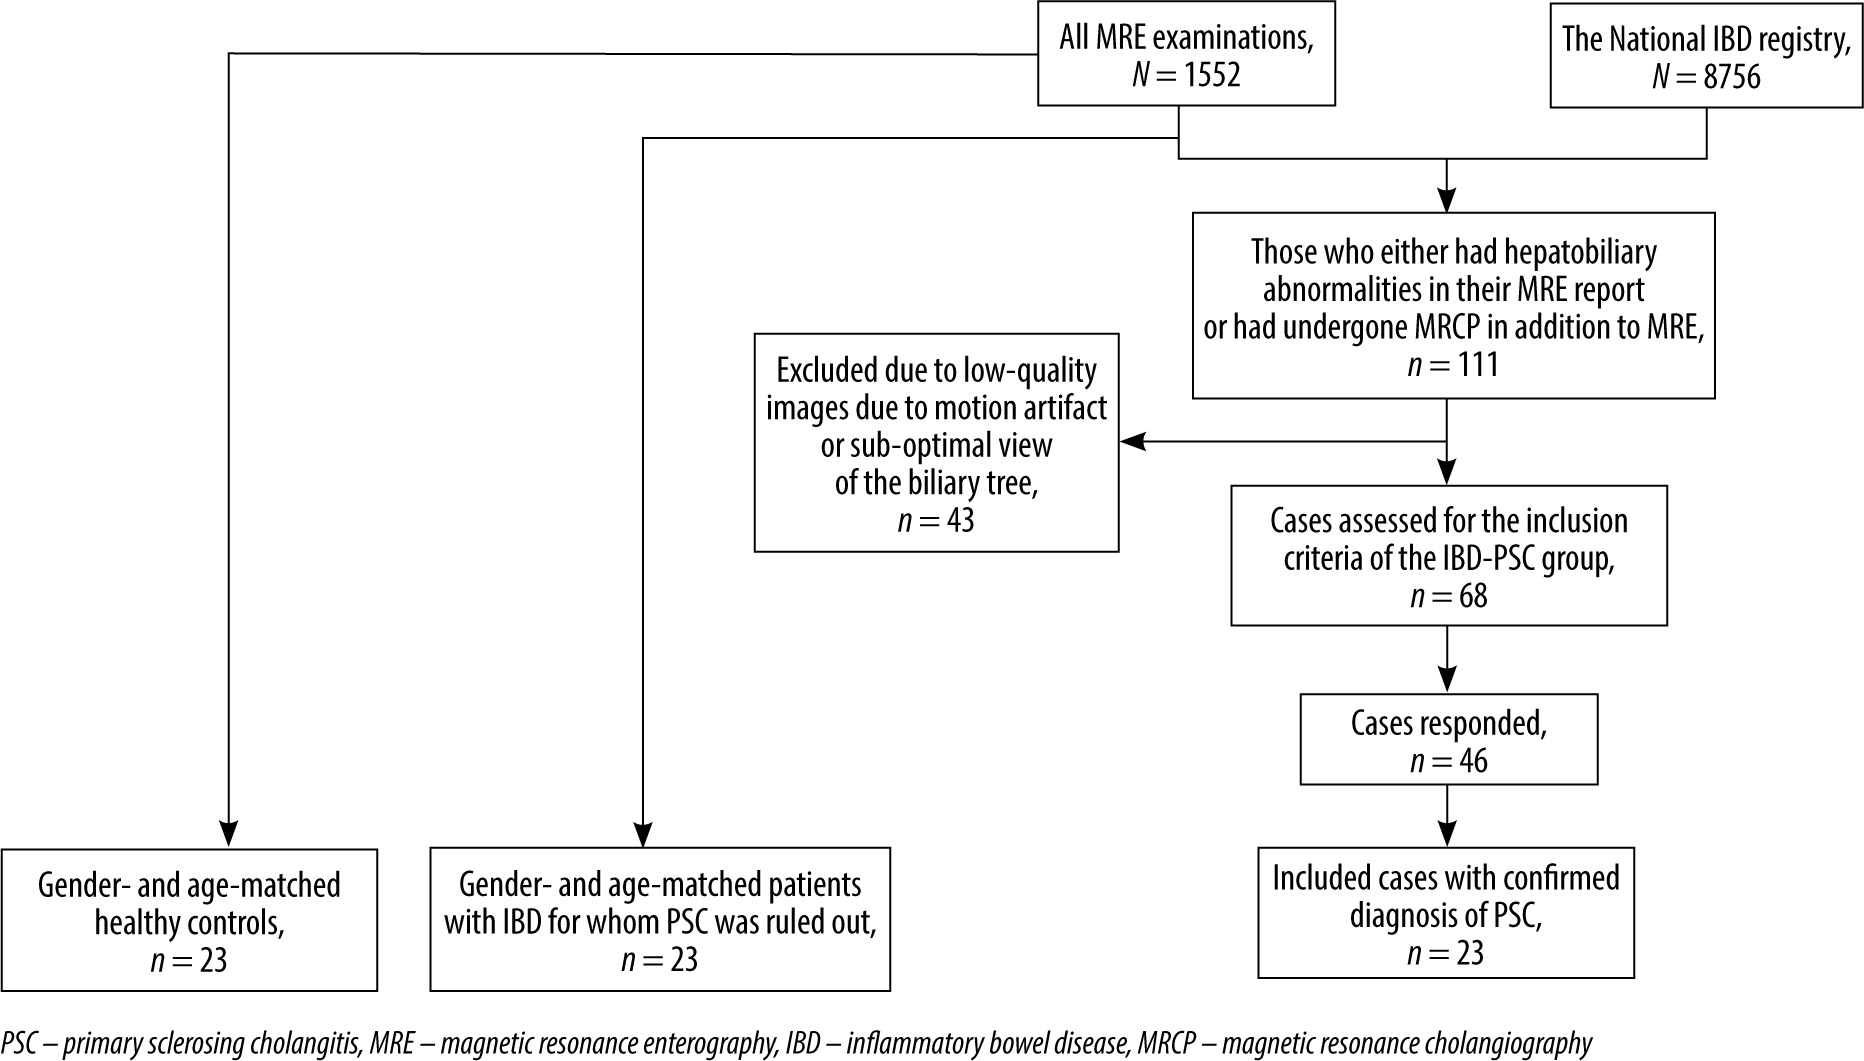
This is a single-centre, retrospective, observational study. The study protocol was approved by the Institutional Research Ethics Committee of Tehran University of Medical Sciences (approval number: IR.TUMS.DDRI.REC. 1398.010) in concordance with the Helsinki Declaration. The requirement of informed consent was waived by the IRB of Tehran University of Medical Sciences due to the retrospective nature of the study (approval number: IR.TUMS.DDRI.REC.1398.010). We used the MRE dataset of patients from our referral university hospital between November 2011 and July 2019. The IBD-PSC patients were selected among those registered in the National Registry of Crohn’s and Colitis [12] and either had hepatobiliary abnormalities in their MRE report or had undergone MRCP in addition to MRE in our centre. The National Registry contained 8756 patients, and the MRE dataset included 1552 cases. Among the 111 selected cases, 43 were excluded because of the sub-optimal view of the biliary tree on MRE or low-quality images due to motion artifacts. Patients were included in the IBD-PSC group if the gastroenterologist had established the diagnosis of PSC for them within the past 6 months of MRE based on the following inclusion criteria: 1) positive MRCP or endoscopic retrograde cholangiopancreatography (ERCP) findings including mural irregularities and diffusely distributed, multifocal, short, annular strictures alternating with normal or slightly dilated segments; 2) cholestatic pattern of liver function tests including serum alkaline phosphatase (AP) levels > 1.5 times the upper limit of normal (ULN) and gamma-glutamyl transpeptidase (GGT) levels > 3 ULN [13]. We contacted the remaining 68 patients to assess whether they met the inclusion criteria. Forty-six patients responded, among whom 23 were included in the IBD-PSC group. We randomly selected 23 gender- and age-matched patients with IBD for whom PSC was ruled out and 23 healthy controls (HC) from the MRE database by applying a 1 : 1 ratio (Figure 1). The IBD without PSC cases were selected from our MRE dataset if they met the following inclusion criteria: 1) being registered in the IRCC Registry, 2) having a satisfactory view of the biliary tree in MRE, 3) normal LFT within one month of MRE exam, and 4) no evidence of cholestasis in follow-up (at least 12 months) confirmed by the gastroenterologist. The HC group cases were included if they met criteria 2, 3, and 4 from the inclusion criteria of the IBD without PSC group in addition to the normal MRE report, and no evidence of IBD development in follow-up (at least 12 months) confirmed by the gastroenterologist.
Magnetic resonance enterography protocol
The MRE protocol has been described before [14]. Participants were asked to eat a low-residue diet from 48 hours before the MRI scan and fast for at least 6 hours before the MRI on the day of examination. The day before MRI, they were instructed to ingest three 70-g packets of polyethylene glycol (PEG) diluted in 1.5 l of tap water for colonic preparation and to increase the quality of small bowel and colon assessment. On the day of examination, the participants divided a solution containing one packet of PEG and 1.5 L tap water into 3 aliquots to drink 45 minutes ahead of the examination.
An expert radiologist assessed bowel distention using initial coronal T2-weighted, half-Fourier, single-shot turbo spin-echo (HASTE) images. In case of inadequate bowel distention, an additional 500 mL of PEG solution was administered. To enhance gastric emptying, oral metoclopramide (10 mg) was administered with the first aliquot. When adequate bowel distention was achieved, IV hyoscine N-butyl bromide (20 mg) was administered to reduce bowel movements.
All MRE examinations were performed using a 1.5 T MRI (Avanto; Siemens Healthineers) equipped with an 18-channel torso phased-array coil. Table 1 describes the standard MRE protocol used in this study. Enhanced images were obtained during the portal venous phase.
Table 1
MR imaging parameters for MRE protocol
Magnetic resonance enterography review
The MRE images were reviewed by 2 board-certified radio-logists with more than 10 years of academic experience in abdominal imaging in consensus, who were blinded to clinical data and diagnosis. A satisfactory view of the biliary tree in MRE images was confirmed by the 2 radiologists in consensus if, 1) all liver segments were covered on coronal T2-weighted and post-contrast T1-weighted images, and 2) axial T2-weighted images covered segments 2, 4a, 7, and 8. The radiologists assessed and documented conventional, morphological, and enhancement parameters on prepared standardized datasheets. Any potential involvement in other parts of the GI tract was reviewed in consensus.
Image evaluation
IHBD dilation was defined if the diameter of the IHBDs were greater than the more central ducts or if they were greater than 3 mm in diameter [15]. IHBD dilation was subjectively scored as mild (< 4 mm), moderate (between 4 and 6 mm), and severe (> 6 mm) [16]. EHBD stricture was defined as a diameter of < 1.5 mm in the common bile duct or < 1.0 mm in the common hepatic duct [17]. Wall thickening was defined as a thickness greater than 1.5 mm on T2-weighted or contrast-enhanced images [18]. Periportal lymphadenopathy (LAP) was defined as abnormal nodular structures in the gastrohepatic ligament (≥ 10 mm) and portocaval space (≥ 13 mm) [19]. Enhancement and T2-weighted signal intensity were assessed subjectively and normalized by the psoas muscle. They were subjectively scored on a 3-level scale (mild, moderate, and severe) based on the number of image slices having the abnormality. It was defined as mild, moderate, and severe if the abnormalities were observed in <50%, ≥50% but not all, and all slices, respectively. The reviewers also assessed the images for liver parenchyma alterations and hepatobiliary stones. The largest measurable value was considered as the common biliary duct (CBD), common hepatic duct (CHD), and spleen diameter.
Statistical analysis
Continuous variables were described as mean (SD) if normally distributed and as median (range) if their distribution was not normal. Categorical variables were described as proportions. IHBD dilation, peribiliary hyperenhancement, and hyperintensity were ordinal variables. IHBD, CBD, and CHD thickening and irregularities, EHBD (CHD and CBD) stricture, splenomegaly, periportal oedema, liver volume redistribution, liver parenchymal change, and periportal LAP were binary variables. CBD diameter, CHD diameter, periportal fat thickness, and spleen diameter were continuous variables.
We used one-way non-parametric analysis of variance (ANOVA) (Kruskal-Wallis test) and ANOVA to compare ordinal and continuous variables, respectively, between the 3 groups. We performed Fisher’s exact test between every 2 groups to compare binary variables. The Shapiro-Wilk test was used to assess normality. We used receiver operating characteristic (ROC) analysis to assess diagnostic performance of the diameter of CHD and periportal fat thickness in detecting PSC. We selected the optimal cut-off point using the Youden index.
All statistical analyses were performed using IBM SPSS Statistics for Windows, version 25 (IBM Corp., Armonk, N.Y., USA). A p-value <0.05 was considered statistically significant.
Results
Study participants
A total of 69 participants were enrolled in this study. Twenty-three participants with IBD-PSC, 23 IBD patients for whom PSC was ruled out, and 23 HC individuals were included in the study. Table 2 illustrates the demographic features of the participants. Participants in the IBD-PSC group were age- and gender-matched with the other groups. In 20/23 IBD-PSC patients, signs of IBD were observed on the MRE examination. In the IBD-PSC group, MRE findings suggestive of UC (57%) were significantly more common compared to the IBD group (17%) (p = 0.002).
Table 2
Demographic features of the participants
Morphological features, enhancement features, and signal intensity
Bile duct irregularities were the most common finding in the IBD-PSC group, with a frequency of 20/23 (91%). IHBD and EHBD irregularities were observed in 87% and 78% of the IBD-PSC patients, respectively (Figures 2-4). Bile duct thickening was detected in 18/23 (78%) of the IBD-PSC patients. Both IHBD and EHBD thickening had an observation rate of 15/23 (65%). In addition to bile duct irregularities and thickening, detection of bile duct dilation was significantly more frequent in the IBD-PSC group (48%) comped to healthy controls and IBD patients without PSC. In 35% of IBD-PSC patients, EHBD stricture was found, while this finding was absent in the other groups. Moreover, periportal oedema was also more commonly reported in the IBD-PSC group (22%), and periportal fat thickness was significantly higher in this group (p = 0.001). Splenomegaly was also more common in the IBD-PSC (26%), and the spleen diameter was significantly higher (p < 0.001). We found a significant difference between the IBD-PSC and both HC and IBD without PSC groups for all the mentioned variables. In contrast, no significant difference was observed between the latter 2 groups (Table 3). IHBD and EHBD stone was not reported in any of the groups. Liver volume redistribution (4%), parenchymal change (13%), periportal lymphadenopathy (13%), and gallstones (9%) were among other findings in the IBD-PSC group; however, there was no significant difference in their frequency compared to other groups.
Figure 2
Primary sclerosing cholangitis findings in magnetic resonance enterography of a 26-year-old male patient with Crohn’s disease. A, B) Coronal T2-weighted HASTE images show mural irregularity in intra hepatic bile ducts in segments 6 and 7 (thin arrows) associated with a low-grade stricture (arrowhead) and mild upstream dilation (thick arrow) in segment 2. C) Coronal post-contrast T1-weighted VIBE sequence displays mildly irregular mural thickening and enhancement (thin arrows) in intrahepatic ducts at segment 6 and 7
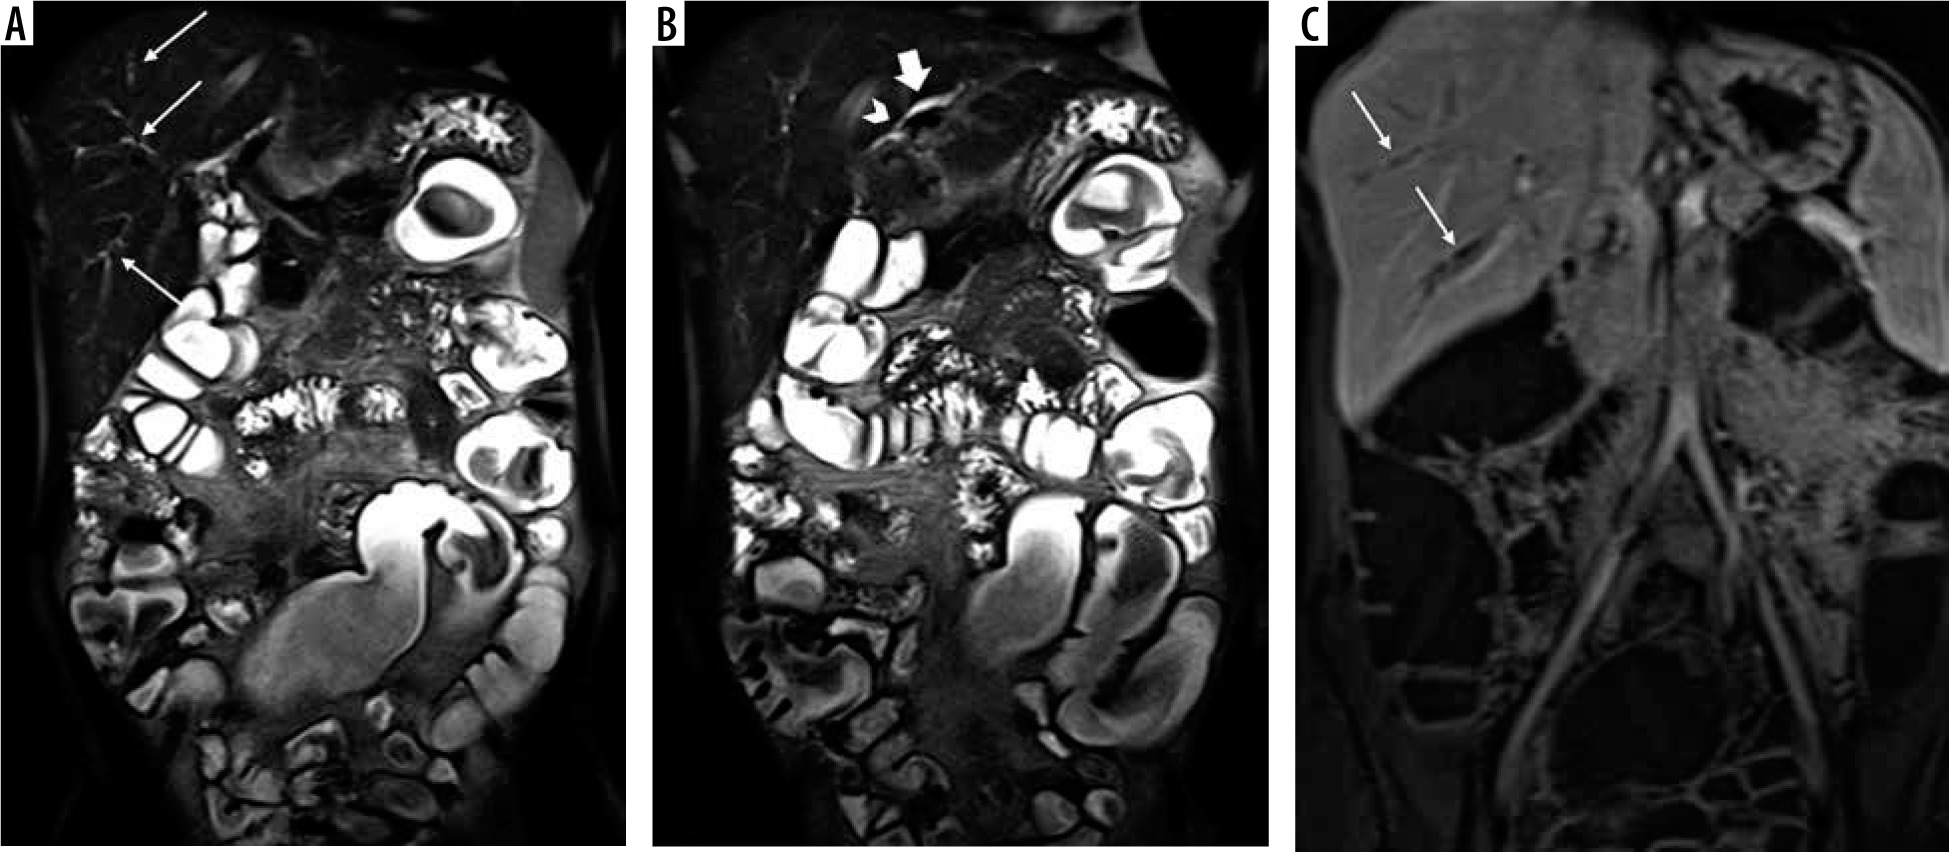
Figure 3
Findings of primary sclerosing cholangitis in a 49-year-old male patient with ulcerative colitis at magnetic resonance enterography. A) Coronal T2-weighted HASTE sequence shows mild segmental dilatation of peripheral intrahepatic bile ducts at segment 6 and 7 (arrows). B, C) Coronal fat-suppressed T2-weighted (HATRIRM) and post-contrast T1-weighted VIBE sequences display mural irregularity in a mildly dilated intrahepatic bile duct at segment 2 (arrowheads) associated with mural thickening and low-grade enhancement (thick arrows). Loss of haustration (dotted arrows) is also noted in the descending colon and sigmoid along with mild mural hyper enhancement (curved arrows) in favour of left-sided colitis with low-grade activity
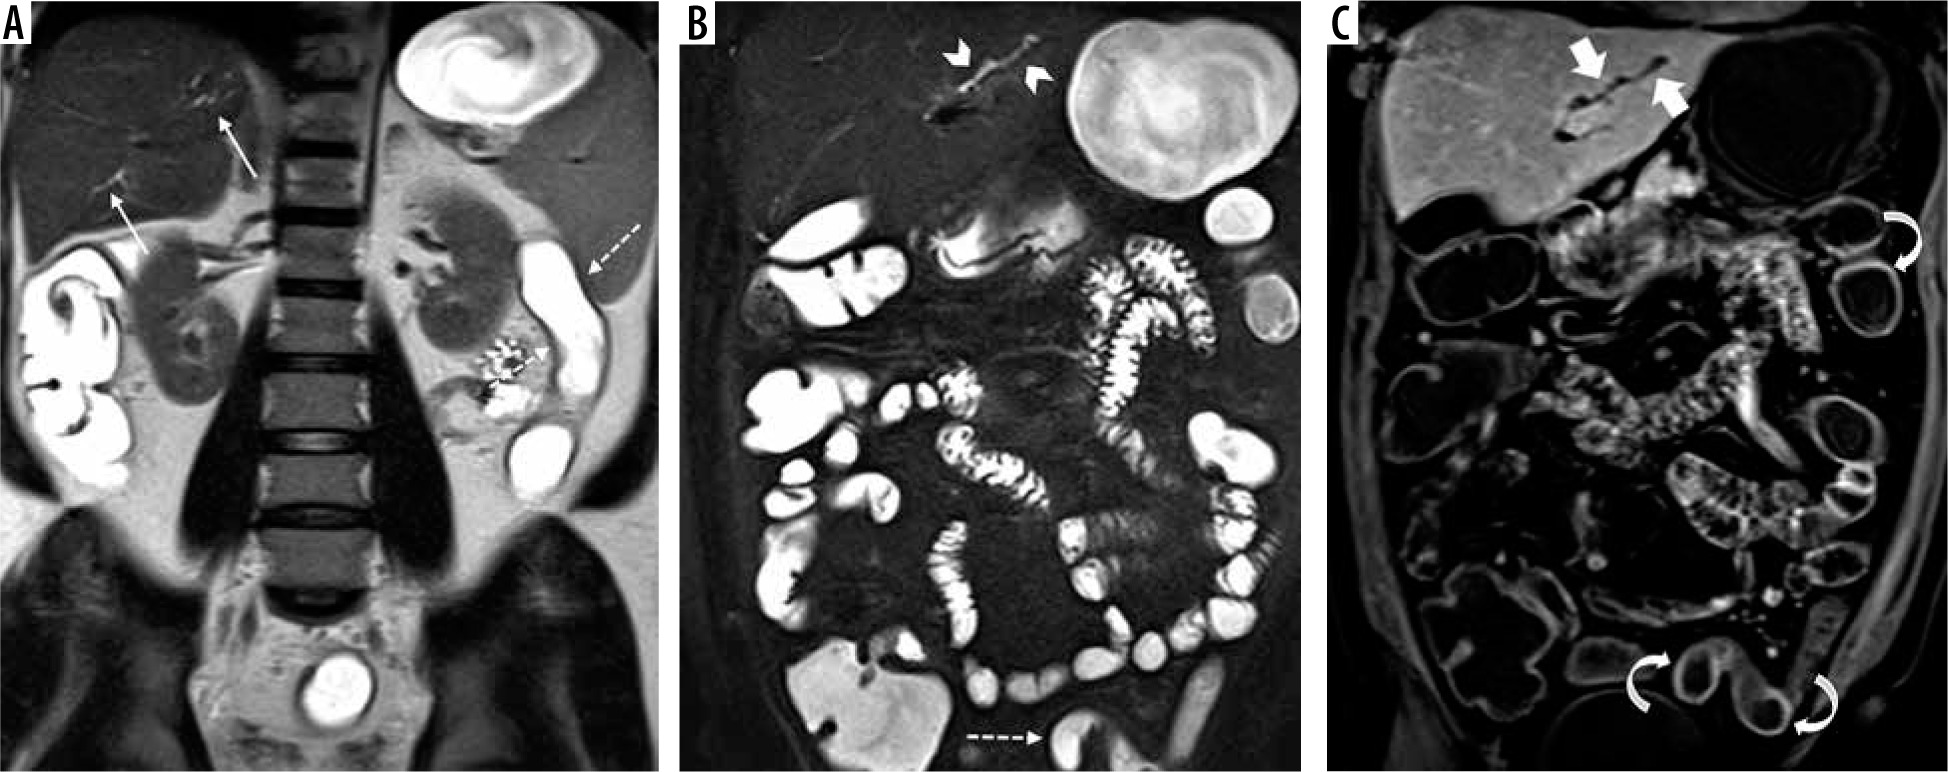
Figure 4
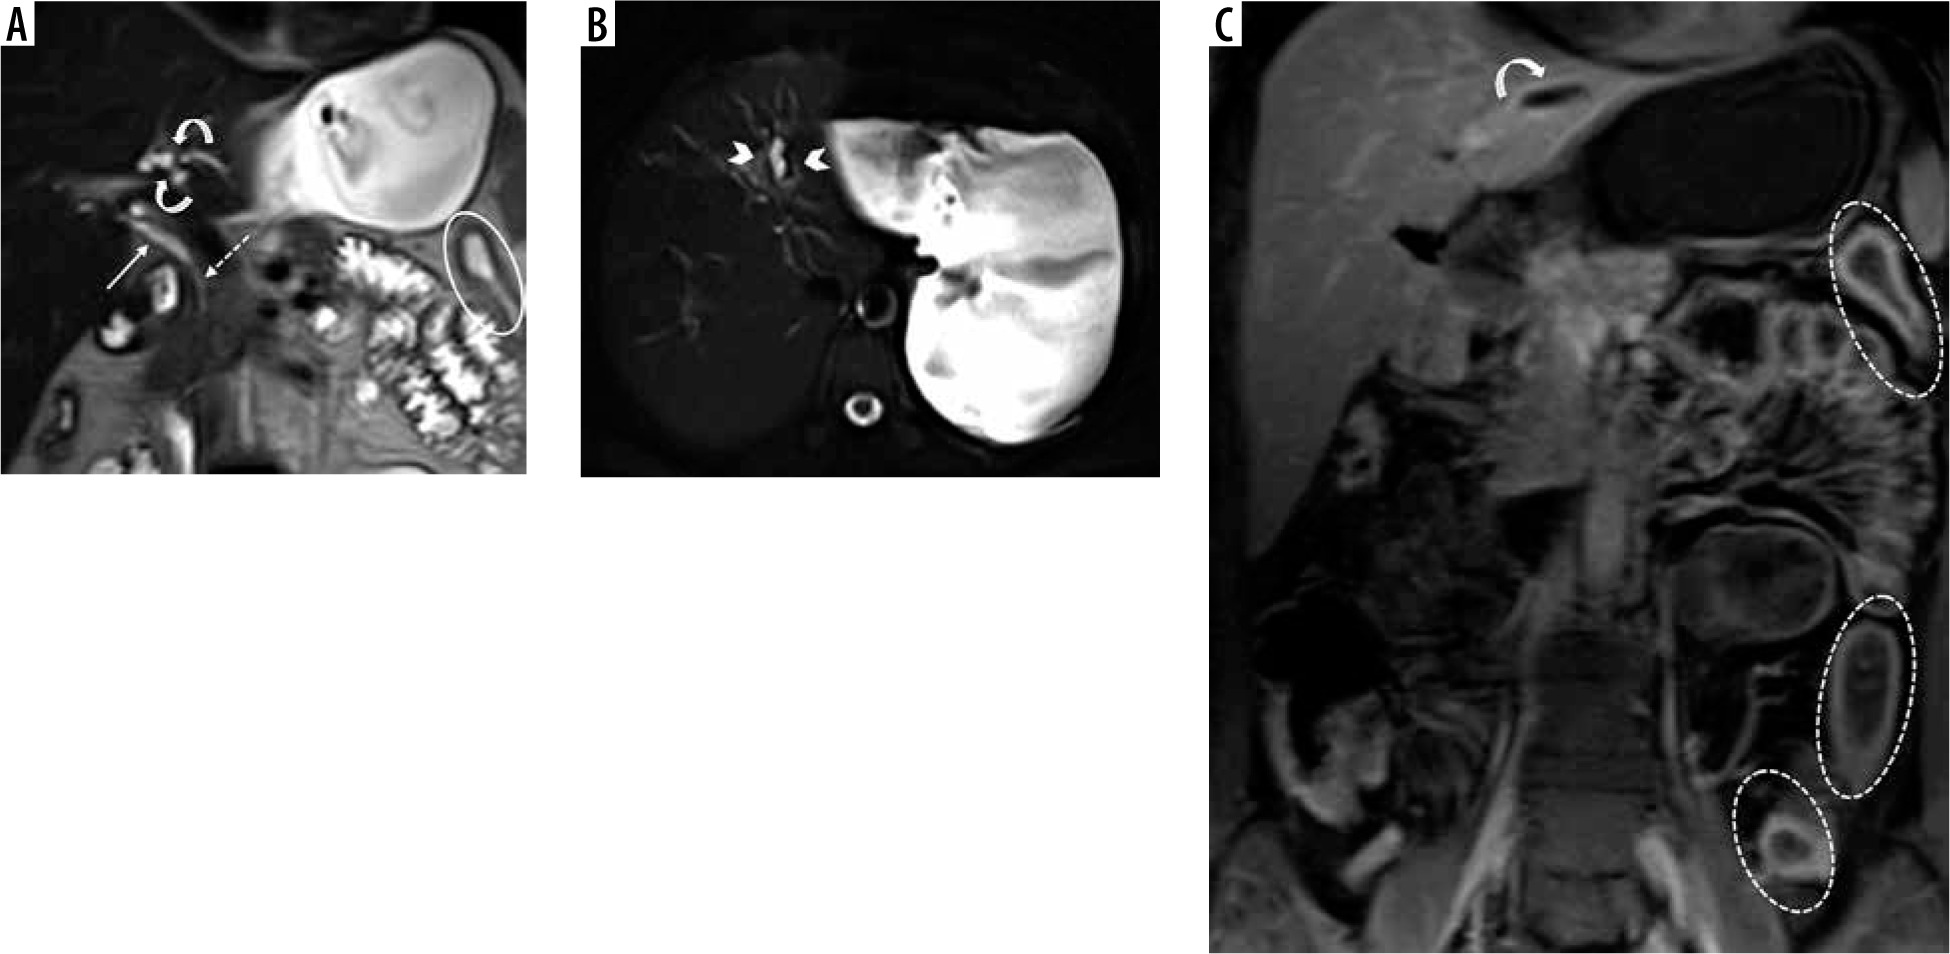
Signs of primary sclerosing cholangitis in intra- and extrahepatic bile ducts in a 50-year-old female patient with Crohn’s disease (CD) at magnetic resonance enterography. A) Coronal T2-weighted HASTE sequence shows mild mural thickening and irregularity in CHD (thin arrow) along with luminal narrowing in common biliary duct (dotted arrow). There is also mild focal dilatation of ducts in segment 4 with low-grade strictures (curved arrows). B) Axial fat-suppressed T2-weighted HASTE sequence displays focal dilatation of intrahepatic bile duct in segment 2 with mild peribiliary T2 hyperintensity (arrowheads). C) Coronal post-contrast T1-weighted VIBE sequence shows mural thickening and enhancement (curved arrow) in the dilated duct of segment 2 (thick arrow). Segmental circumferential mural thickening (oval) and hyper enhancement (dotted ovals) are seen in left colon secondary to CD colitis with active pattern
Peribiliary T2-weighted hyperintensities were observed in 48% of the IBD-PSC patients, significantly higher than the other groups. Moreover, peribiliary contrast enhancement was detected in 35% of IBD-PSC patients, while it was absent in HC and IBD patients free of PSC (p < 0.001).
Table 3
Frequency of pathological findings on magnetic resonance enterography
Diagnostic value of findings on magnetic resonance enterography
Table 4 depicts the diagnostic value of findings on MRE that differed between the PSC and other groups. Detection of biliary irregularities, with a specificity of 94% (95% CI: 82-99%), a sensitivity of 91% (72% to 99%), and a positive likelihood ratio (PLR) of 14.0 (95% CI: 4.7-42.1%), followed by detection of biliary thickening, with a specificity of 94% (82% to 99%), a sensitivity of 78% (56% to 93%), and a PLR of 12 (3.9 to 36.6), had the highest sensitivity for the PSC diagnosis. ROC analysis showed an area under the curve (AUC) of 0.72 (0.59 to 0.86) (p = 0.001) for CHD and 0.76 (0.62 to0.89) (p < 0.001) for periportal fat thickness. The optimal cut-off point of CHD was 4.5 mm with a specificity of 87% (74% to 95%) and a sensitivity of 52% (31% to 73%). The optimal cut-off point of periportal fat thickness was 5.5 mm with a specificity of 74% (59% to 86%) and a sensitivity of 78% (56% to 93%).
Table 4
The diagnostic value of magnetic resonance enterography findings in detection of primary sclerosing cholangitis
Discussion
To the best of our knowledge, this is the first investigation of the clinical significance of hepatobiliary findings related to PSC on MRE examination of IBD patients. We reported that biliary irregularities and thickening, IHBD dilation, increased diameter of CHD and periportal fat thickness, and peribiliary hyperintensities and hyperenhancement could be reliable indicators of PSC on MRE examination of IBD patients with a moderate to high specificity and PLR.
Extraintestinal incidental findings were observed in nearly 20-40% of MRE scans, and approximately 20-50% of these findings were clinically significant [20,21]. Hepatic complications comprise the majority of extraintestinal findings [22]. However, the clinical significance of the findings associated with PSC has been scarcely reported, if at all. In a review of 459 MRE scans, ovarian cysts followed by renal cysts were the most common extraintestinal incidental findings [21]. In a recent investigation, hepatic angioma, hepatic cyst, gallstones, and splenomegaly were observed in 25%, 20%, 14.3%, and 4.2% of cases, respectively, on MRE scans [20]. The findings that can be potentially associated with PSC might have been underestimated in MRE examinations. This can be partially due to the fact that, similarly to the samples of the mentioned studies, the majority of patients undergoing MRE are diagnosed with CD because MRE is optimized for assessment of the small intestine. However, several important points should be noted. First, while PSC is more frequent in patients with UC (5-8%) than in those with CD (3%), compared to the general population, CD patients still have a higher risk of PSC development. Second, in some cases, UC and CD may present similarly, and they may not be distinguishable (indeterminate colitis or IBD unclassified). In these cases, MRE can aid in excluding small bowel disease and other pathologies [23]. Third, even in known cases of UC, MRE can help in determining disease activity and extent, and may detect extra-intestinal manifestations [23]. Notably, a recent meta-analysis showed high specificity for MRE in detecting colon pathologies [24].
Imaging is a crucial tool in the diagnosis of PSC, with MRCP being the modality of choice. Bile duct pathologies described as multiple randomly distributed annular strictures and dilation proximal to the strictures are the most prominent imaging findings of PSC. MRI enables the investigation of ductal and parenchymal abnormalities in PSC [8]. Recently, the International Primary Sclerosing Cholangitis Study Group developed reporting standards for PSC using MRI and MRCP [25]. We observed a higher frequency of IHBD irregularities than EHBD irregularities. Notably, IHBD dilation, stenosis, beading, EHBD stenosis, wall enhancement, and thickening are the most common manifestations of PSC on MRCP in order of frequency [7]. Compared with the previous reports, we had a lower frequency of some pathological findings, such as IHBD dilation (48% versus 77%) [15]. This finding is to be expected because MRE is not optimized for detecting hepatic pathologies, and it only provides a limited window for viewing the hepatobiliary system. Therefore, it should be remembered that this study aimed to assess the specificity of the positive findings and not the sensitivity of MRE findings for PSC. Undoubtedly, MRE cannot act as sensitive means of diagnosis for PSC. Moreover, bile duct stricture is not highly specific for PSC, and secondary sclerosing causes may have similar manifestations [26].
Furthermore, we found increased periportal fat thickness and splenomegaly, which results from portal hypertension, both of which can be early indicators of cirrhosis. Accordingly, findings suggestive of cirrhosis, including enlargement of the caudate and left liver lobes, atrophy of the right liver lobe, and nodular liver parenchyma, in addition to signs of portal hypertension, such as splenomegaly, collateral vessels, and ascites, are among the common MRI findings of PSC [7,8]. Notably, hepatobiliary pathologies were more common in the left liver lobe. This finding highlights the importance of careful observation of the axial view, in which the left lobe can be better assessed.
We observed peribiliary T2-weighted hyperintensity in almost half of the IBD-PSC cases. Parenchymal and periportal oedema and hyperperfusion resulting from inflammation and impaired lymphatic and venous drainage of the portal triads can lead to T2-weighted hyperintensity [8]. Previous studies also reported high T2-weighted signal intensity on MRCP scans in 40-68% of patients [15,27]. Furthermore, we reported peribiliary hyperenhancement in approximately one-third of PSC-IBD patients, which can be due to increased blood circulation due to inflammation, and this was also previously reported in PSC [15].
PSC is associated with IBD in more than two-thirds of cases [4]. Nearly 80% of PSC-IBD cases suffer from UC [28]. On the other hand, only 5-10% of patients with colitis are diagnosed with PSC [1]. The temporal association of PSC and IBD is usually unpredictable. Importantly, IBD associated with concomitant PSC is distinctive from IBD alone. The former group has a younger age at diagnosis, increased male predominance, higher rates of pancolitis, rectal sparing, and backwash ileitis, increased risk of colorectal cancer, and milder clinical course [29]. Nonetheless, whether PSC associated with IBD is distinctive from PSC alone is less elucidated. However, a higher risk of liver progression is reported in patients with concomitant UC compared to patients with CD or no IBD [30]. Notably, total colectomy before or within liver transplant significantly reduced the risk of PSC reoccurrence, indicating a critical role for the gut-liver axis in the disease pathogenesis [31]. Accordingly, a recent 2-sample Mendelian randomization analysis found a causal effect for IBD (both UC and CD) on PSC [32].
An interplay of genetic and environmental factors plays a key role in disease pathogenesis, with environmental factors potentially accounting for more than 50% of the risk. While the exact pathophysiology of PSC is still unknown, the immune-mediated hypothesis is one of the most accepted notions [33]. The gut microbiome is postulated to have a pathogenetic role in PSC. In addition to the immune activation induced by intestine-derived antigens, the IBD itself can activate the immune cells. The microbial exposure, together with the failure of natural antimicrobial defence in the biliary tree, can lead to antimicrobial responses in the liver, which progress into autoinflammation later. The chronic hepatic injury triggers activation of hepatic satellite cells and portal myofibroblasts, resulting in scar formation and fibrosis around the affected bile duct, causing biliary stricture.
This study has some limitations. First, the sample size of each group was relatively small; however, the frequency of PSC in known IBD cases undergoing MRE is not high even in referral bowel imaging centres. Due to the small sample size, we were not able to assess the odds ratio of the presence of a PSC diagnosis in patients with IBD and hepatic abnormalities on MRE using multivariate regression models. Second, the IBD-PSC group and the IBD without PSC group were not identical in the proportion of IBD subtypes. This is to be expected because most patients undergoing MRE are diagnosed with CD, while most PSC patients suffer from UC. Third, diffusion-weighted images as a useful sequence could not be incorporated in this study because this sequence, which is routinely performed in axial view at our centre, does not appropriately cover the intrahepatic bile ducts. Fourth, this study might be subject to selection bias because only patients who either had hepatobiliary abnormalities in their MRE report or had undergone MRCP in addition to MRE in our centre were assessed as to whether they met the inclusion criteria for the IBD-PSC group. Lastly, the MRE protocol applied in our centre includes colonic preparation one day prior to the exam, which is not widely performed in other centres. This can help to assess the small bowel and colon in one session and accelerate gastric emptying during oral fluid ingestion at the start of the exam. Further studies with larger sample sizes and prospective designs can help elucidate the clinical significance of these findings in IBD patients.
Conclusions
This is the first study focusing on the significance of the hepatobiliary findings on MRE in IBD. We showed that hepatobiliary pathologies reported on MRE were significantly associated with the IBD-PSC phenotype, while their absence does not rule out PSC. This finding emphasizes the importance of assessing and reporting abnormalities of the liver section while reviewing MRE scans of patients with IBD. However, the results should be interpreted cautiously because our study had a small size that may increase the risk of bias.