ISSN: 1899-0967
Polish Journal of Radiology
Established by prof. Zygmunt Grudziński in 1926 Sun
Current issue Archive Manuscripts accepted About the journal Editorial board Abstracting and indexing Contact Instructions for authors Ethical standards and procedures
Editorial System
Submit your Manuscript
SCImago Journal & Country Rank
1/2019
vol. 84
 
Share:
Share:
Gastrointestinal and abdominal radiology
Original paper

The efficacy of new oral contrast mixture for computed tomography enterography

Şehnaz Evrimler
1
,
Gökhan Ocakoğlu
2
,
Oktay Algin
3

1.
Suleyman Demirel University, Faculty of Medicine, Department of Radiology, Isparta, Turkey
2.
Uludag University, Faculty of Medicine, Department of Biostatistics, Bursa, Turkey
3.
Yildirim Beyazıt University, Faculty of Medicine, Department of Radiology, Ankara, Turkey
© Pol J Radiol 2019; 84: e403-e412
Online publish date: 2019/10/15
Article file
Get citation
 
PlumX metrics:
 

Introduction

Computed tomography enterography (CTE) is an imaging technique, developed for assessing small bowel diseases. CTE is based on obtaining intravenous contrast-material enhanced abdominopelvic computed tomography (CT) images after oral contrast agent (OCA) administration for optimal small bowel distension and bowel tissue discrimination [1]. The advantages of this technique are being non-invasive, enabling high-resolution images, and the evaluation of both enteric and extra-enteric structures [2]. CTE is a more cost-effective imaging method, which provides faster imaging with higher spatial and temporal resolution than magnetic resonance elastography (MRE). Another superiority of CTE to MRE is the ability of luminal navigation. Indications are diagnosis and follow-up of inflammatory bowel diseases, diarrhoea, gastrointestinal tract bleeding, small bowel obstruction, neoplasm, polyposis syndromes, or radiation enteritis [3,4]. Inadequate bowel distension can result in misdiagnoses, such as; wall thickening, abnormal mural enhancement, or obscuring of intra-luminal lesions [3,5,6]. Polyethylenoglycol (PEG), water, methylcellulose, mannitol, and low-concentration barium with sorbitol have been studied as OCAs for CTE in literature [1-4]. However, water cannot provide optimal luminal distension because of rapid absorption, and other OCAs can cause adverse effects like diarrhoea, spasm, nausea, and vomiting. Which OCAs should be used for CTE to obtain adequate luminal distension with the least adverse effect is still controversial. Therefore, we developed a new mixture of OCA, showing characteristics of both negative and positive agents, which was composed of water, methylcellulose, lactulose, locust bean gum, and sorbitol. The aim of this study was to show the characteristics of the new mixture and to compare the luminal distension and radiological confidence of the solution with the water-lactulose mixture.

Material and methods

CTE images from a three-year period (performed between 2013 and 2016) were included in our institutional review board-approved, retrospective study after informed consent was obtained. Inclusion criteria were the evaluation of diarrhoea, gastrointestinal (GI) tract bleeding, inflammatory bowel disease, coeliac disease, or small bowel tumour. Exclusion criteria were an allergy to contrast materials, renal insufficiency, pregnancy, claustrophobia, galactose intolerance, GI tract obstruction, and paediatric age. Ninety-one patients drank lactulose-water mixture (Group 1), and 54 patients drank the new mixture (Group 2). Patients were assigned to the groups in random order.

Imaging protocol and preparation of the oral contrast agents

A bowel cleansing diet and 50 ml laxative diet solution (X-M diet solution, Yenisehir Laboratory, Ankara, Turkey) were administered to the patients the night before and on the morning of the examination. All patients were asked to drink a total of 1500 ml of OCA in 50 minutes – 300 ml every 10 minutes. In patients with suspicious low/moderate-grade small bowel obstruction, extra-intestinal fluid collection, fistulae, or radiation enteritis the OCA was mixed with 40 ml Iopromide (Ultravist, Schering, Germany) in addition to the other substances, for both of the groups.

The patients in Group 1 drank 1500 ml of OCA, composed of 200 ml (670 mg/ml) lactulose and 1300 ml water. The patients in Group 2 drank a total of 1500 ml mixture of water with 10 g hydroxypropyl-methylcellulose, 10 g lactulose, 5 g locust bean gum, and 5 g sorbitol. Although the ingredients of the mixture are well known OCAs, as far as we know they have not been used in this combination before.

Patients who drank the OCA were taken to a 64-detector row multiple detector computed tomography (MDCT) machine (Aquilion 64, Toshiba, Tokyo, Japan). Images were obtained from the level of the diaphragm to the level of the symphysis pubis, in the enteric phase (60 seconds) after the intravenous administration of 100 ml of Iopromide (Ultravist, Schering, Germany) at a flow rate of 3 ml/s. Multiphasic CTE was performed for occult GI tract bleeding. In order to decrease the intestinal motility, a spasmolytic agent, 20 mg of hyoscine-N-butylbromide (Buscopan, Boehringer Ingelheim Ltd, Bracknell, UK), was given intravenously immediately before the scanning. Images were obtained with 2 mm slice thickness and reconstructed in 1 mm slice thickness. Coronal and sagittal reformatted images were also formed.

Image analysis

CTE images were evaluated by two radiologists (O.A., S.E.) independently. The second observer also evaluated the same data three weeks later for the intra-observer statistics. They were blinded to the pre-diagnosis, clinical, and laboratory findings of the patients. The authors were also blinded as to which contrast agent was used. They had not seen the images before the study.

The GI tract was divided into 11 segments for scoring, as follows: stomach, duodenum, jejunum, ileum, ileocecal area, cecum, ascending colon, transverse colon, descending colon, sigmoid colon, and rectum. Each segment was graded for distension and radiological confidence. Grading of luminal distension was as follows: score 0, collapsed segment; score 1, poor distension; score 2, moderate distension; score 3, good distension. Radiological confidence is the opinion of the observer about whether the lumen and wall of the GI segment can be evaluated with confidence in regard to the luminal distension and technical aspects. Grading of radiological confidence was scored as 0: poor, 1: good, 2: excellent.

Statistical analysis

Age values were reported as median (minimum: maximum) values and compared between groups using the Mann- Whitney U test. Raters’ scores were compared between groups by using the Pearson χ2 test and Freeman-Halton test. A weighted kappa (κ) statistic with 95% confidence intervals was calculated for assessment of inter-reader and intra-reader reliability. Kappa coefficient less than 0.20 was interpreted as poor agreement, 0.21 to 0.40 as fair agreement, 0.41 to 0.60 as moderate agreement, 0.61 to 0.80 as good agreement, and 0.81 to 1.00 as very good agreement [7]. SPSS software version 20.0 was used for performing statistical analysis. Statistically, significance was set at p < 0.05.

Results

The demographic characteristics of the patients were as follows; the median age of Group 1 and 2 was 53.50 (18-84) and 50.50 (22-84), respectively. Fifty-five patients were male (61.1%) and 35 were female (38.9%) in Group 1. Thirty-six of patients were male (64.8%) and 19 were female (35.2%) in Group 2. There was no significant difference between the groups in terms of age (p = 0.184) and gender (p = 0.657).

Inflammatory bowel disease was detected in 13 patients, four of them had an enteric fistula, and one of them had a perianal fistula. GI tract tumour was detected in 12 patients. One of them was histopathologically diagnosed with FAP-associated desmoid tumour. A postoperative fistula between neobladder-ileum was depicted in a patient, whose CTE was performed for postoperative imaging.

Five patients could not drink all of the mixture because of nausea or the taste of the mixture, and two patients had diarrhoea in Group 1. Three patients could not drink all of the mixture because of nausea or the taste of the mixture, one patient vomited, and two patients had diarrhoea in Group 2. In general, the tolerability of the mixture was high. These adverse effects regressed within 24 h.

In general, inter-reader reliabilities of distension and for radiological confidence scores were moderate or good for both groups and gastrointestinal segments (p < 0.001, Table 1; Figures 1 and 2). Lower agreement values were detected for duodenum and jejunum scores. At the same time, the best κ values were obtained in sigmoid colon assessments (Table 1).

Table 1

Inter-reader reliabilities of distension and radiological confidence scores for the groups

DistensionRadiological confidence
Rater 1 – rater 2Rater 1 – rater 2
κ95% CIpκ95% CIp
Group 1 (n = 91)
Stomach0.620.48-0.76< 0.0010.840.67-1.00< 0.001
Duodenum0.590.46-0.73< 0.0010.680.53-0.83< 0.001
Jejunum0.520.39-0.65< 0.0010.610.47-0.75< 0.001
Ileum0.470.35-0.60< 0.0010.610.46-0.75< 0.001
Ileocecal area0.610.47-0.74< 0.0010.530.39-0.67< 0.001
Cecum0.730.58-0.87< 0.0010.750.59-0.91< 0.001
Ascending colon0.730.59-0.86< 0.0010.900.75-1.00< 0.001
Transverse colon0.690.56-0.82< 0.0010.900.75-1.00< 0.001
Descending colon0.750.60-0.89< 0.0010.850.69-1.00< 0.001
Sigmoid0.910.76-1.00< 0.0010.900.72-1.00< 0.001
Rectum0.880.73-1.00< 0.0010.910.75-1.00< 0.001
Group 2 (n = 54)
Stomach0.910.69-1.00< 0.0010.600.43-0.77< 0.001
Duodenum0.440.27-0.62< 0.0010.450.30-0.60< 0.001
Jejunum0.460.28-0.64< 0.0010.630.43-0.82< 0.001
Ileum0.640.45-0.84< 0.0010.690.45-0.83< 0.001
Ileocecal area0.220.03-0.420.0130.660.46-0.87< 0.001
Cecum0.370.17-0.56< 0.0010.490.30-0.69< 0.001
Ascending colon0.460.29-0.63< 0.0010.700.48-0.92< 0.001
Transverse colon0.590.42-0.76< 0.0010.770.55-0.99< 0.001
Descending colon0.710.53-0.90< 0.0010.890.66-1.00< 0.001
Sigmoid0.790.60-0.97< 0.0010.950.72-1.00< 0.001
Rectum0.720.52-0.92< 0.0010.860.63-1.00< 0.001
Figure 1

Computed tomography enterography (CTE), obtained with lactulose and water the new mixture, in a 66-year-old woman with elevated CEA levels and abdominal pain. In this patient, magnetic resonance elastography examination was not performed due to lumbar level metallic screws, and therefore CTE was performed. There is no abnormality in bowels or mesentery. Distension and radiological confidence scores were good to moderate for all segments

/f/fulltexts/PJR/38575/PJR-84-38575-g001_min.jpg
Figure 2

Computed tomography enterography, obtained with the new mixture, in a 65-year-old man with abdominal discomfort. These images reveal no abnormalities within the GIS or in the adjacent mesentery. Bowel wall thicknesses are normal, and there are good to excellent distention scores for all segments

/f/fulltexts/PJR/38575/PJR-84-38575-g002_min.jpg

According to distension scores of reader 1, Group 2 showed better results in all of the segments than Group 1, except for the duodenum, where no significant difference was observed between the groups (Table 2). The confidence scoring of the reader also showed similar results. The new mixture was more successful in all of the segments except for the duodenum and jejunum, where no significant difference was observed between the groups (Table 3, Figure 3).

Table 2

Distension scores of rater 1

Distension – rater 1CollapsedModerateGoodExcellentp-value
StomachGroup 1 (n = 90)5 (5.6)11 (12.2)28 (31.1)46 (51.1)0.007
Group 2 (n = 52)1 (1.9)1 (1.9)9 (17.3)41 (78.8)
DuodenumGroup 1 (n = 83)20 (24.1)31 (37.3)27 (32.5)5 (6)0.124
Group 2 (n = 53)8 (15.1)28 (52.8)11 (20.8)6 (11.3)
JejunumGroup 1 (n = 91)16 (17.6)39 (42.9)27 (29.7)9 (9.9)0.043
Group 2 (n = 53)2 (3.8)27 (50.9)14 (26.4)10 (18.9)
IleumGroup 1 (n = 91)9 (9.9)49 (53.8)24 (26.4)9 (9.9)< 0.001
Group 2 (n = 53)0 (0)14 (26.4)22 (41.5)17 (32.1)
Ileocecal areaGroup 1 (n = 89)15 (16.9)37 (41.6)22 (24.7)15 (16.9)< 0.001
Group 2 (n = 46)0 (0)5 (10.2)13 (26.5)31 (63.3)
CecumGroup 1 (n = 90)6 (6.7)55 (61.1)12 (13.3)17 (18.9)< 0.001
Group 2 (n = 48)0 (0)2 (4.2)8 (16.7)38 (79.2)
Ascending colonGroup 1 (n = 91)11 (12.1)57 (62.6)8 (8.8)15 (16.5)< 0.001
Group 2 (n = 48)2 (4.2)3 (6.3)11 (22.9)32 (66.7)
Transverse colonGroup 1 (n = 91)24 (26.4)44 (48.4)14 (15.4)9 (9.9)< 0.001
Group 2 (n = 48)4 (8.3)5 (10.4)19 (39.6)20 (41.7)
Descending colonGroup 1 (n = 91)44 (48.4)26 (26.6)14 (15.4)7 (7.7)< 0.001
Group 2 (n = 48)6 (12.5)9 (18.8)20 (41.7)13 (27.1)
SigmoidGroup 1 (n = 85)33 (38.8)31 (36.5)17 (20)4 (4.7)< 0.001
Group 2 (n = 49)6 (12.2)14 (28.6)14 (28.6)15 (30.6)
RectumGroup 1 (n = 84)23 (27.4)40 (47.6)14 (16.7)7 (8.3)< 0.001
Group 2 (n = 48)4 (8.3)10 (20.8)11 (22.9)23 (47.9)

[i] Values expressed as n (%)

Table 3

Radiological confidence scores of rater 1
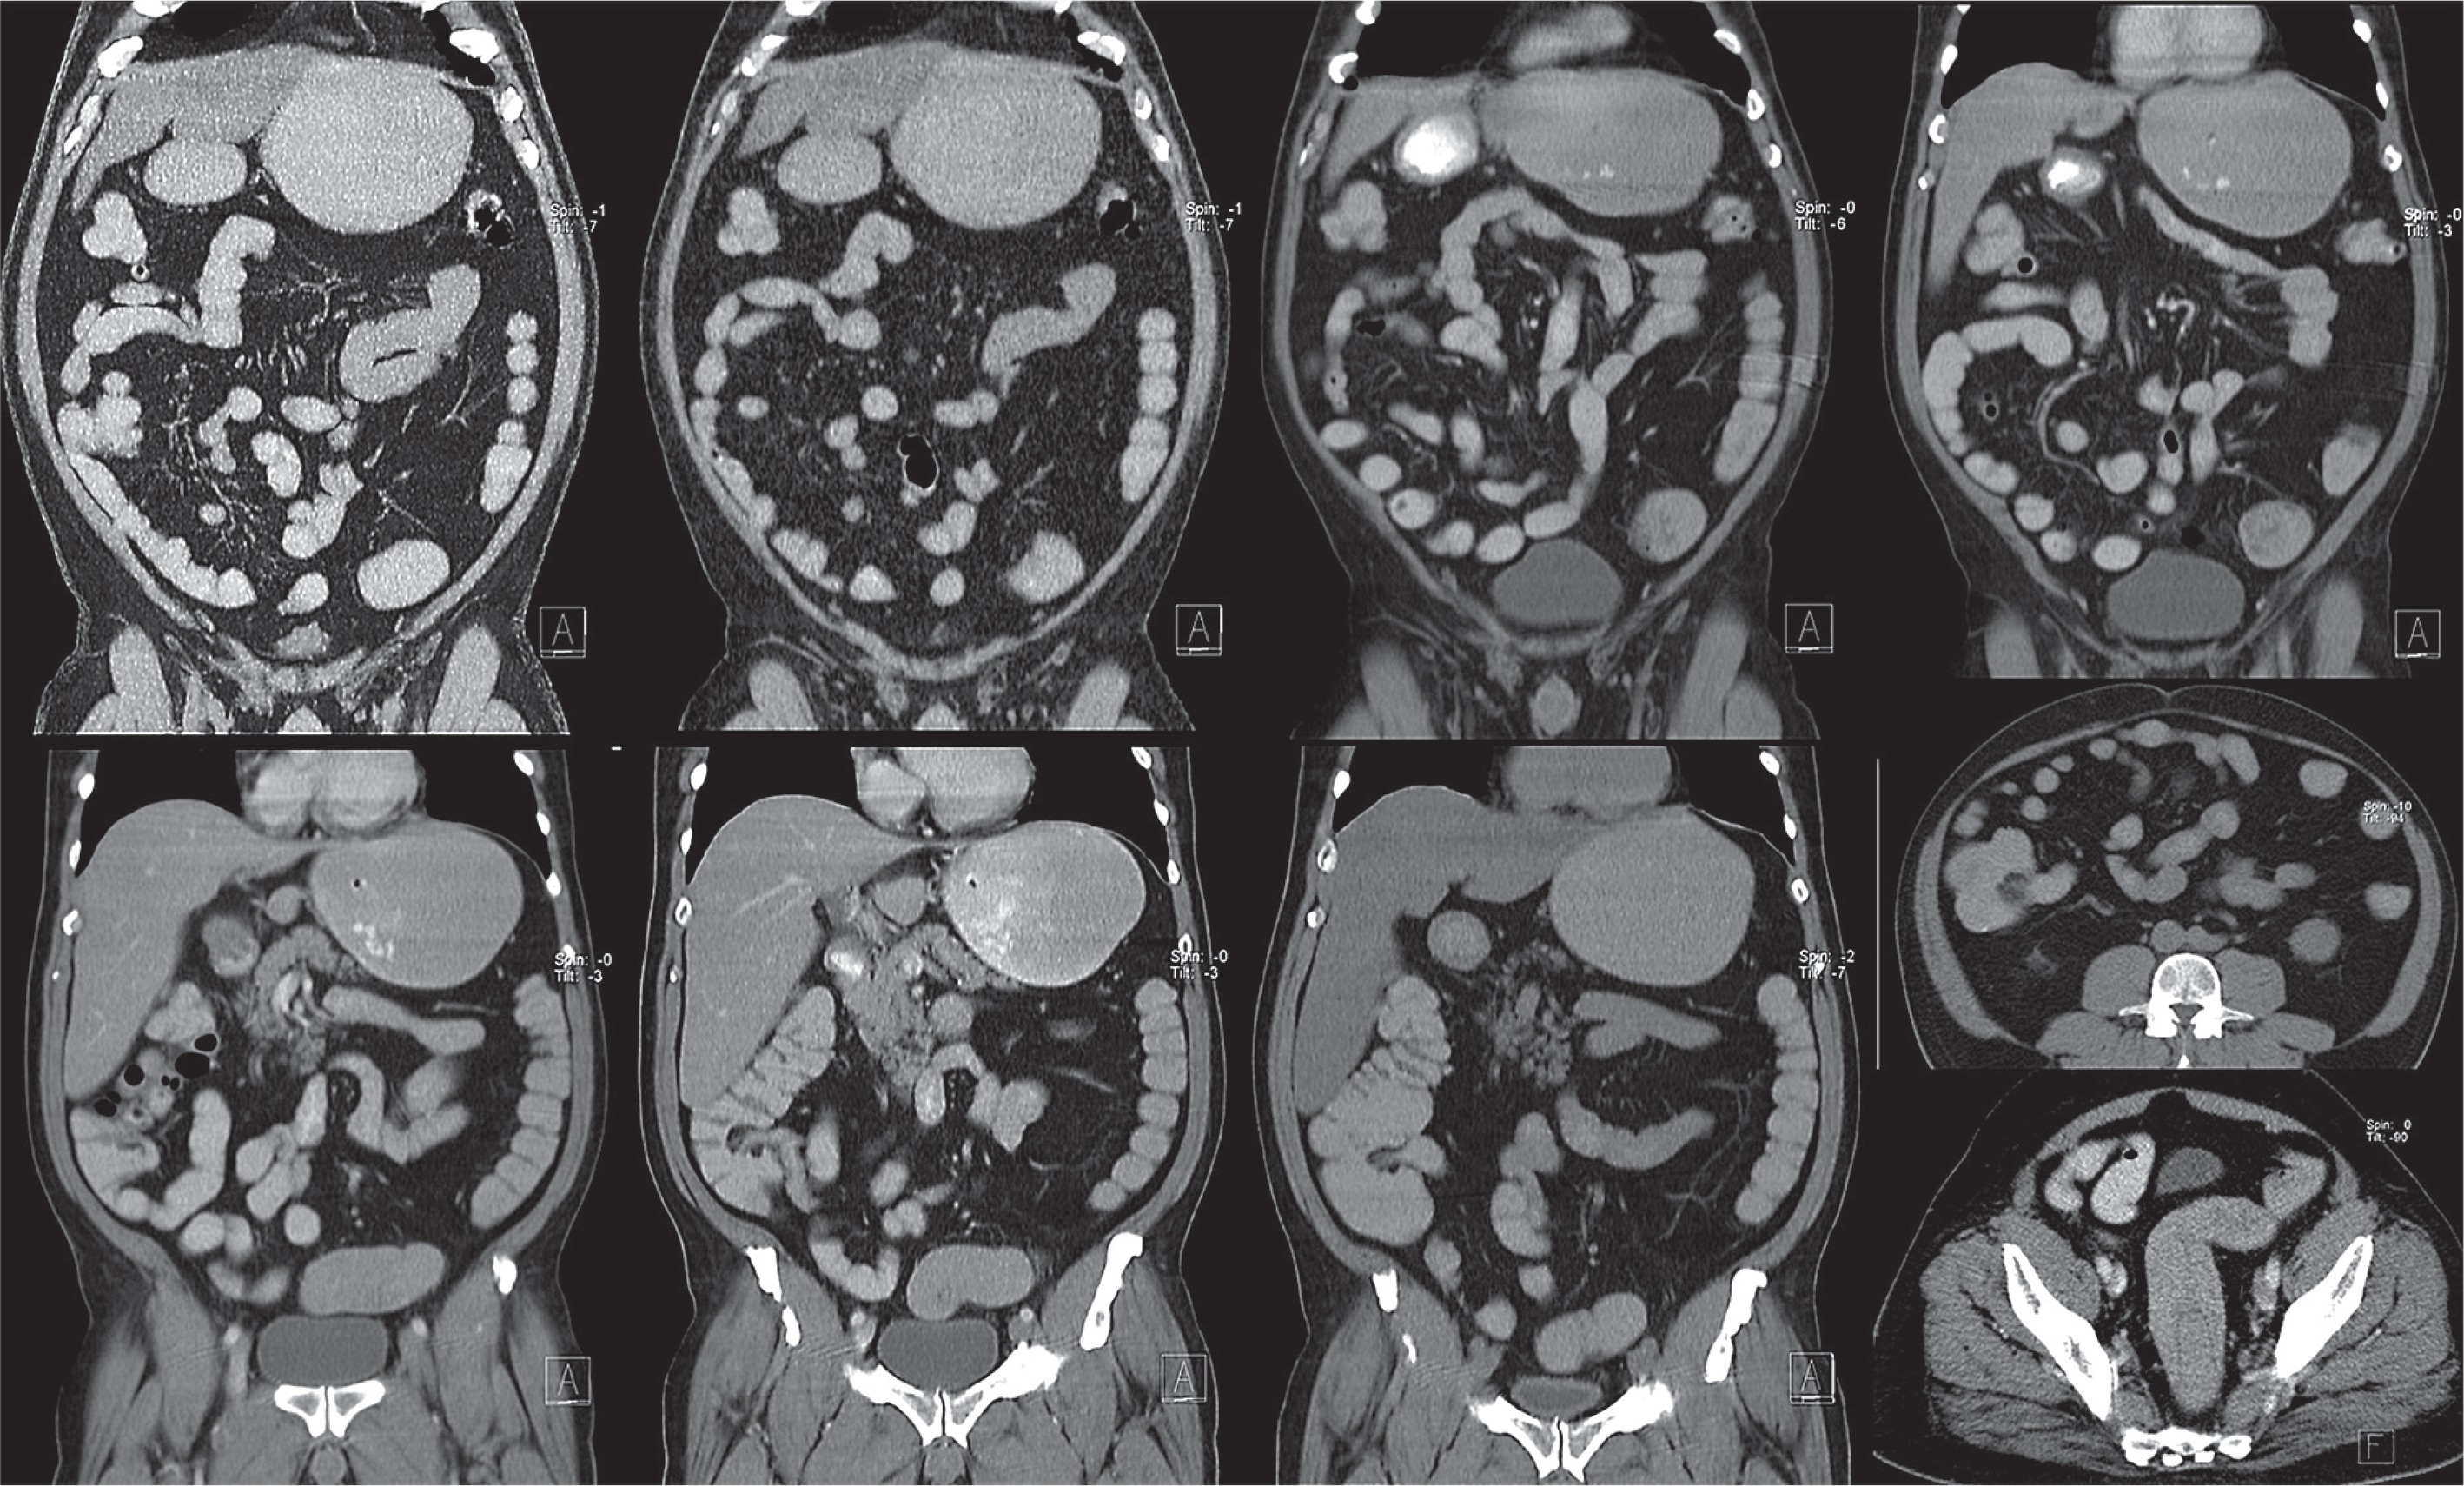
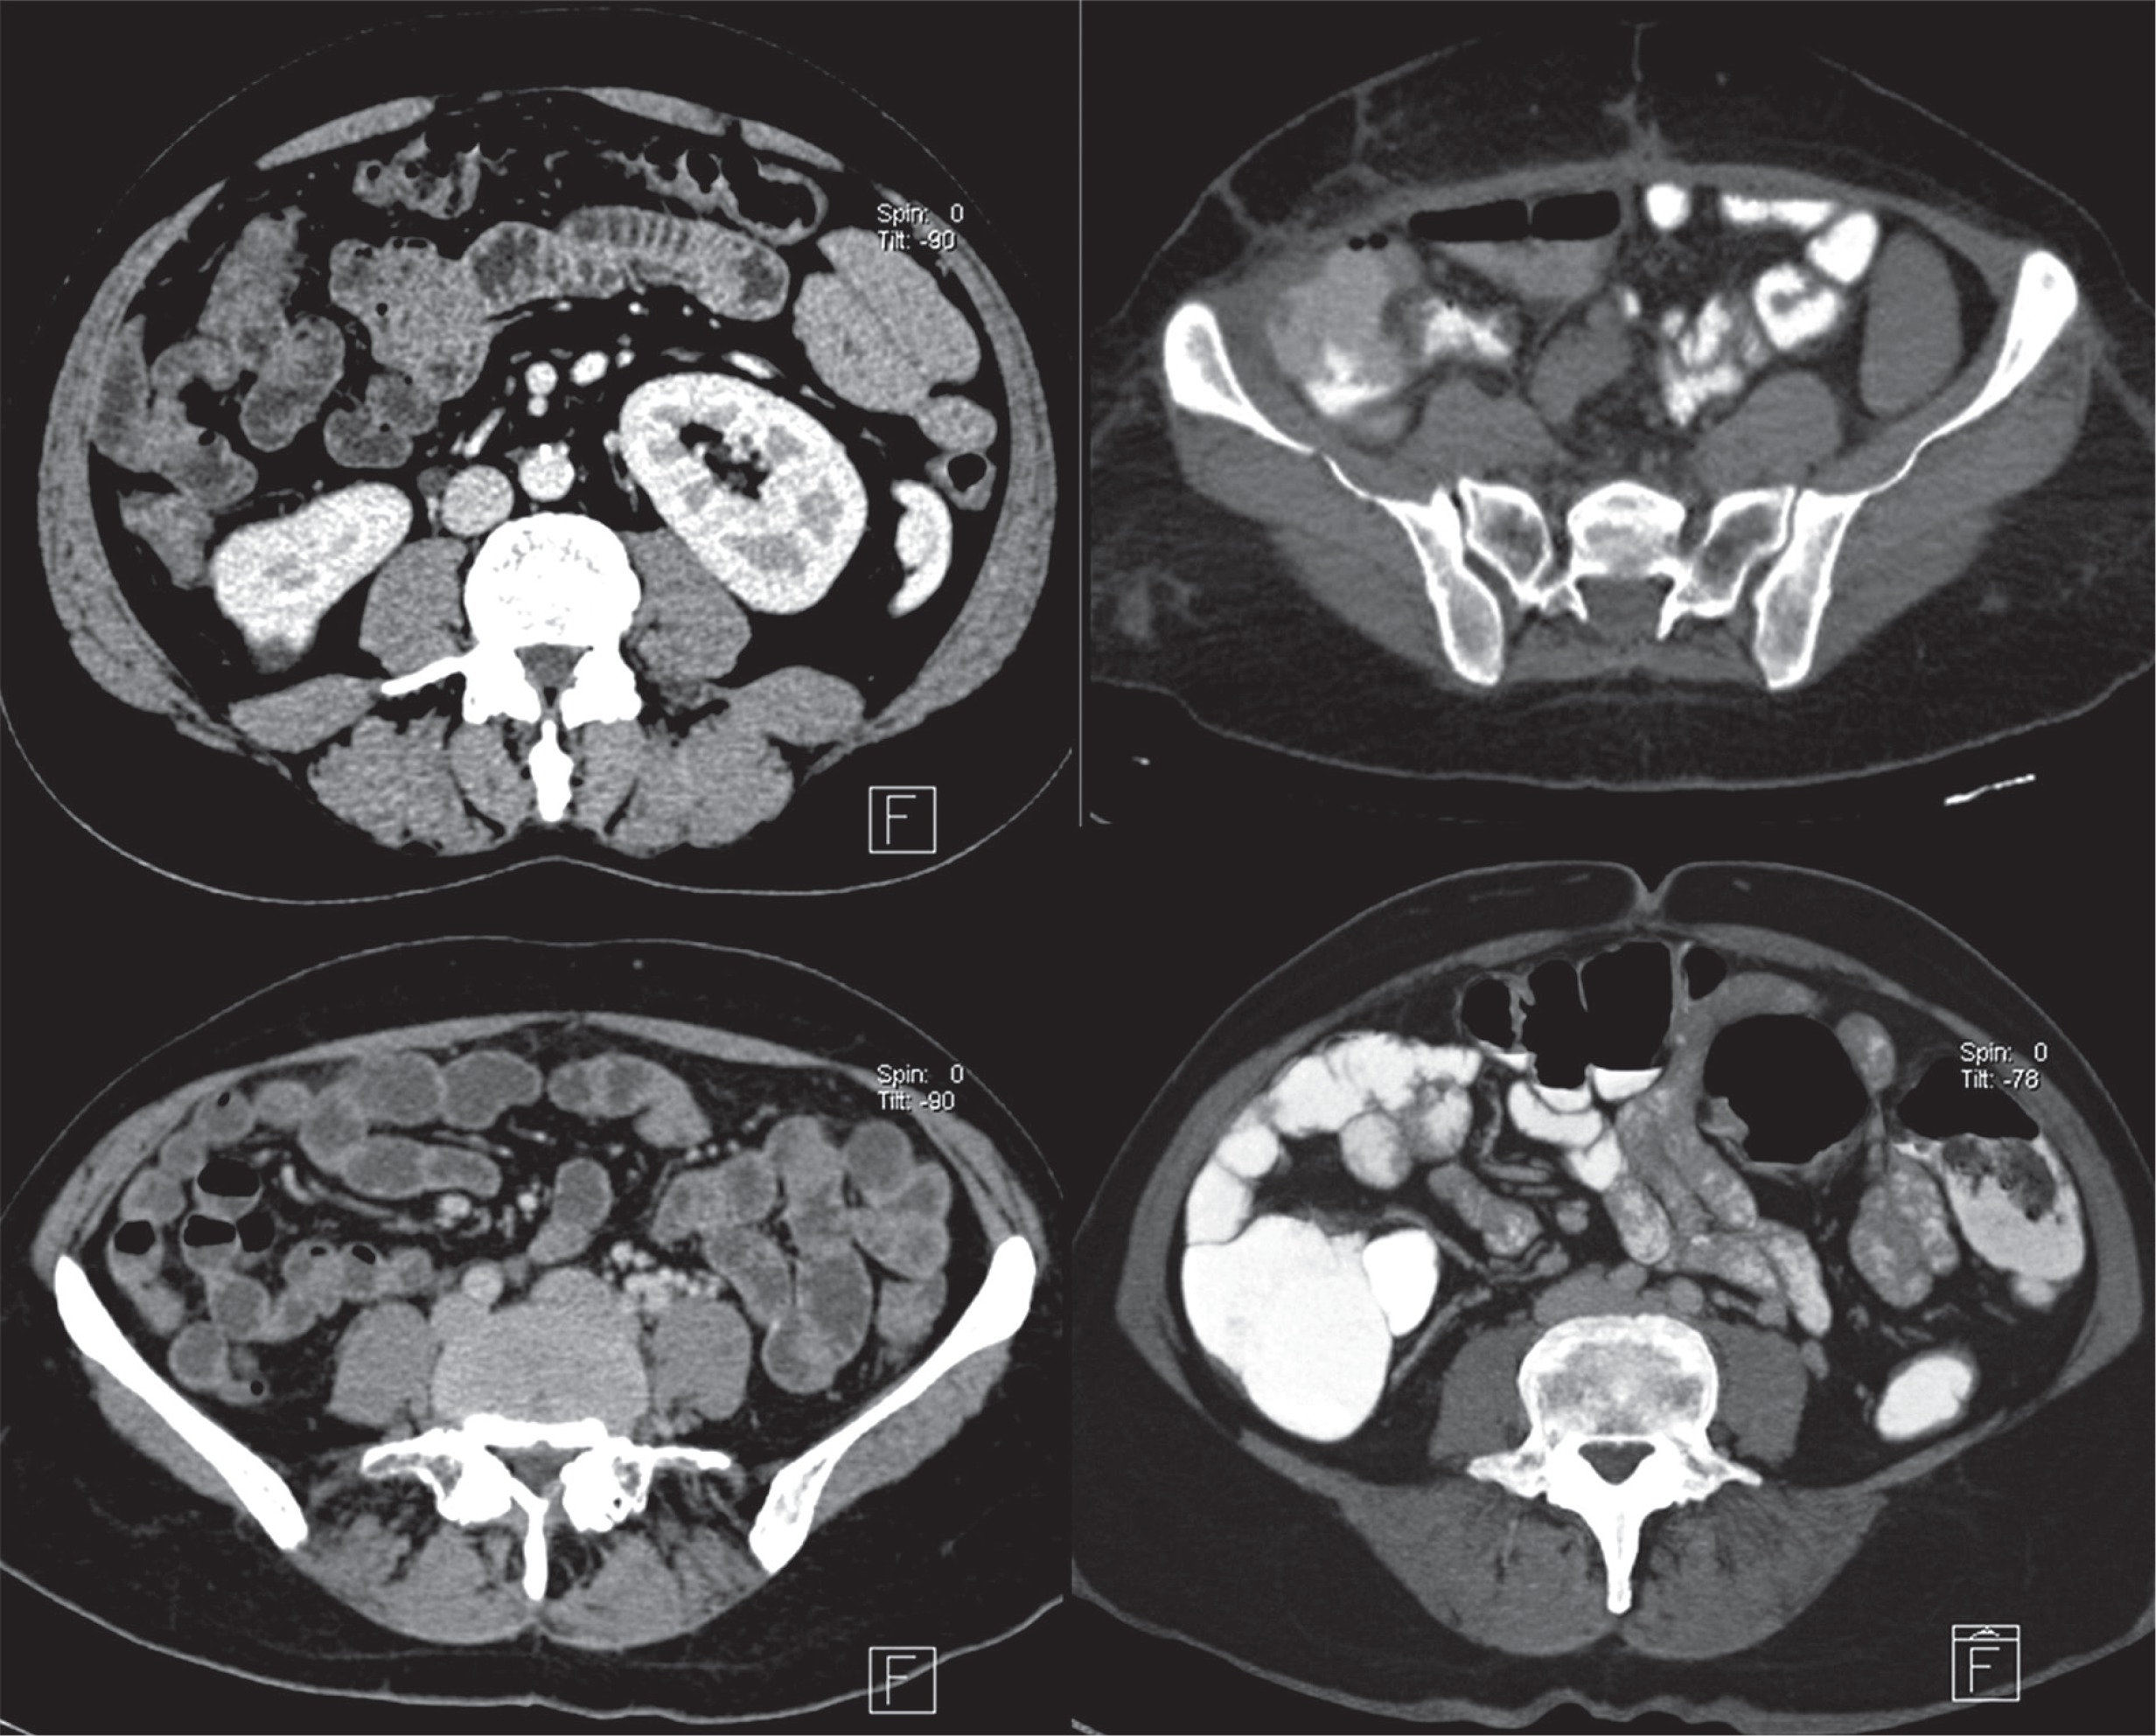
Confidence – rater 1PoorGoodExcellentp-value
StomachGroup 1 (n = 90)7 (7.8)18 (20)65 (72.2)0.014
Group 2 (n = 52)2 (3.8)2 (3.8)48 (92.3)
DuodenumGroup 1 (n = 83)28 (33.7)38 (45.8)17 (20.5)0.743
Group 2 (n = 53)21 (39.6)21 (39.6)11 (20.8)
JejunumGroup 1 (n = 91)22 (24.2)44 (48.4)25 (27.5)0.532
Group 2 (n = 53)10 (18.9)24 (45.3)19 (35.8)
IleumGroup 1 (n = 91)18 (19.8)48 (52.7)25 (27.5)< 0.001
Group 2 (n = 53)1 (1.9)16 (30.2)36 (67.9)
Ileocecal areaGroup 1 (n = 89)22 (24.7)36 (40.4)31 (34.8)< 0.001
Group 2 (n = 49)0 (0)5 (10.2)44 (89.8)
CecumGroup 1 (n = 90)6 (6.7)58 (64.4)26 (28.9)< 0.001
Group 2 (n = 48)0 (0)3 (6.3)45 (93.8)
Ascending colonGroup 1 (n = 91)14 (15.4)59 (64.8)18 (19.8)< 0.001
Group 2 (n = 48)3 (6.3)6 (12.5)39 (81.3)
Transverse colonGroup 1 (n = 91)26 (28.6)49 (53.8)16 (17.6)< 0.001
Group 2 (n = 48)4 (8.3)7 (14.6)37 (77.1)
Descending colonGroup 1 (n = 91)44 (48.4)32 (35.2)15 (16.5)< 0.001
Group 2 (n = 48)6 (12.5)12 (25)30 (62.5)
SigmoidGroup 1 (n = 85)35 (41.2)37 (43.5)13 (15.3)< 0.001
Group 2 (n = 49)6 (12.2)14 (28.6)29 (59.2)
RectumGroup 1 (n = 84)25 (29.8)46 (54.8)13 (15.5)< 0.001
Group 2 (n = 48)4 (8.3)10 (20.8)34 (70.8)

[i] Values expressed as n (%)

Figure 3

Computed tomography enterography images of four different patients. Upper-line images belong to Group 1 (lactulose and water mixture). Lower line images belong to Group 2 (the new mixture). The new mixture seems to be more effective in providing adequate ileal and colonic distention

/f/fulltexts/PJR/38575/PJR-84-38575-g003_min.jpg

Group 2 showed better results than Group 1 for ileum and colonic segments, according to the distension and confidence scorings of reader 2. Although no significant difference was found for the duodenum and jejunum, good distension and confidence agreements were observed for these segments (Table 4).

Table 4

Distension and radiological confidence scores of rater 2

Distension – rater 2CollapsedModerateGoodExcellentp-value
StomachGroup 1 (n = 89)5 (5.6)11 (12.4)26 (29.2)47 (52.8)0.003
Group 2 (n = 52)1 (1.9)1 (1.9)7 (13.5)43 (87.2)
DuodenumGroup 1 (n = 83)5 (6)35 (42.2)38 (45.8)5 (6)0.513
Group 2 (n = 53)1 (1.9)26 (49.1)21 (39.6)5 (9.4)
JejunumGroup 1 (n = 91)5 (5.5)34 (37.4)36 (39.6)16 (17.6)0.403
Group 2 (n = 53)1 (1.9)15 (28.3)28 (52.8)9 (17)
IleumGroup 1 (n = 91)1 (1.1)29 (31.9)52 (57.1)9 (9.9)0.007
Group 2 (n = 53)0 (0)7 (13.2)32 (60.4)14 (26.4)
Ileocecal areaGroup 1 (n = 89)7 (7.9)34 (38.2)41 (46.1)7 (7.9)< 0.001
Group 2 (n = 46)0 (0)1 (2)30 (61.2)18 (36.7)
CecumGroup 1 (n = 90)6 (6.7)41 (45.6)30 (33.3)13 (14.4)< 0.001
Group 2 (n = 48)0 (0)3 (6.3)23 (47.9)22 (45.8)
Ascending colonGroup 1 (n = 91)10 (11)45 (49.5)27 (29.7)9 (9.9)< 0.001
Group 2 (n = 48)2 (4.2)3 (6.3)28 (58.3)15 (31.3)
Transverse colonGroup 1 (n = 91)18 (19.8)42 (46.2)25 (27.5)6 (6.6)< 0.001
Group 2 (n = 48)4 (8.3)5 (10.4)30 (62.5)9 (18.8)
Descending colonGroup 1 (n = 91)34 (37.4)34 (37.4)20 (22)3 (3.3)< 0.001
Group 2 (n = 48)4 (8.3)10 (20.8)27 (56.3)7 (14.6)
SigmoidGroup 1 (n = 85)30 (35.3)33 (38.8)19 (22.4)3 (3.5)< 0.001
Group 2 (n = 49)5 (10.2)14 (28.6)22 (44.9)8 (16.3)
RectumGroup 1 (n = 84)21 (25)42 (50)17 (20.2)4 (4.8)< 0.001
Group 2 (n = 48)3 (6.3)11 (22.9)20 (41.7)14 (29.2)
Confidence – rater 2PoorGoodExcellentp-value
StomachGroup 1 (n = 89)6 (6.7)26 (29.2)57 (64)0.057
Group 2 (n = 52)1 (1.9)8 (15.4)43 (82.7)
DuodenumGroup 1 (n = 83)17 (20.5)51 (61.4)15 (18.1)0.059
Group 2 (n = 53)3 (5.7)39 (73.6)11 (20.8)
JejunumGroup 1 (n = 91)8 (8.8)60 (65.9)23 (25.3)0.409
Group 2 (n = 53)2 (3.8)34 (64.2)17 (32.1)
IleumGroup 1 (n = 91)7 (7.7)64 (70.3)20 (22)< 0.001
Group 2 (n = 53)0 (0)25 (47.2)28 (52.8)
Ileocecal areaGroup 1 (n = 89)10 (11.2)62 (69.7)17 (19.1)< 0.001
Group 2 (n = 49)0 (0)11 (22.4)38 (77.6)
CecumGroup 1 (n = 90)9 (10)60 (66.7)21 (23.3)< 0.001
Group 2 (n = 48)0 (0)9 (18.8)39 (81.3)
Ascending colonGroup 1 (n = 91)13 (14.3)62 (68.1)16 (17.6)< 0.001
Group 2 (n = 48)2 (4.2)14 (29.2)32 (66.7)
Transverse colonGroup 1 (n = 91)23 (25.3)55 (60.4)13 (14.3)< 0.001
Group 2 (n = 48)4 (8.3)15 (31.3)29 (60.4)
Descending colonGroup 1 (n = 91)41 (45.1)40 (44)10 (11)< 0.001
Group 2 (n = 48)5 (10.4)16 (33.3)27 (56.3)
SigmoidGroup 1 (n = 85)35 (41.2)41 (48.2)9 (10.6)< 0.001
Group 2 (n = 49)6 (12.2)16 (32.7)27 (55.1)
RectumGroup 1 (n = 84)23 (27.4)51 (60.7)10 (11.9)< 0.001
Group 2 (n = 48)3 (6.3)13 (27.1)32 (66.7)

[i] Values were expressed as n (%)

According to the intra-reader agreement analyses of reader 2, there were excellent agreement values for each segment for all cases (Table 5). Lower agreement values were detected for duodenum and jejunum segments. At the same time, the best κ values were obtained in sigmoid colon and rectum assessments (Table 5).

Table 5

Intra-reader reliabilities of distension and radiological confidence scores of reader 2

Rater 2DistensionConfidence
κ95% CIpκ95% CIp
Stomach0.920.92-1.00< 0.0010.970.83-1.00< 0.001
Duodenum0.870.75-0.99< 0.0010.860.74-0.98< 0.001
Jejunum0.870.75-0.98< 0.0010.850.72-0.98< 0.001
Ileum0.880.76-0.99< 0.0010.870.74-1.00< 0.001
Ileocecal area0.890.77-1.00< 0.0010.870.74-1.00< 0.001
Cecum0.910.79-1.00< 0.0010.940.80-1.00< 0.001
Ascending colon0.880.77-1.00< 0.0010.970.84-1.00< 0.001
Transverse colon0.870.76-0.98< 0.0010.940.82-1.00< 0.001
Descending colon0.870.76-0.98< 0.0010.960.84-1.00< 0.001
Sigmoid0.940.82-1.00< 0.0010.980.85-1.00< 0.001
Rectum0.950.83-1.00< 0.0010.980.85-1.00< 0.001

Discussion

Our results showed that the new mixture was significantly more successful than the lactulose-water mixture according to distension and radiological confidence scores. We also observed adequate distension in colonic segments to provide optimal evaluation of colonic involvement in inflammatory diseases without the need for extra contrast agent administration. We demonstrated that the new mixture can also be used in MRE and provide adequate luminal distension [8]. Therefore, MRI can be preferred for imaging the colonic segments with late images.

There were variations in the distension scores of the intestinal segments, which might be a consequence of the variations in the intestinal motility amongst the patients. Drinking 250-500 ml of water in addition to the mixture just before the imaging can be useful for stomach distension or obtaining late-phase additional images can increase the colonic distension. The imaging protocol can be arranged according to the pre-diagnosis or the history of the patient.

For the most part, intra- and inter-reader reliabilities were good for the groups. Lower agreement values were detected for duodenum and jejunum scores, and the best κ values were obtained in sigmoid colon assessments. This situation proves that the CTE technique with the new mixture is effective and reliable. The reason for the low agreement values in duodenum and jejunum may be the faster OCA discharge of these segments. If any abnormality is investigated in these regions, we think that additional fluid intake will increase the efficacy and/or reliability before the CTE.

CTE has become one of the most important imaging modalities for small bowel imaging. Endoscopy-colonoscopy, capsule endoscopy, small bowel follow-through, conventional/CT/MR enteroclysis, MRE are the other imaging techniques for evaluating small bowel diseases.

Endoscopic techniques can provide mucosal visualisation, but extra-intestinal structures cannot be evaluated. Jejunum and ileum cannot be visualised by endoscopy or colonoscopy. Also, capsule endoscopy is contraindicated for bowel obstruction and stricture suspected cases [9-11]. Enteroclysis-based techniques are centred on OCA administration via nasojejunal intubation [5]. Therefore, it is an invasive method, which provides adequate bowel distension. Also, additional ionising radiation exposure due to duodenal catheter placement is an additional disadvantage of the enteroclysis [11,12].

CTE is a non-invasive, well-tolerated method that can evaluate luminal, mural, and extra-intestinal abnormalities. It provides high resolution, multiplanar reformatted images [13-15]. CTE is the fastest and the most appropriate imaging modality for evaluating active inflammatory bowel disease and its complications [16]. The only disadvantage of this technique is the radiation exposure [17]. MRE overcomes this disadvantage, so it is preferred for follow-up imaging of inflammatory bowel disease in paediatric patients [18,19]. On the other hand, MRE is more time consuming and expensive. The image quality is also variable in MR imaging. CTE can provide better image quality in patients who cannot hold their breath during imaging. The radiation exposure dose is the same as abdominal-pelvic venous phase CT, and it can be reduced by using a dose modulation option and advanced reconstruction techniques [20].

Inadequate luminal distension can cause misinterpretation such as wall thickening, abnormal mural enhancement, or obscuring of intraluminal lesions [5,6]. Therefore, obtaining optimal luminal distension is crucial for a good-quality CTE. OCAs used for this purpose are classified into two groups such as negative/neutral and positive. Water, lactulose, oil emulsion, Mucofalk, methylcellulose, polyethylene glycol (PEG), mannitol, locust bean gum, swollen fibre laxatives, and sorbitol are negative OCAs. Water with iodine-based contrast (ultra-low dose) agent mixtures are positive OCAs [6,10,21,22].

Negative OCAs increases the visibility of mural enhancement by increasing the contrast difference between the lumen and the intestinal wall [6,9,23-28]. Positive OCAs help in the differentiation of intraluminal versus extraluminal pathologies and make the extra-intestinal fluid collections more apparent. They can obscure mural and mucosal enhancement in inflammatory bowel diseases or obscure GI tract bleeding [29,30]. Also, if the images are obtained in the arterial phase (CT angiography), these contrast agents will create difficulty in the evaluation of vascular structures [6,28,31-38]. Positive OCAs are useful for detecting the localisation of fistulas and obstruction [29].

Our new mixture is a negative OCA. If the iodine-based contrast media is mixed into the OCA, the final mixture also shows characteristics of positive OCAs, which aids in assessing extra-luminal pathologies such as fluid collections (e.g. abscess, cystic lesions, etc.), without obscuring mural or mucosal enhancement. Lactulose, sorbitol, and methylcellulose inhibit water absorption. Methylcellulose is the one with the fewest adverse effects amongst the OCAs, and hence it increases the luminal distension without increasing the adverse effects.

The optimal volume of OCA, considering adequate luminal distension, patient tolerance, and adverse effects have been discussed in the literature [39]. Maglinte et al. observed that 1.5 l was not enough for small bowel distension in active inflammatory bowel disease assessment, but they also mentioned that they could have obtained good-quality images with fewer volumes [40]. Kuehle et al. used a 1 l solution of 2.5% mannitol and 0.2% locust bean gum in their study and observed an increase in adverse effects but not in distension when they increased the volume to 1200-1500 ml [41]. Boudiaf et al. performed CT enteroclysis with 2 l water and observed poor distension in only two of the 107 patients in their study [24]. The amount of OCA used in studies ranges between 1300 and 2000 ml [28,42-44], so we used 1500 ml of OCA mixture in our study.

The limitations of the study were as follows: not all of the patients succeeded in drinking all of the solutions – some of them vomited before the imaging, but this a handicap of all of the OCAs discussed in the studies. We could only compare our mixture with water-lactulose solution because most of the other OCAs are not readily available in our country.

Conclusions

The new mixture can provide good-quality images with optimal luminal distension. Inter- and intra-reader reliabilities of the new mixture were good or excellent (especially for ileum and colonic assessments). The new mixture is more efficient and reliable for ileum and colon. We think that using the new mixture can increase the radiological confidence in CTE evaluations.

Acknowledgments

We gratefully thank Doctor MG. Kartal and our technicians for their significant contributions.

Disclosure

The authors declare no conflicts of interest.

References

1 

Evrimler S, Algin O , authors. MR enterography with oral contrast agent composed of methylcellulose, low-dose barium sulfate, sorbitol, and lactulose: assessment of diagnostic performance, reliability, image quality, and patient tolerance. Clin Imaging. 2016. 40:p. 523–530

2 

Algin O, Evrimler S, Ozmen E, Metin M, Ersoy O, Karaoglanoglu M , authors. Desmoid tumor associated with familial adenomatous polyposis: evaluation with 64-detector CT enterography. Iran J Radiol. 2012. 9:p. 32

3 

Sheedy SP, Kolbe AB, Fletcher JG, Fidler JL , authors. Computed tomography enterography. Radiol Clin North Am. 2018. 56:p. 649–670

4 

Algin O, Turkbey B, Ozmen E, Algin E , authors. Magnetic resonance enterography findings of chronic radiation enteritis. Cancer Imaging. 2011. 11:p. 189–194

5 

Masselli G, Gualdi G , authors. Evaluation of small bowel tumors: MR enteroclysis. Abdom Imaging. 2010. 35:p. 23–30

6 

Paulsen SR, Huprich JE, Fletcher JG, et al. , authors. CT enterography as a diagnostic tool in evaluating small bowel disorders: review of clinical experience with over 700 cases. Radiographics. 2006. 26:p. 641–657

7 

Portney LG, Watkins MP , authors. Foundations of Clinical Research: Applications to Practice. 1999. 2nd ed. Upper Saddle River: Prentice Hall Health;

8 

Algin O, Evrimler S, Ozmen E, et al. , authors. A novel biphasic oral contrast solution for enterographic studies. J Comput Assist Tomogr. 2013. 37:p. 65–74

9 

Hara AK, Leighton JA, Heigh RI, et al. , authors. Crohn disease of the small bowel: preliminary comparison among CT enterography, capsule endoscopy, small-bowel follow-through, and ileoscopy. Radiology. 2006. 238:p. 128–134

10 

Triester SL, Leighton JA, Leontiadis GI, et al. , authors. A meta-analysis of the yield of capsule endoscopy compared to other diagnostic modalities in patients with non-structuring small bowel Crohn’s disease. Am J Gastroenterol. 2006. 101:p. 954–964

11 

Markova I, Kluchova K, Zboril R, Mashlan M, Herman M , authors. Small bowel imaging-still a radiologic approach. Biomed Pap Med Fac Univ Palacky Olomouc Czech Repub. 2010. 154:p. 123–132

12 

Cronin CG, Lohan DG, Browne AM, Roche C, Murphy JM , authors. Does MRI with oral contrast medium allow single-study depiction of inflammatory bowel disease enteritis and colitis? Eur Radiol. 2010. 20:p. 1667–1674

13 

Hara AK, Walker FB, Silva AC, Leighton JA , authors. Preliminary estimate of triphasic CT enterography performance in hemodynamically stable patients with suspected gastrointestinal bleeding. Am J Roentgenol. 2009. 193:p. 1252–1260

14 

Jaffe TA, Martin LC, Miller CM, et al. , authors. Abdominal pain: coronal reformations from isotropic voxels with 16-section CT – reader lesion detection and interpretation time. Radiology. 2007. 242:p. 175–181

15 

Jaffe TA, Nelson RC, Johnson GA, et al. , authors. Optimization of multiplanar reformations from isotropic data sets acquired with 16–detector row helical CT scanner. Radiology. 2006. 238:p. 292–299

16 

Kim DH, Carucci LR, Baker ME, et al. , authors. ACR Appropriateness Criteria Crohn disease. J Am Coll Radiol. 2015. 12:p. 1048–57.e4

17 

Lee SS, Ha HK, Yang SK, et al. , authors. CT of prominent pericolic or perienteric vasculature in patients with Crohn’s disease: correlation with clinical disease activity and findings on barium studies. Am J Roentgenol. 2002. 179:p. 1029–1036

18 

Fletcher J , author. CT enterography technique: theme and variations. Abdom Imaging. 2009. 34:p. 283–288

19 

Siddiki HA, Fidler JL, Fletcher JG, et al. , authors. Prospective comparison of state-of-the-art MR enterography and CT enterography in small-bowel Crohn’s disease. Am J Roentgenol. 2009. 193:p. 113–121

20 

Elsayes KM, Al-Hawary MM, Jagdish J, Ganesh HS, Platt JF , authors. CT enterography: principles, trends, and interpretation of findings. Radiographics. 2010. 30:p. 1955–1970

21 

Sinha R, Verma R, Verma S, Rajesh A , authors. MR enterography of Crohn disease: part 1, rationale, technique, and pitfalls. Am J Roentgenol. 2011. 197:p. 76–79

22 

Thomsen HS, Morcos SK, Almén T, et al. , authors. Nephrogenic systemic fibrosis and gadolinium-based contrast media: updated ESUR Contrast Medium Safety Committee guidelines. Eur Radiol. 2013. 23:p. 307–318

23 

Arslan H, Etlik O, Kayan M, Harman M, Tuncer Yl, Temizöz O , authors. Peroral CT enterography with lactulose solution: preliminary observations. Am J Roentgenol. 2005. 185:p. 1173–1179

24 

Boudiaf M, Jaff A, Soyer P, Bouhnik Y, Hamzi L, Rymer R , authors. Small-bowel diseases: prospective evaluation of multi-detector row helical CT enteroclysis in 107 consecutive patients. Radiology. 2004. 233:p. 338–344

25 

Megibow AJ, Babb JS, Hecht EM, et al. , authors. Evaluation of bowel distention and bowel wall appearance by using neutral oral contrast agent for multi-detector row CT. Radiology. 2006. 238:p. 87–95

26 

Raptopoulos V, Schwartz R, McNicholas M, Movson J, Pearlman J, Joffe N , authors. Multiplanar helical CT enterography in patients with Crohn’s disease. AJR Am J Roentgenol. 1997. 169:p. 1545–1550

27 

Reittner P, Goritschnig T, Petritsch W, et al. , authors. Multiplanar spiral CT enterography in patients with Crohn’s disease using a negative oral contrast material: initial results of a noninvasive imaging approach. Eur Radiol. 2002. 12:p. 2253–2257

28 

Wold PB, Fletcher JG, Johnson CD, Sandborn WJ , authors. Assessment of small bowel Crohn disease: noninvasive peroral CT enterography compared with other imaging methods and endoscopy – feasibility study. Radiology. 2003. 229:p. 275–281

29 

Hong SS, Kim AY, Byun JH, et al. , authors. MDCT of small-bowel disease: value of 3D imaging. Am J Roentgenol. 2006. 187:p. 1212–1221

30 

Macari M, Megibow AJ, Balthazar EJ , authors. A pattern approach to the abnormal small bowel: observations at MDCT and CT enterography. Am J Roentgenol. 2007. 188:p. 1344–1355

31 

Angelelli G, Macarini L , authors. CT of the bowel: use of water to enhance depiction. Radiology. 1988. 169:p. 848–849

32 

Bender GN, Timmons JH, Williard WC, Carter J , authors. Computed tomographic enteroclysis: one methodology. Invest Radiol. 1996. 31:p. 43–49

33 

Gourtsoyiannis N, Papanikolaou N, Grammatikakis J, Maris T, Prassopoulos P , authors. MR enteroclysis protocol optimization: comparison between 3D FLASH with fat saturation after intravenous gadolinium injection and true FISP sequences. Eur Radiol. 2001. 11:p. 908–913

34 

Horton KM, Fishman EK , authors. The current status of multidetector row CT and three-dimensional imaging of the small bowel. Radiol Clin North Am. 2003. 41:p. 199–212

35 

Lauenstein TC, Schneemann H, Vogt FM, Herborn CU, Ruhm SG, Debatin JF , authors. Optimization of oral contrast agents for MR imaging of the small bowel. Radiology. 2003. 228:p. 279–283

36 

Maccioni F, Viscido A, Broglia L, et al. , authors. Evaluation of Crohn disease activity with magnetic resonance imaging. Abdom Imaging. 2000. 25:p. 219–228

37 

Mazzeo S, Caramella D, Battolla L, et al. , authors. Crohn disease of the small bowel: spiral CT evaluation after oral hyperhydration with isotonic solution. J Comput Assist Tomogr. 2001. 25:p. 612–616

38 

Rollandi G, Curone P, Biscaldi E, et al. , authors. Spiral CT of the abdomen after distention of small bowel loops with transparent enema in patients with Crohn’s disease. Abdom Imaging. 1999. 24:p. 544–549

39 

Young B, Fletcher J, Paulsen S , authors. Comparison of oral contrast agents for cross-sectional enterography: timing, small bowel distention and side effects. 2005. San Antonio: Society of Gastrointestinal Radiologists;

40 

Maglinte DD, Sandrasegaran K, Lappas JC, Chiorean M , authors. CT enteroclysis. Radiology. 2007. 245:p. 661–671

41 

Kuehle CA, Ajaj W, Ladd SC, Massing S, Barkhausen J, Lauenstein TC , authors. Hydro-MRI of the small bowel: effect of contrast volume, timing of contrast administration, and data acquisition on bowel distention. Am J Roentgenol. 2006. 187:p. W375–385

42 

Fidler JL, Guimaraes L, Einstein DM , authors. MR imaging of the small bowel. Radiographics. 2009. 29:p. 1811–1825

43 

Kayhan A, Oommen J, Dahi F, Oto A , authors. Magnetic resonance enterography in Crohn’s disease: standard and advanced techniques. World J Radiol. 2010. 2:p. 113–121

44 

Schmidt S, Guibal A, Meuwly JY, et al. , authors. Acute complications of Crohn’s disease: comparison of multidetector-row computed tomographic enterography with magnetic resonance enterography. Digestion. 2010. 82:p. 229–238

Copyright: © Polish Medical Society of Radiology This is an Open Access article distributed under the terms of the Creative Commons Attribution-Noncommercial-No Derivatives 4.0 International (CC BY-NC-ND 4.0). License allowing third parties to download articles and share them with others as long as they credit the authors and the publisher, but without permission to change them in any way or use them commercially.
 
Quick links
© 2024 Termedia Sp. z o.o.
Developed by Bentus.