


Introduction
Soft tissue sarcomas account for less than 1% of all adult malignancies [1,2]. Despite combined and aggressive treatment methods, including radiotherapy, chemotherapy, and surgical treatment, local relapse rates of soft tissue sarcomas are between 5 and 35% [2]. Most relapses develop within the first 2 years after surgery [3]. For this reason, postoperative follow-up must be done every 36 months with imaging. The lesion size, location, histological grade, surgical resection efficiency, and response to adjuvant treatments are important risk factors for the development of local recurrence [2]. Benign changes like haematoma, seroma, fibrosis, and granulation tissue that develop in the operation lodge after surgical treatment and radiotherapy may confuse local recurrence on magnetic resonance image (MRI) scans. In cases where a definite differentiation is not possible, the clinical approach is MRI follow-up or evaluation with positron emission tomography [4-6]. Diffusion MRI is currently routinely used in radiology clinics to identify fibrosis and tumours; it is a non-invasive method that generates contrasted images of the molecular movement of water. The diffusion sensitivity may vary at different b-values of diffusion. Images with low b-values are less diffusion weighted and use lower gradients. The diffusion sensitivity is also affected by perfusion at low b-values. Higher b-value images are more diffusion weighted and have low signal-to-noise ratios. For a meaningful evaluation of diffusion MRIs, they must be obtained with at least 2 separate b-values. Mistakes in apparent diffusion coefficient (ADC) calculations can be prevented by obtaining more than one b-value [7,8]. There is no common consensus about the b-value and the number of different b-values required to be used in the MRI evaluations of the muscular-skeletal system.
In our study, we aimed to show the efficacy of diffusion-weighted images at different b-levels and ADC values in the differentiation of recurrent and residual tumours.
Material and methods
Patient selection
Fifty-six patients who had undergone surgery with the diagnosis of soft tissue sarcomas between June 2012 and March 2015 that were followed-up with MRIs were evaluated. After the surgery, 5 patients with positive surgical margins and residual disease, 5 patients with detected lung metastases, and 2 patients with a history of a second primary cancer (one was colon cancer, the other was papillary thyroid cancer) were excluded from the trial. In addition, 2 patients with a groin localized tumour and a hip prosthesis were excluded from the trial to avoid artifacts. Forty-two patients who underwent extensive resection and had clean surgical margins, who attended their MRI follow-ups at month 6 and later were included in the trial. The study was approved by our institutional review board, and all patients gave their informed consent. The patient MRIs were re-evaluated and compared to the results of the histopathological evaluation of the surgical specimens. The demographic data and clinical findings of the patients were accessed using the patient archive system.
Magnetic resonance imaging acquisition
All MRI examinations were performed on a 1.5T MR system (Signa Excite HD, GE Healthcare) with different coils for knee, shoulder, and body. Axial and coronal T1-weighted (spin-echo imaging, repetition time ms/echo time ms = 580-700/9.4-28.3) and fluid sensitive (short tau inversion recovery imaging: 1500-5000/15-142; T2 weighted imaging: 3500-5700/15-170) sequences, as well as T1-weighted sequences (480/7.6-22.9), 8/1.5 mm thick sections after intravenous administration of contrast material (gadopentetate dimeglumine [Magnevist# Bayer Schering, Berlin, Germany], 0.1 mmol/kg body weight), were performed in all patients. DWI was performed using an axial single-shot echoplanar imaging sequence centred on the lesions (b = 50, 400, 800, and 1000 s/mm2; 1800/93.8; echo train length, 2; bandwidth, 31.25 MHz; matrix size, 160 × 192; field of view, 20-35 mm; number of signals averaged, 4; number of slices, 10; slice thickness, 7 mm; intersection gap, 1 mm; acquisition time, 2:53 minutes each for the four b-values).
Magnetic resonance imaging analysis and data collection
All images were transferred to a workstation (Advantage Windows version 4.2_07, GE Healthcare) and the DWI sequence was post-processed with commercial software (FuncTool, GE Healthcare) to obtain ADC maps (black/white and colour, the latter with a Puh-thallium colour scheme, ranging from black, diffusion restriction, to red, no diffusion restriction). The ADC maps of each lesion were calculated using four b-values (50, 400, 800, and 1000 s/mm2). The scanner software provided the mean value within the ROI, which equaled the ADC value (multiplied by 10-3).
The MRI findings were re-evaluated by radiologists with 8 years of experience (BS) and 10 years of experience (EA) in musculoskeletal MRI, respectively. The signal characteristics, contrast enhancement patterns, locoregional distribution of the postoperative tissue areas, and suspicious lesions were evaluated. The haematoma, seroma, and areas of postsurgical or postradiotherapy soft tissue changes and the masses that may relapse were identified based on the study by Garner et al. according to the T1, T2, and contrasting patterns observed in the patients [6]. Lesions hyperintense in T1-weighted and T2-weighted images that did not demonstrate significant contrast enhancement following IV contrast administration were classified as haematoma (Figure 1A-D); lesions with hypointense signal characteristics in T1-weighted images and hyperintense in T2-weighted images that did not enhance with contrast after IV contrast administration or contrasted peripherally were classified as seroma (Figure 1E-H); areas with hypointense signal characteristics in T1-weighted images and hyperintense in T2-weighted images that were mildly enhanced with contrast after IV contrast administration were classified as changes after operation and radiotherapy (Figure 1I-L); and lesions that were T1 hypointense, T2 hyperintense, and enhanced with contrast after IV contrast administration were classified as potential recurrent masses (Figure 1M-P, Figure 2, Table 1). In diffusion-weighted images, 1 cm2 ROIs were placed in postoperative tissue areas with hyperintense areas in T2-weighted images and 3 different areas with an appearance suspicious of recurrent masses, and the mean ADC values were calculated. ADC calculation was not done in the hypointense areas in T1-T2-weighted images and were considered as fibrosis. After MRI examinations, biopsies were obtained from the suspicious lesions with wire localization biopsies in 2 patients, and 13 patients underwent total excision. The mean diameter of the lesions excised was measured as 4.3 ± 1.5 cm (range 2-8 cm). Patients regarded as post-treatment tissue changes according to the T1, T2, and contrasting characteristics were followed up for a mean period of 17.8 ± 6.7 months (range, 8-32 months). No relapse or change in the tissue areas was identified during follow-up.
Figure 1
The magnetic resonance imaging (MRI) obtained at month 12 of the 48-year-old male patient operated with the diagnosis of liposarcoma in the thigh the lesion (A) hyperintense in T1-weighted images and (B) with hyperintense signal characteristics in T2-weighted images and (C) that did not demonstrate increased contrast enhancement after IV contrast administration was regarded as a haematoma (D). It was hyperintense in the diffusion weighted images, and the apparent diffusion coefficient (ADC) value was calculated as 2.5 × 10⁻³ mm2/s in the ADC map (E-H). In the MRI of the 64-year-old female patient operated on with the diagnosis of a fibrosarcomas in the groin obtained at 8 months after surgery the lesion (E) with hypointense signal characteristics in T1-weighted images and (F) hyperintense in T2-weighted images and (G) that enhanced with contrast peripherally after IV contrast administration was regarded as a seroma (H) was hyperintense in diffusion weighted images and the ADC value was calculated as 3 × 10⁻³ mm2/s in the ADC map (I-L). In the elbow MRI obtained at the month 24 follow-up of a 42-year-old male patient operated because of a synovial sarcoma located in the antecubital area the areas (I) with hypointense signal characteristics and (J) hyperintense in T2-weighted images and (K) enhancing with contrast mildly after IV contrast administration were evaluated as post-treatment changes and (L) were hyperintense in diffusion-weighted images, and the ADC value was calculated as 2.8 × 10⁻³ mm2/s in the ADC map (M-P). In the MRI follow up of a 34-year-old patient operated for a fibrosarcoma located in the superior of the shoulder obtained at month 12 after surgery the lesions (M) hypointense in T1-weighted images (N) hyperintense in T2-weighted images and (O) enhancing with contrast after IV contrast administration were primarily evaluated as recurrent masses and (P) were hyperintense in diffusion-weighted images, and the ADC value was calculated as 0.8 × 10⁻³ mm2/s in the ADC map
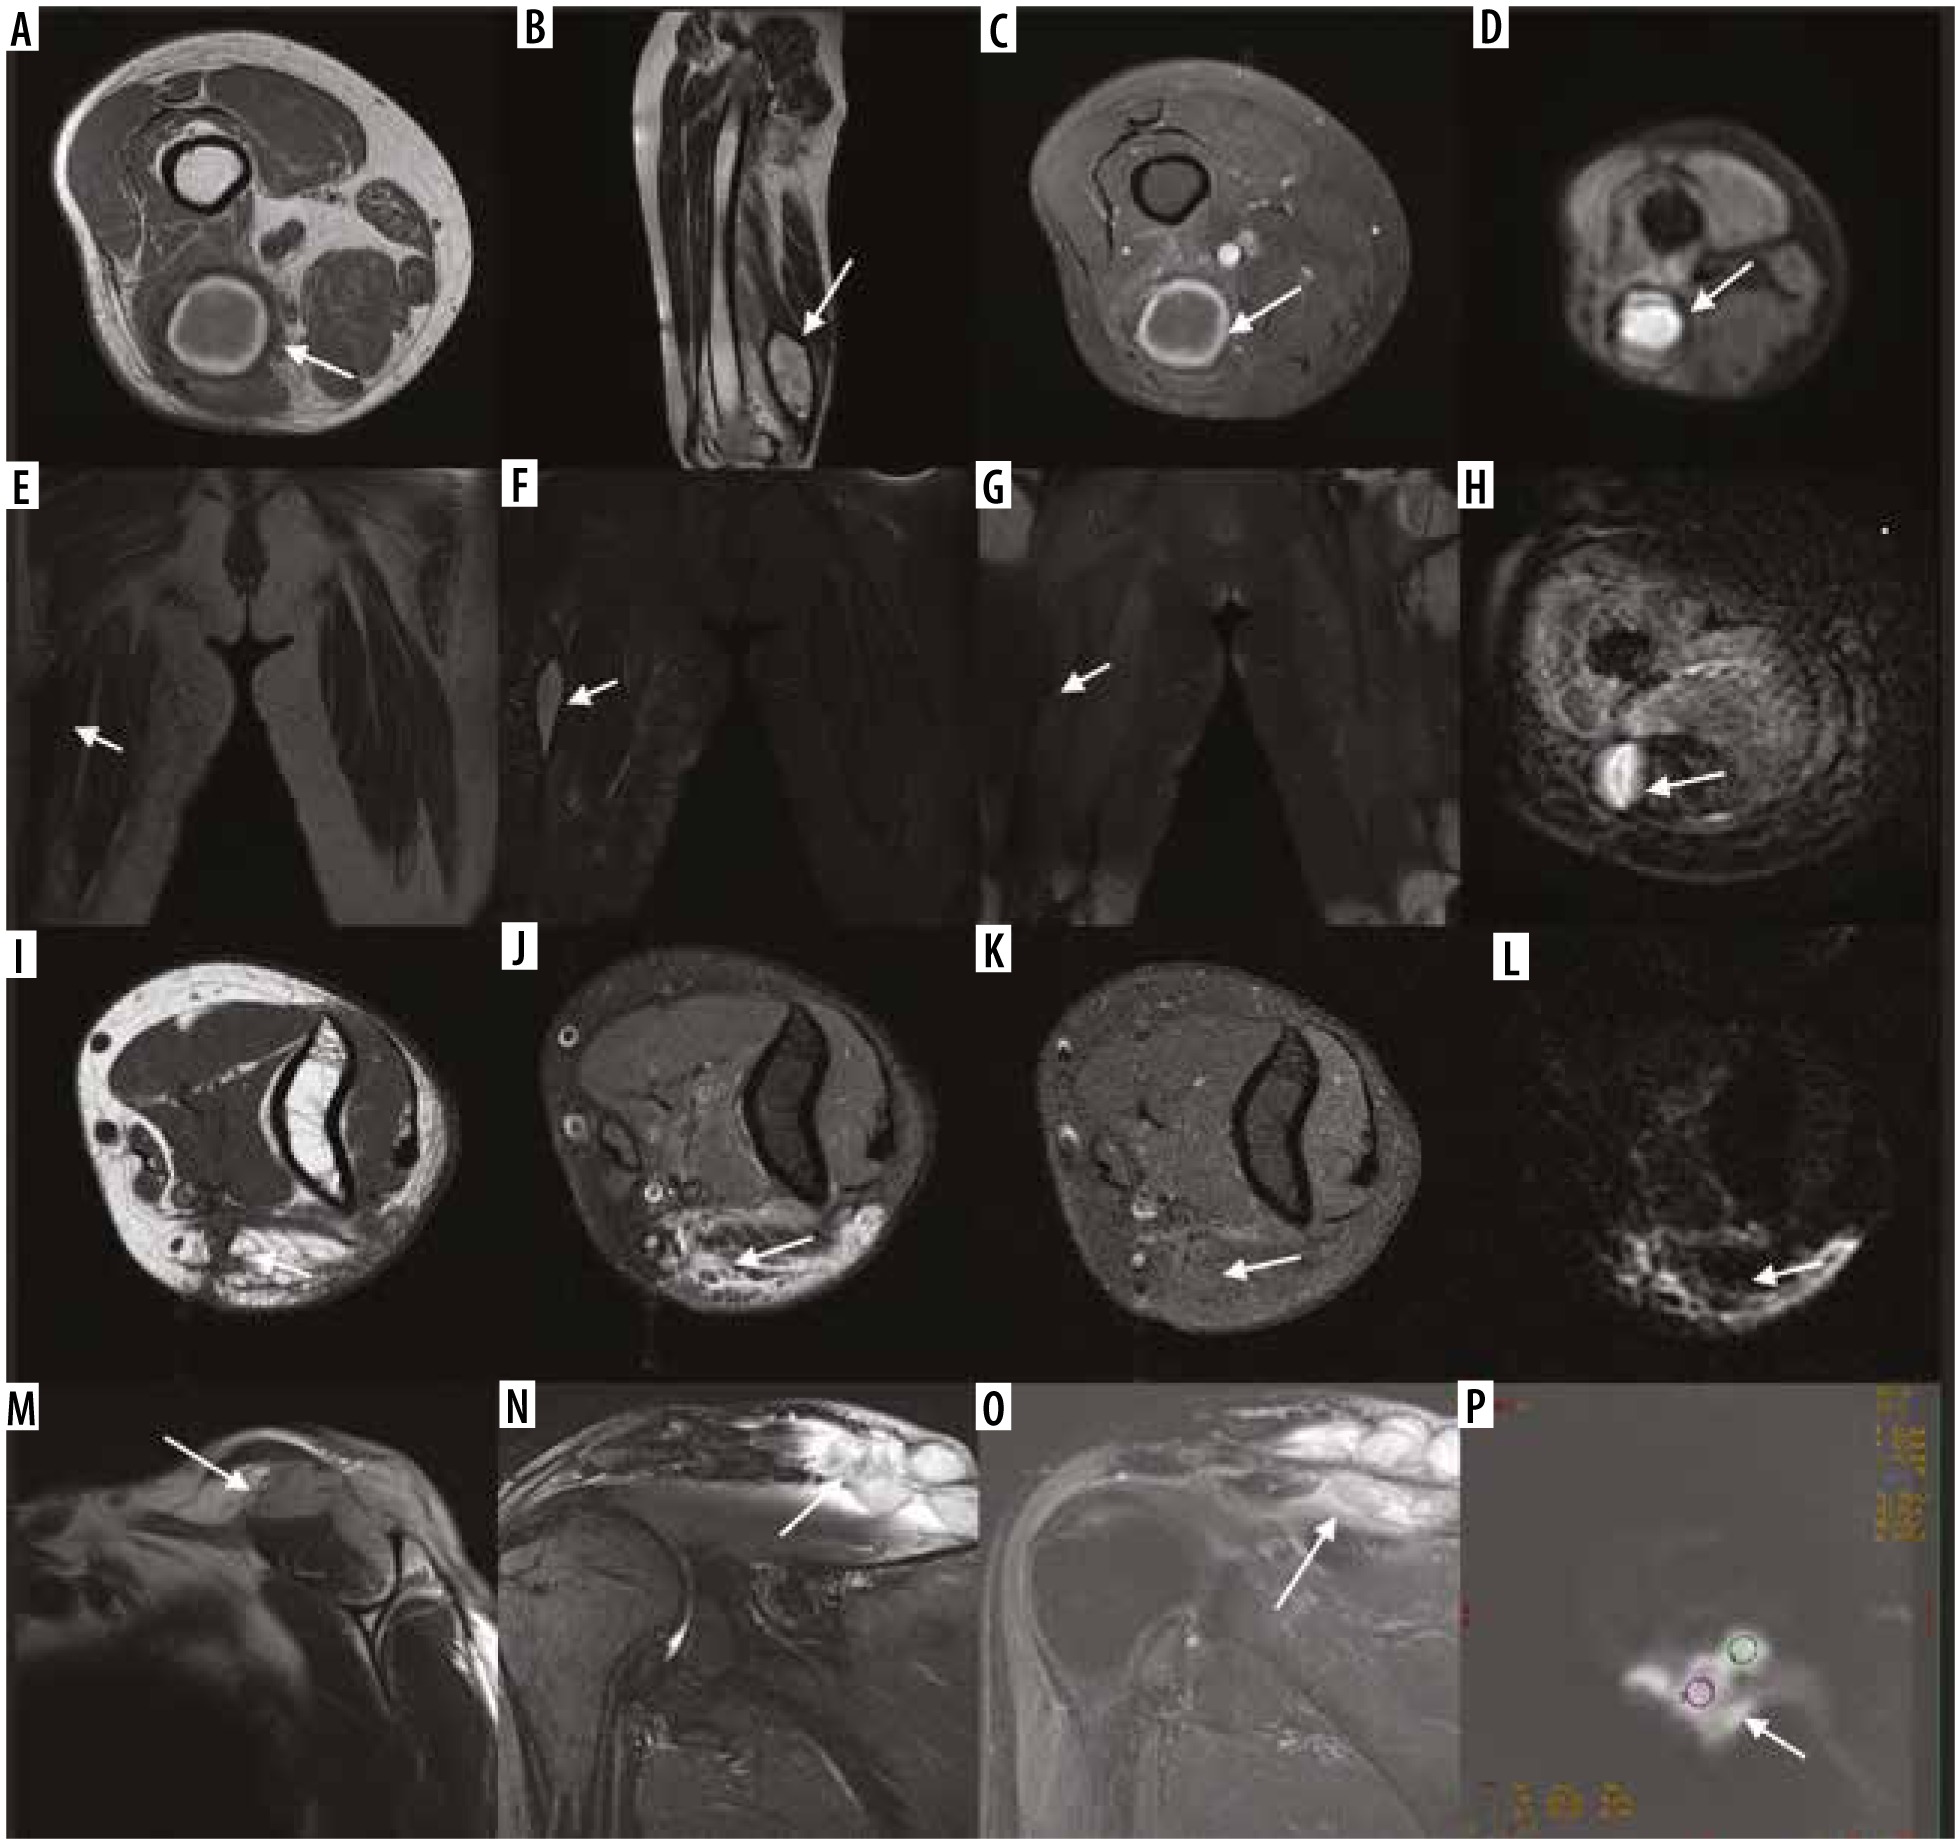
Figure 2
In month 12 magnetic resonance imaging (MRI) follow-up of a 67-year-old patient operated for a liposarcoma located in the proximal of the groin the lesions (A) hypointense in T1-weighted images, (B) hyperintense in T2-weighted images and (C) that enhanced with contrast after IV contrast administration were primarily regarded as recurrent masses and (D) were hyperintense in diffusion weighted images and the ADC value was calculated as 1.3 × 10⁻³ mm2/s in the apparent diffusion coefficient (ADC) map
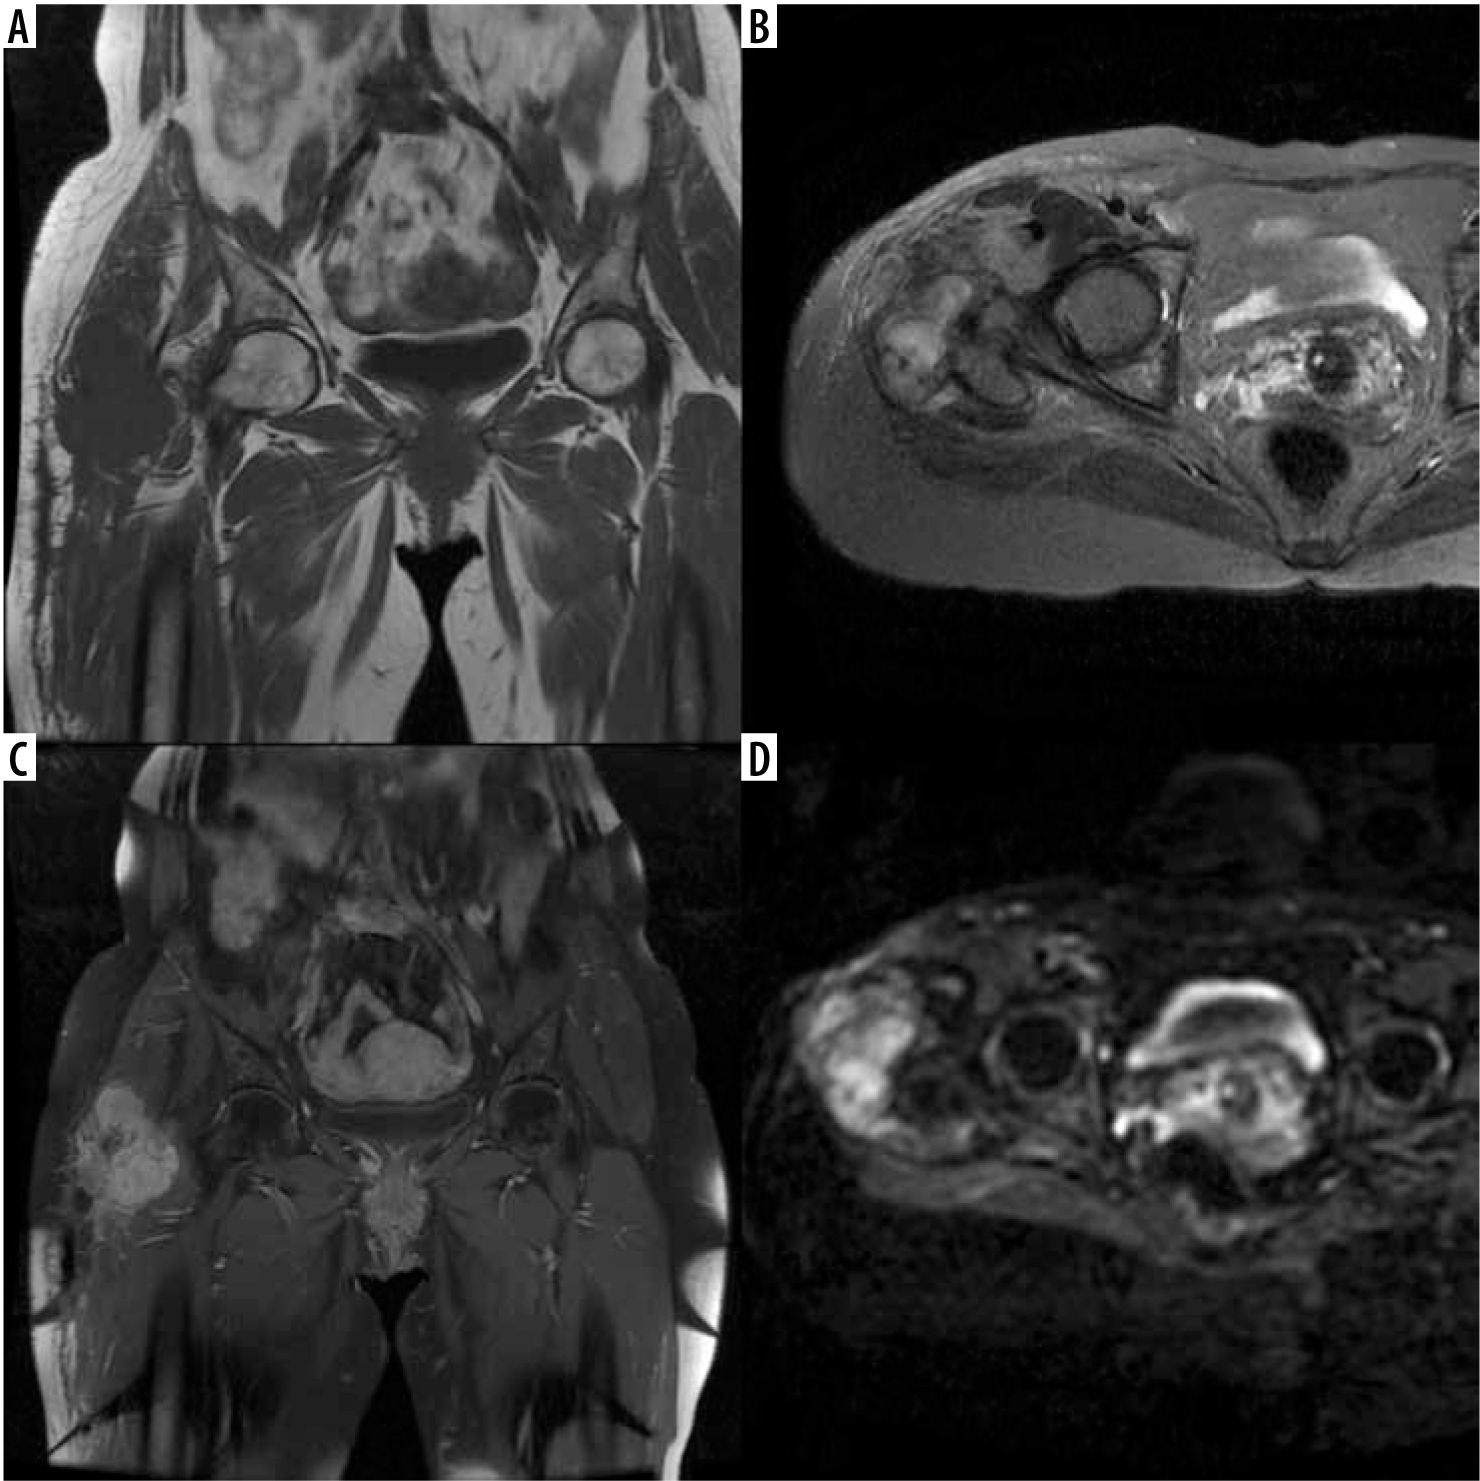
Table 1
Magnetic resonance imaging findings after treatment of soft-tissue sarcomas
Pathology
One patient underwent surgery for an alveolar rhabdomyosarcoma, 1 for embryonal rhabdomyosarcoma, 8 for fibrosarcomas, 6 for leiomyosarcomas, 8 for pleomorphic liposarcomas, 6 for myxoid liposarcomas, 2 for angiosarcomas, 1 for a malign schwannoma, 4 for pleomorphic sarcomas, 1 for a myxofibrosarcoma, 3 for synovial sarcomas, and 1 for soft tissue osteosarcoma. Among the tumours that relapsed, 1 was an alveolar rhabdomyosarcoma, 3 were fibrosarcomas, 2 were leiomyosarcomas, 3 were pleomorphic liposarcomas, 1 was a myxoid liposarcoma, 2 were angiosarcomas, 1 was a malignant schwannoma, 1 was a synovial sarcoma, and 1 was soft tissue osteosarcoma. Five (11.9%) of the sarcomas were grade 1, 21 (50%) were grade 2, and 16 (38.1%) were grade 3.
Statistical analysis
Descriptive statistics were expressed as mean ± standard deviation for continuous variables, and count and percentage for categorical variables. A c2 test was used to compare differences between groups for categorical variables. Repeated measures ANOVA was performed to compare means of different b-values (50, 400, 800, 1000). A post hoc Bonferroni test was used to examine multiple comparisons. The discriminatory performance of a quantitative test (b-50, b-40, b-800, b-1000) was evaluated by receiver-operating characteristics (ROC) analysis. The ROC curve was plotted based on the true-positive rate (TPR) and the false-positive rate (FPR). The area under the ROC curve (AUC) was obtained using the parametric method (trapezoidal rule). Histopathology and MR follow-up was taken as the reference standard method. Areas under the ROC curves were compared for b-50, b-400, b-800, and b-1000. Results of statistical significance were provided after Bonferroni’s correction. After ROC analysis, the optimal cut-off point was determined according to the Youden index. Sensitivity, specificity, positive predictive value (PPV), and negative predictive value (NPV) for b-values were calculated according to the optimal cut-off point. P < 0.05 was accepted as statistically significant. All statistical analyses were performed by using IBM SPS Statistics 21.0 software.
Results
Recurrent tumours were identified in 15 of the 42 patients included in the study. Out of these patients, 6 (40%) were female and 9 (60%) were male. Out of the 27 patients classified as postoperative tissue changes, 14 (51.8%) were female and 12 (48.1%) were male. There was no statistical difference with respect to gender between the 2 groups (p = 0.183). The mean age of patients with recurrent tumours identified was 51.6 ± 19.5 years, and the mean age of patients with postoperative tissue changes was 51.07 ± 1.37 years. No significant difference was identified between the groups with respect to age (p = 0.909) (Table 2). No statistical difference was present between the tumour types with respect to the ADC calculations at all b-levels. There was no meaningful correlation between the histopathological grade and ADC values. Twenty-two of the tumours were located in the thigh. Of the other tumours, 5 were in the leg, 3 in the popliteal fossa, 3 in the forearm, 2 neighbouring the knee, 2 in the shoulder, 2 in the arm, 1 in the antecubital fossa, 1 neighbouring the hip, and 1 in the elbow. Among the lesions considered as posttreatment tissue changes, 4 were fluid collections; 3 were postoperative haematoma. The other 18 lesions were T1 hypointense and T2 hyperintense and enhanced minimally following IV contrast administration.
Table 2
Comparison of demographic characteristics and apparent diffusion coefficients values between groups
When the group of recurrent tumour patients was compared to the postoperative changes group, the ADC calculations were statistically significantly lower at all b-levels (p < 0.001) (Table 2). The ADC values of recurrent tumours, areas of postoperative tissue change, and adjacent healthy muscular tissues measured at different b-values are summarized in Table 2. The sensitivity of b-50 values lower than 3.01 × 10⁻³ mm2/s in showing recurrent tumours was 100% and the specificity was 77.78%. The sensitivity of b-400 values lower than 2.1 × 10⁻³ mm2/s in showing recurrent tumours was 80% and the specificity was 96.3%. The sensitivity of b-800 values lower than 2.26 × 10⁻³ mm2/s in showing recurrent tumours was 100% and the specificity was 88.89%. The sensitivity of b-1000 values lower than 2.05 × 10⁻³ mm2/s in showing recurrent tumours was 93.3% and the specificity was 92.5% (Table 3, Figure 3). No significant difference was identified among the b-50, b-400, b-800, and b-1000 values in differentiating tumour recurrence from the postoperative changes (p = 0.91 for b-50 and b-400, p = 0.28 for b-50-800, p = 0.79 for b-50-1000, p = 0.12 for b-400-800, p = 0.80 for b-400-1000, p = 0.31 for b-800-1000, significant after Bonferroni’s correction p < 0.00833).
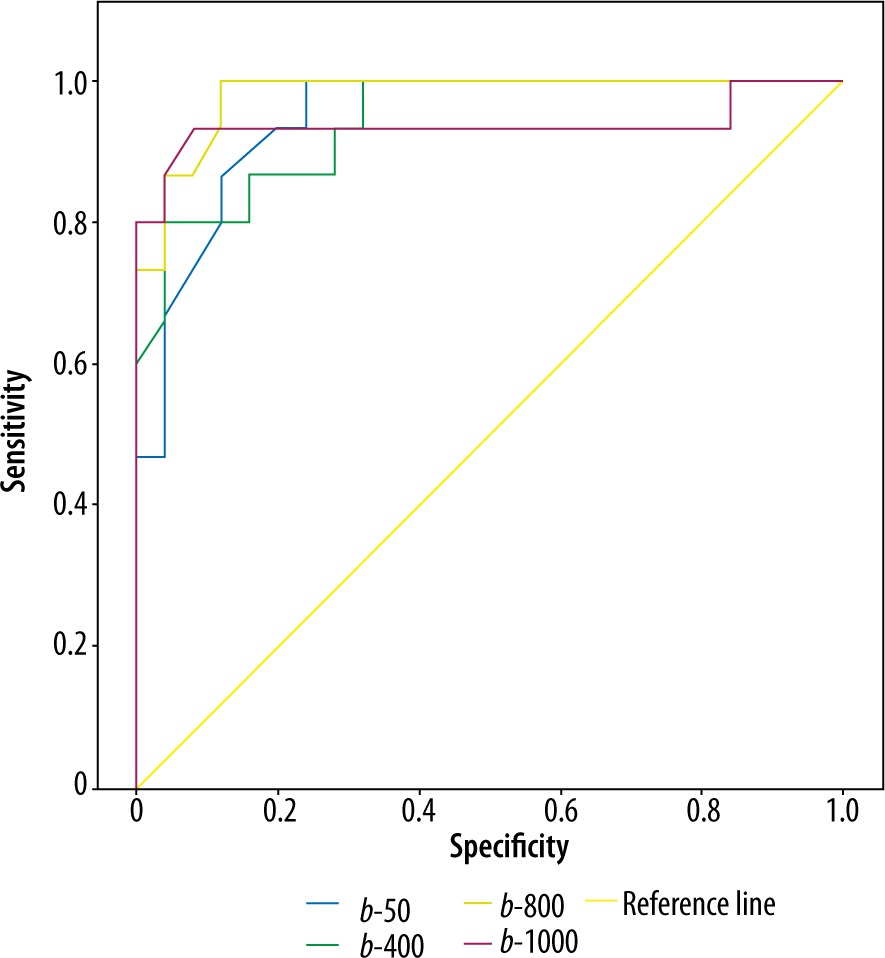
Table 3
Area under the receiver operating characteristics curve (AUC) and criteria (apparent diffusion coefficient – ADC) observed to maximize sensitivity and specificity for predicting recurrent tumour (n = 42)
| b-value | AUC | Prediction of recurrent tumour | ||
|---|---|---|---|---|
| ADC criteria (mm2/s) | Sensitivity (%) | Specificity (%) | ||
| 50 | 0.951 | ≤ 3.01 | 100 | 77.78 |
| 400 | 0.947 | ≤ 2.10 | 80 | 96.30 |
| 800 | 0.981 | ≤ 2.26 | 100 | 88.89 |
| 1000 | 0.937 | ≤ 2.00 | 93.33 | 92.59 |
Discussion
Our study identified that the ADC calculations obtained from diffusion-weighted images at different b-levels are highly sensitive and specific in the differentiation of soft tissue sarcoma recurrence and postoperative benign changes.
Conventional MRI plays an important role in the postoperative evaluation of soft tissue sarcomas. However, once patients are delivered radiotherapy and chemotherapy after surgical treatment, differentiating areas of posttreatment tissue changes from tumour recurrence is sometimes difficult [2]. Postoperative seroma, haematoma, and inflammatory changes following radiotherapy are hyperintense in T2-weighted sequences, and most tumour recurrences also appear hyperintense in T2-weighted sequences [9-12]. Vanel et al. showed that hypointense signal changes in T2-weighted images have a sensitivity of 96% in ruling out tumour recurrence and residues [11]. In addition, the preservation of the muscle texture sign finding in T1-weighted images can also be used to rule out tumours [13]. In dynamic evaluations, the areas of post-treatment tissue changes enhance with contrast in the later stage, and tumour recurrence enhances in earlier stages [14]. The sensitivity of dynamic evaluation has been reported as 87% and the positive predictive value as 70% [15]. Myxoid tumours can be confused with postoperative seroma because of their high signal intensities in T2-weighted images [16,17]. Tumours that contain high mineralization and fibrous components may be confused with postoperative scar tissue [2]. Tumours with haemorrhagic components may be confused with postoperative haematomas. Therefore, the tumour recurrence can be differentiated from post-treatment tissue changes to a limited extent in some tumours [10]. In cases where conventional methods fall short, and if contrast is not administered to the patient, new imaging methods are needed to differentiate recurrent tumours from postoperative tissue changes and to guide the surgery.
ADC mapping in diffusion MRI evaluations is used to demonstrate the levels of cellularity in different areas of the body. Diffusion-weighted images can be used to differentiate tumour recurrence from posttreatment soft tissue changes. Low ADC values are obtained in malign tumours with high cellularity, fibromuscular tissue, and fat tissue; high ADC levels are obtained from tumours with low cellularity, lesions with fluid content, necrotic regions, and acellular regions [7,9]. Most of our patients included in the study had high-grade sarcomas that demonstrated high cellularity. However, we could not identify a meaningful correlation between the histopathological grades and the ADC values. The ADC values of relapsed massive lesions were lower when compared to the areas of benign changes. When the ADC values of benign changes like haematoma, seroma, edema, and inflammatory changes that develop after treatment were compared with recurrent tumours, they were higher, and these results are consistent with the literature. Low ADC vwalues are obtained in the development of fibrous tissue change [18]. In the study conducted by Del Grande et al. it was shown that lower ADC values were obtained from fibrous tissue areas than the tumour tissues. This is why we did not perform calculations in the areas we regarded as fibrous tissue that had hypointense signal characteristics in T1-T2 weighted images and did not enhance with contrast after IV contrast administration in our study. Baur et al. reported that ADC mapping can be used to identify sarcoma recurrence and that diffusion ADC mapping is effective in differentiating muscular edema and postoperative seroma from recurrent tumours [19]. In the study conducted by Grande et al., with a small number of patients, using a 3 tesla MRI, they found that the ADC values obtained from diffusion-weighted MRIs were statistically significantly different for recurrence, postoperative scar tissue, and haematoma. They identified that the mean ADC for recurrence was 1.08 × 10⁻³ mm2/s, 0.9 × 10⁻³ mm2/s for postoperative scar tissue, and 0.9 × 10⁻³ mm2/s for haematoma [18]. We calculated the mean ADC value of relapsed masses as 1.69 × 10⁻³ mm2/s and as 2.98 × 10⁻³ mm2/s for areas of post-treatment tissue changes. Because we did not measure the ADC values of fibrous tissues in our study, we may have calculated a higher ADC value for post-treatment changes than the ADC value calculated by Grande et al. for postoperative scar tissue. When the tumours in our study were evaluated according to the histological subtypes, it was seen that 2 angiosarcomas had higher ADC values than the other soft tissue sarcoma recurrences (mean 2.7 × 10⁻³ mm2/s). The ADCs obtained might be higher because of the different histological content of angiosarcomas like haemorrhages.
The role of different b-values in showing soft tissue sarcomas and sarcoma recurrences has not been investigated before [18,20]. Different b-values can change the sensitivity of the diffusion. At lower b-values, a signal decrease may occur in water molecules that have high levels of motion similar to intravascular space. This is why ADC is significantly affected by vascular perfusion. At high b-values, the signal-to-noise ratio decreases, which also affects ADC calculations [19-24]. Due to this, to obtain accurate ADC values, calculations must be done with at least 3 different b-values [20]. We performed 4 different ADC calculations in our study. The mean ADC calculations at b-values of 50 (2.10 × 10⁻³ ± 0.57, p < 0.01) were higher when compared to other b-values, but we found meaningful results in showing recurrence just as in other b-values. We found that all b-values had high sensitivity and specificity and identified that the sensitivity and specificity were highest at b-1000 values. To avoid artifacts, it may be sufficient to shorten the duration and carry out evaluations at 2 different b-values.
Because the signal-to-noise ratio is lower in diffusion- weighted images, more artifacts may be present, especially in the postoperative period, compared to conventional sequences [19,20]. We did not include patients who had prostheses or operation material that cause artifacts in the study.
Our study had some limitations. Our study was retrospective, and we worked with a heterogeneous patient group. Because the tumours were located in different areas of the body, the imaging protocols differed accordingly. Because we used 4 different b-values, the imaging duration was prolonged, and movement artifacts were more common.
Another limitation was the number of patients. Both the overall number of patients and the number of relapse patients were low (15/40). Further research, with more patients, directed to the ADC evaluation of specific sarcoma diagnoses and research that evaluates the ADC calculations of benign neoplasias like low-grade tumours and fibromatosis that have high recurrence rates are necessary.