


Introduction
Renal sinus lipomatosis (RSL) is a benign entity described by the excessive accumulation of non-tumourous fatty tissue in the kidney sinus [1]. Normally, the kidney sinus contains a variable amount of fat that surrounds the upper part of the kidney pelvis, renal arteries, renal veins, and nerves. In RSL, there is an extreme accumulation of this fat but without any encroachment on the normal kidney parenchyma [2]. In general, ultrasonography (USG) findings suggest RSL; however, computed tomography (CT) and magnetic resonance imaging (MRI) are definitive imaging methods to demonstrate RSL. Proliferation of the fatty tissue in the renal sinus can be clearly assessed by CT scan [3].
Metabolic syndrome (MS) includes a number of metabolic parameters such as abdominal obesity, hypertension (HT), insulin resistance/diabetes mellitus, and hyperlipidaemia, which have been demonstrated to be predictive of cardiovascular diseases [4]. On the other hand, abdominal visceral fat is related with MS, and independently related to the morbidity and mortality of coronary artery diseases. Therefore, abdominal visceral fat has been used as a clinical risk measure for obesity [5].
In the literature, only a few investigations have reported the relationship between renal sinus fat volume and cardiovascular risk factors, and abdominal visceral fat [6,7]. However, no study in the literature has yet looked into the relationship between RSL and metabolic risk factors, abdominal visceral fat, and abdominal subcutaneous fat.
The aim of our study was to investigate the relationship between RSL and metabolic factors, abdominal visceral fat, and subcutaneous fat.
Material and methods
Among the cases undergoing abdominal CT examination for the purpose of nonspecific abdominal pain in our radiology department, from September 2016 to April 2017, we retrospectively analysed for the presence of RSL. The diagnosis of RSL was made by two experienced radiologists. In all cases of RSL diagnosis, there was an extreme accumulation of renal sinus fat but without any encroachment on the normal kidney parenchyma, as previously defined [2]. A total of 73 subjects were included in the study. Thirty-five cases with RSL formed the study group (Figure 1). Thirty-eight age- and sex-matched cases that were observed to have no RSL in abdominal CT examinations formed the control group. Ethics Committee approval was obtained in advance in order to fulfil ethical clearance procedures. Patients were excluded from the study if they had a severe parenchymal atrophy, chronic kidney disease, single kidney, horseshoe kidney, hydronephrosis, calculus in kidney or ureter, malignancy, steroid use, high urea and creatinine values in laboratory tests, and insufficient medical information. None of the participants were taking steatogenic drugs.
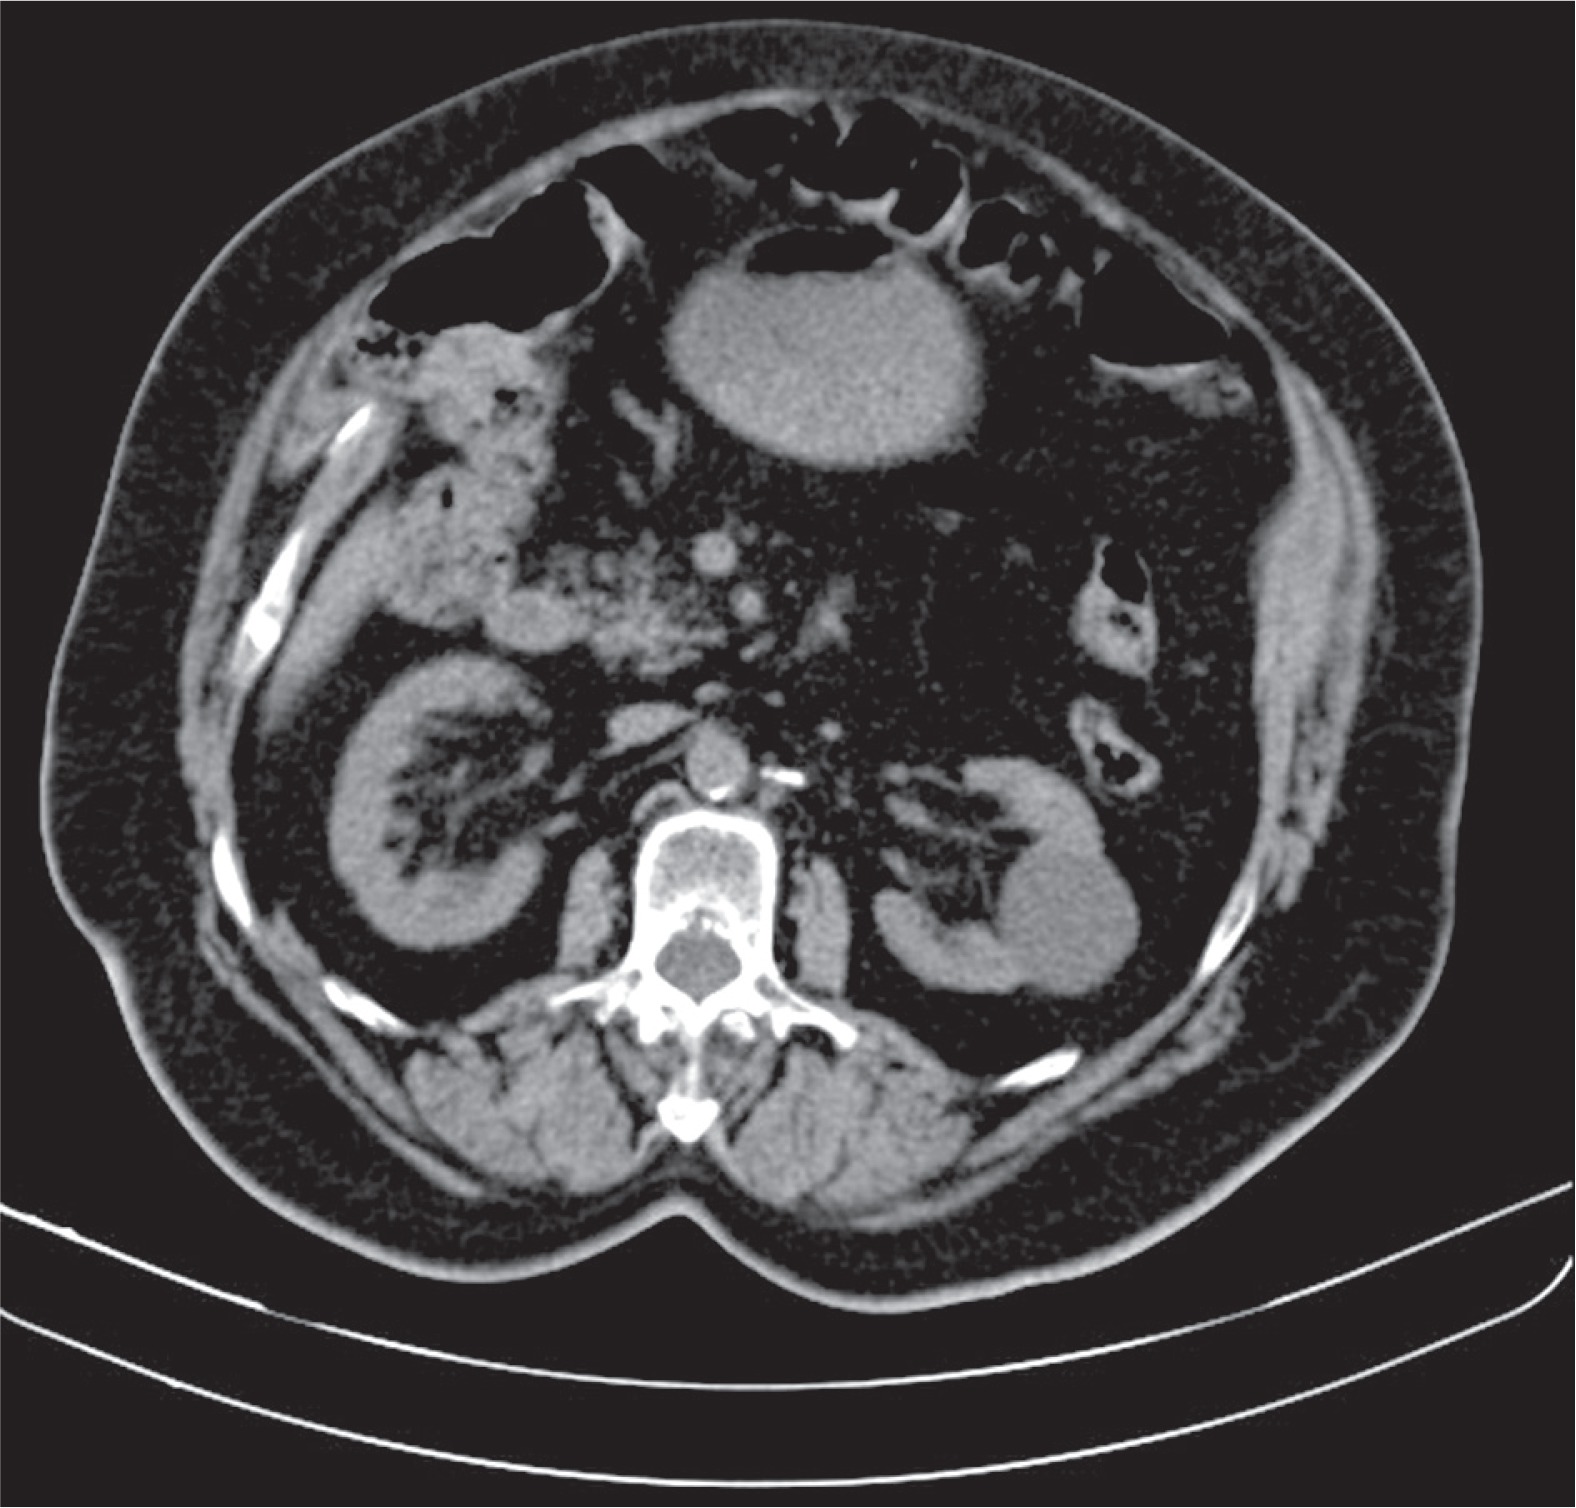
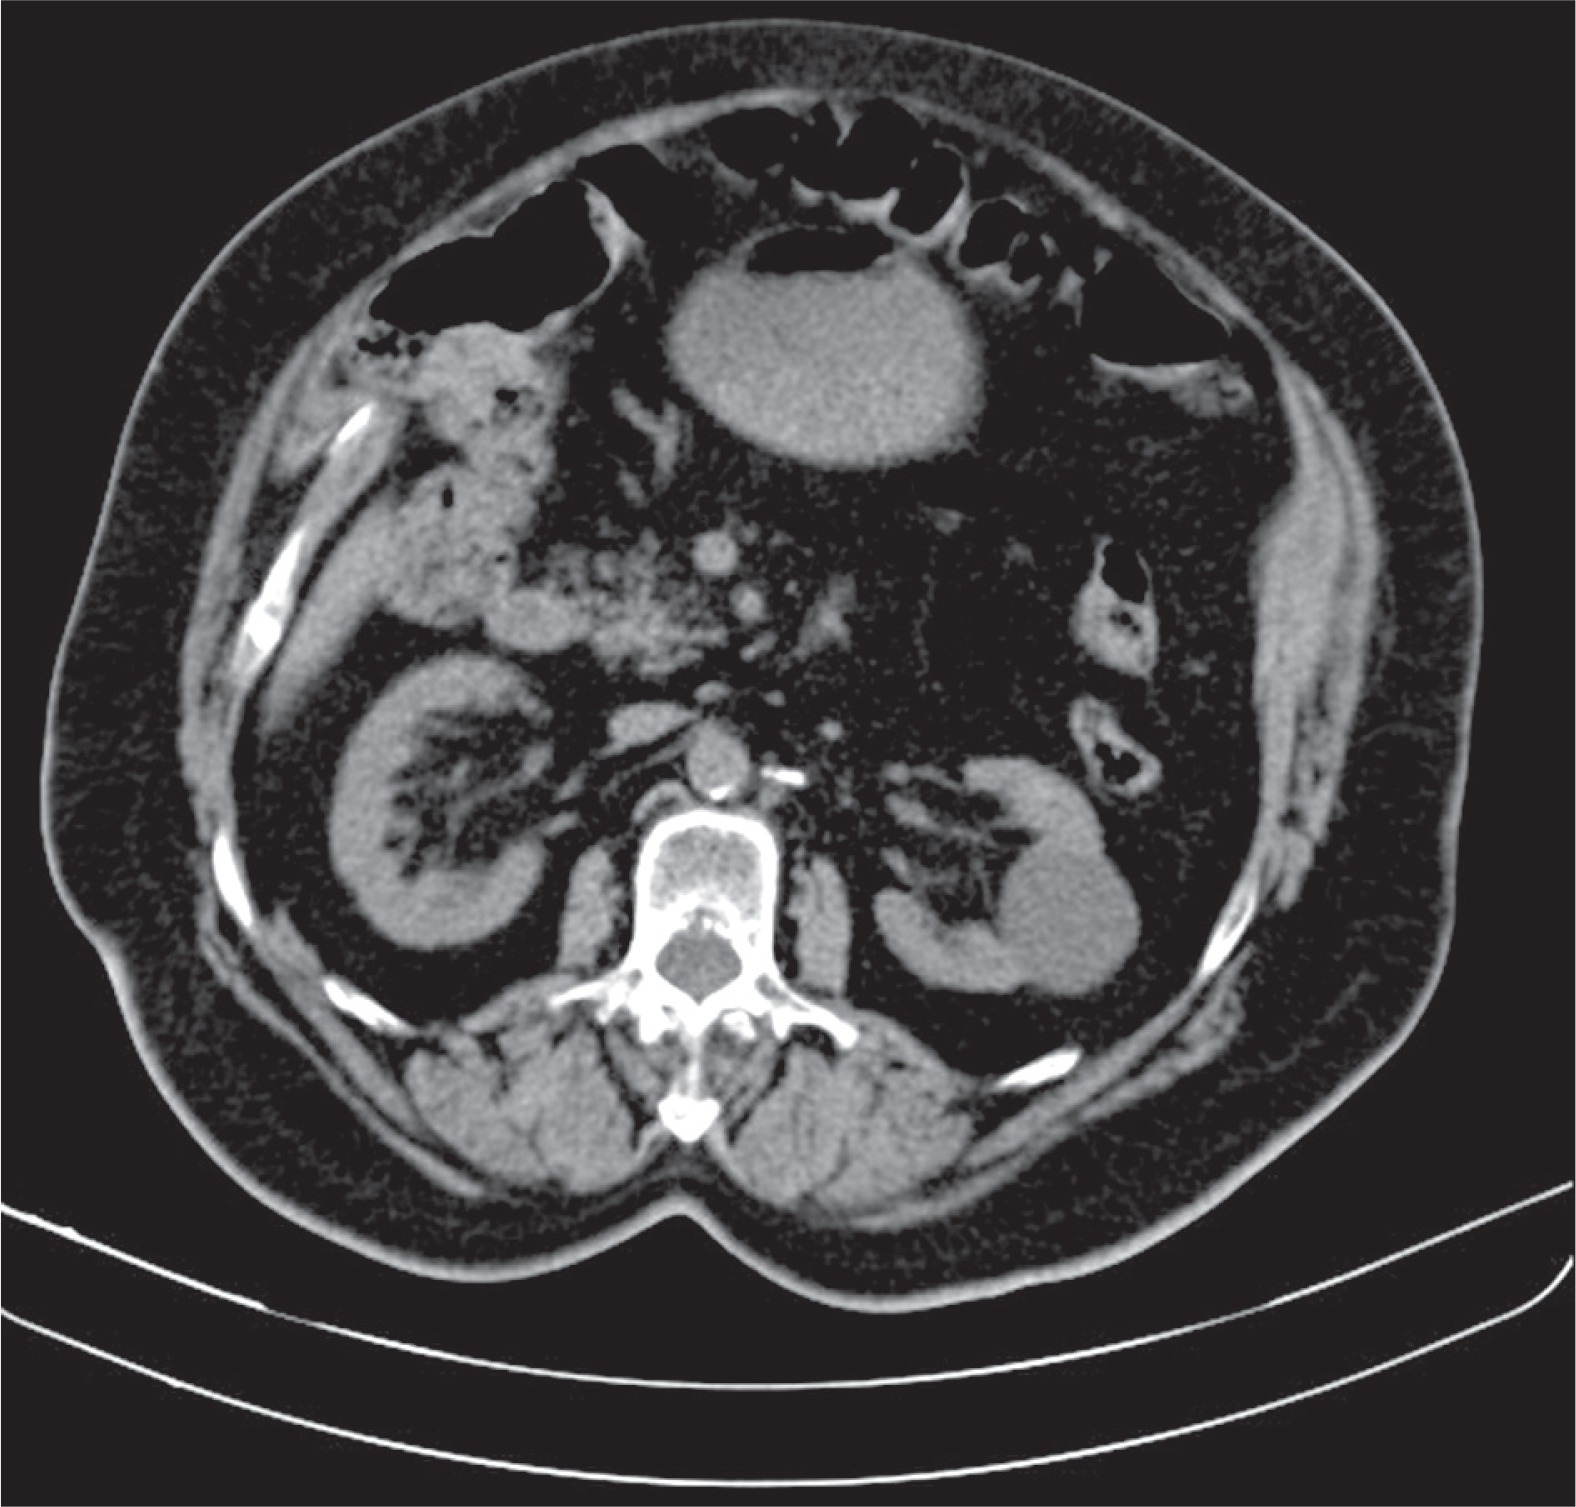
Figure 1
Computed tomography scan shows proliferation of fat in both renal sinuses in a 74-year-old woman
The data relating to the levels of serum fasting glucose, total cholesterol level, triglyceride level, high-density lipoprotein (HDL) cholesterol level, low-density lipoprotein (LDL) cholesterol level, very low-density lipoprotein (VLDL) cholesterol level, the diagnoses of type 2 diabetes mellitus (T2 DM) or hypertension (HT), and the use of antihypertensive therapy were obtained from the medical records of the patients in the study and control groups. Hypercholesterolaemia was defined as serum total cholesterol level > 200 mg/dl. Hypertriglyceridaemia was defined as serum triglyceride level ≥ 150 mg/dl. High LDL cholesterol level was defined as serum LDL cholesterol level ≥ 150 mg/dl, while low HDL cholesterol level was defined as serum HDL cholesterol level < 40 mg/dl for men or < 50 mg/dl for women. Having a VLDL cholesterol level > 40 mg/dl is accepted as reference for high VLDL cholesterol level. Impaired fasting glucose is defined as serum fasting glucose level > 100 mg/dl. T2 DM was identified based on the diagnoses documented in the medical records of the patients, namely by referring to a serum fasting glucose level > 126 mg/dl, or use of insulin or antidiabetic drugs. The patients who were detected to use antihypertensive drugs or those with a diagnosis of HT but who were not on antihypertensive therapy were considered to be HT patients. The diagnosis of MS was made according to the National Cholesterol Education Program’s Adult Treatment Panel III Report (NCEP-ATPIII) criteria [8] with the exception of waist circumference, as in the study by Lee et al. [8]. Diagnosis of MS required at least two of the following criteria; hypertriglyceridaemia, low HDL cholesterol level, arterial blood pressure ≥ 130/85 mmHg or treatment for hypertension, and fasting blood glucose level ≥ 100 mg/dl.
We performed all abdominal CT examinations with a Somatom Sensation 40 multi-detector CT scanner (Siemens Medical Solutions, 2010). We used the following parameters for all CT examinations: 125-150 kvP, 150-200 mAs, 25-30 cm FOV, 1-1.5 pitch range, 3-7 mm collimation. IV contrast-enhanced CT was performed on 38 patients. All of these patients underwent standard abdominal CT examination after a standard injection protocol (Iopamiro-Ultravist 300 mgl/MI). Injection rate has been 2-2.5 ml/s. Semi-automated assessment of the subcutaneous and the visceral fat compartments were performed through a dedicated software package. All abdominal fat measurements were made using the transverse cross-section images at umbilicus level, as previously described and validated [9,10]. The subcutaneous, visceral, and total fat areas were derived by software (Figure 2). By this means, the relationship between RSL and abdominal visceral fat, abdominal subcutaneous fat, total abdominal fat, high total cholesterol level, high LDL cholesterol level, high VLDL cholesterol level, high triglyceride level, low HDL cholesterol level, high glucose level, T2 DM, HT, and MS were examined.
Results
The ages of the cases ranged between 28 and 89 years, with an average of 58.43 ± 15.61 years. 41.7% of the cases (n = 30) were males and 58.3% (n = 42) were females. Distribution of the risk factors is shown in Table 1. The age, abdominal visceral fat, abdominal subcutaneous fat, and total fat were at statistically significantly higher levels in patients with RSL than in the patients without RSL (p < 0.001, p = 0.019, p < 0.001, p = 0.003, respectively). No effect of gender on RSL existence was observed (p > 0.05). Distribution of the age, abdominal visceral fat, abdominal subcutaneous fat, and total fat is shown in Table 2. In cases with low HDL cholesterol level, high LDL cholesterol level, high VLDL cholesterol level, high triglyceride level, high total cholesterol level, and high glucose level, RSL existence was observed at statistically significantly higher levels (p < 0.001, p < 0.001, p < 0.001, p < 0.001, p < 0.001, p < 0.001, respectively). In the presence of MS, DM, and HT, the presence of RSL, statistically, was observed to be at a significantly higher level (p < 0.001, p < 0.001, p = 0.009, respectively) (p < 0.001, p < 0.001, p = 0.009, respectively). The relation between risk factors and RSL is shown in Table 3. A logistic regression analysis was performed to examine the factors affecting RSL presence together. It was observed that the model formed as a result of the evaluation using the backward method proved to be statistically significant (χ2 = 63.102, p < 0.001). While the model’s rate of accuracy in estimating RSL – present cases was 91.4%, the rate of accuracy in estimating cases without RSL (the specificity) was 89.2%. The overall accuracy was 90.3%. It was observed that age, high total cholesterol level, high glucose level, and abdominal subcutaneous fat variables were included in the obtained model. According to the findings, a unit increase in age value increased the probability of occurrence of RSL by 1.072-fold (OR [95% CI]: 1.072 [1.001, 1.148], p = 0.048). The likelihood of RSL in the presence of high total cholesterol level was 9.261 times higher than in the absence of high total cholesterol level (OR [95% CI]: 9.261 [1.477, 58.070], p = 0.017). The probability of RSL in cases with high glucose level was observed to be 34.197 times higher when compared to the cases without high glucose level (OR [95% CI]: 34.197 [4.167, 280.658], p = 0.001). It was shown that an increase of a single unit of abdominal subcutaneous fat value increased the likelihood of the occurrence of RSL by 1.017-fold (OR [95% CI]: 1.017 [1.006, 1.027], p = 0.002). The results of logistic regression analysis are shown in Table 4.
Table 1
Distribution of the risk factors
| Parameter | n | % |
|---|---|---|
| Gender (M/F) | 30/42 | 41.7/58.3 |
| RSL | 35 | 48.6 |
| HDL (low) | 29 | 40.3 |
| LDL (high) | 19 | 26.4 |
| VLDL (high) | 18 | 25.0 |
| Triglyceride (high) | 23 | 31.9 |
| Total cholesterol (high) | 35 | 48.6 |
| Glucose (high) | 40 | 55.6 |
| MS | 33 | 45.8 |
| DM | 20 | 27.8 |
| HT | 36 | 50.0 |
Table 2
Age, visceral fat, subcutaneous fat, and total fat distribution
| Parameter | Mean ± SD | Min-Max |
|---|---|---|
| Age | 58.43 ± 15.61 | 28.00-89.00 |
| Visceral fat (m2) | 302.35 ± 481.44 | 21.61-2944.88 |
| Subcutaneous fat (m2) | 257.38 ± 104.79 | 20.47-483.50 |
| Total fat (m2) | 559.72 ± 519.82 | 55.46-3277.48 |
Table 3
Relation between risk factors and renal sinus lipomatosis
| Parameter | RSL (+) | RSL (–) | p |
|---|---|---|---|
| Mean ± SD | Mean ± SD | ||
| Age | 65.46 ± 11.32 | 51.78 ± 16.32 | < 0.001**a |
| Visceral fat | 442.32 ± 628.96 | 169.94 ± 2155.00 | 0.019*a |
| Subcutaneous fat | 302.82 ± 89.83 | 214.39 ± 100.63 | < 0.001**a |
| Total fat | 745.14 ± 645.41 | 384.33 ± 272.86 | 0.003**a |
| Gender, n (%) | |||
| Male | 15 (50) | 15 (50) | 0.842b |
| Female | 20 (47.6) | 22 (52.4) | |
| HDL, n (%) | |||
| Normal | 13 (30.2) | 30 (69.8) | < 0.001**b |
| Low | 22 (75.9) | 7 (24.1) | |
| LDL, n (%) | |||
| Normal | 18 (34) | 35 (66) | < 0.001**b |
| High | 17 (89.5) | 2 (10.5) | |
| VLDL, n (%) | |||
| Normal | 18 (33.3) | 36 (66.7) | < 0.001**b |
| High | 17 (94.4) | 1 (5.6) | |
| Triglyceride, n (%) | |||
| Normal | 14 (28.6) | 35 (71.4) | < 0.001**b |
| High | 21 (91.3) | 2 (8.7) | |
| Total cholesterol, n (%) | |||
| Normal | 8 (21.6) | 29 (78.4) | < 0.001**b |
| High | 27 (77.1) | 8 (22.9) | |
| Glucose, n (%) | |||
| Normal | 3 (9.4) | 29 (90.6) | < 0.001**b |
| High | 32 (80) | 8 (20) | |
| MS, n (%) | |||
| No | 7 (17.9) | 32 (82.1) | < 0.001**b |
| Yes | 28 (84.8) | 5 (15.2) | |
| DM, n (%) | |||
| No | 17 (32.7) | 35 (67.3) | < 0.001**b |
| Yes | 18 (90) | 2 (10) | |
| HT, n (%) | |||
| No | 12 (33.3) | 24 (66.7) | 0.009**b |
| Yes | 23 (63.9) | 13 (36.1) | |
Discussion
Renal sinus lipomatosis was first reported in the medical literature by Peacock and Balle [11]. Although the cause has not been fully explained, it can be seen in cases such as progressive age, obesity, Cushing’s disease, and steroid use [12]. In contrast to renal replacement lipomatosis, the mass effect caused by RSL rarely causes clinical symptoms, because renal caliceal obstruction does not result from simple lipomatosis [13]. Furthermore, RSL does not manifest a marked atrophy, destruction, or accompanying stone in the kidney. Renal sinus lipomatosis is rapidly visible through ultrasound, CT, and MR examinations of the kidney. Computed tomography and MRI can show fatty components that are directly involved in RSL [14]. However, CT is superior to MRI in identifying fat tissue with low attenuation values. Proliferation of fatty tissue (s) in the renal sinus can be clearly assessed on CT scan [3].
MS includes a number of metabolic parameters that are related to increased cardiovascular risks [15]. Metabolic risk factors include visceral obesity, high blood pressure, high blood glucose level, and high blood triglyceride level. Treatments for HT, T2 DM, and hypertriglyceridaemia are also included [16].
A few studies have reported the relationship between renal sinus fat volume, cardiovascular risk factors, and visceral adipose tissue volume [6,7]. Murakami et al. [6] argued that renal sinus fat volume correlated moderately with visceral fat volume. They showed a poor correlation between renal sinus fat volume and HDL cholesterol and HT. Chughtai et al. [7] found a relationship between renal sinus fat volume, the number of prescribed antihypertensive medications, and stage II hypertension. However, no study in the literature investigated the relationship between RSL, metabolic risk factors, abdominal visceral fat, and abdominal subcutaneous fat.
In the present study, we found that low levels of HDL cholesterol, and high levels of LDL cholesterol, VLDL cholesterol, triglyceride, total cholesterol, and glucose were statistically significantly higher in patients with RSL. In the presence of MS, T2 DM, and HT, the levels of RSL were statistically significantly higher. Age, abdominal visceral fat, abdominal subcutaneous fat, and total abdominal fat were at statistically significantly higher levels in RSL-present patients than in RSL-absent patients. In the logistic regression analysis, however, we found that only age, high total cholesterol level, high glucose level, and abdominal subcutaneous fat were associated with the presence of RSL.
There are some limitations to our study. First, we could not evaluate the relation between waist circumference and RSL presence because our study was retrospective. Second, the small sample size of the study may have had a limiting effect on our findings.
Conclusions
In conclusion, this is the first study to evaluate the relationship between RSL and metabolic risk factors, abdominal visceral fat and abdominal subcutaneous fat. Our findings demonstrate an association between the presence of RSL and age, high total cholesterol level, high glucose level, and abdominal subcutaneous fat. These findings suggest that radiologists should show due care about RSL presence when reporting USG, CT, and MRI examinations, and that they should give place to RSL in their reports when they detect it in radiological examinations. The findings also suggest that clinicians should be on full alert for the relationship between RSL and metabolic factors in cases where RSL is detected. However, we think large-N studies are needed to more accurately explain the relationship between RSL and abdominal subcutaneous fat, abdominal visceral fat, and metabolic factors.