


Introduction
Cervical cancer is the fourth most common tumour in women. In 2018, there were approximately 570,000 new cases (incidence 10.4%) of cervical cancer with 311,365 deaths yearly (mortality 4.1%), worldwide. In less-developed countries, cervical cancer is the second most common cause of cancer (incidence 18.2%) and death (mortality 12.0%) [1].
Involvement of pelvic and/or para-aortic lymph nodes (LNs) was included in the latest International Federation of Gynaecology and Obstetrics (FIGO) staging system as stage IIIC, divided into IIIC1 (pelvic lymph nodes meta-stases) and IIIC2 (para-aortic lymph nodes meta-stases) [2]. Consequently, assessment of metastatic LNs is crucial to guarantee the optimal treatment option and the most accurate prognosis prediction [3].
Computed tomography (CT), magnetic resonance imaging (MRI), and 18F-fluorodeoxyglucose positron emission tomography/computed tomography (18F-FDG-PET/CT) are the imaging techniques used to investigate the LN status in patients with locally advanced cervical cancer (LACC) [4-6]. In CT and MRI images, the nodal status assessment is based on the size, aspect, shape, presence of central necrosis, and other features identified using contrast agents [7].
In PET/CT images, focally increased FDG uptake in the LN is indicative of malignancy. For nodal assessment in patients with cervical cancer, a recent meta-analysis reported sensitivity (SS) and specificity (SP) values of 57% and 91% for CT, 54% and 93% for MRI, and 66% and 97% for PET/CT, respectively [7]. MRI is routinely performed in cervical cancer staging and can provide quantitative assessment, made possible measuring apparent diffusion coefficient (ADC) [8]. Lately, several studies have sustained the usefulness of DW-MRI and ADC values in recognising metastatic LNs [7].
The aim of this study was to evaluate the feasibility of ADC-based criteria (ADC, rADC, and cADC) for the detection of pelvic metastatic LNs and to determine the ADC cut-off value to differentiate metastatic LNs in patients with LACC.
Furthermore, a systematic review of the data available in the literature about the diagnostic performance of DW-MRI for detecting LN metastases in patients with cervical cancer was included in the study.
Material and methods
Study protocol
The present retrospective study is founded on data gather-ed in a single-centre prospective study that intended to find out the role of DW-MRI in foretelling the pathological response of the primary tumour in patients with histologically documented LACC, who underwent neoadjuvant chemoradiation therapy (CRT) followed by radical hysterectomy. The Local Ethics Committee approved the present trial (N.A.616/CE/2010), and written informed consent agreement was obtained from each patient to undergo all the practises and to collect their data [4,9,10]. The protocol of the original study included 3 assessments of the same patient, including DW-MRI and PET/CT: before treatment (baseline), after 2 weeks of neoadjuvant treatment, and 5 weeks after the end of treatment [4,9-12]. However, in the present study, only DW-MRI and PET/CT data obtained at baseline evaluation were considered.
Patient population
From October 2010 to June 2014, 108 consecutive patients with histologically proven cervical cancer (any histology) and staged IB2-IVA (FIGO classification 2009) were enrolled.
Further inclusion criteria were age 18-75 years, Eastern Cooperative Oncology Group (ECOG) performance status 0-1, adequate bone marrow function (white blood cell count > 3000 cells/mm3; platelets > 120,000 cells/ mm3), adequate renal function (blood urea nitrogen < 25 mg/dl; creatinine < 1.5 mg/dl), and normal liver function (bilirubin < 2 mg/dl).
Exclusion criteria were prior or simultaneous malignancies at other locations except for basal or squamous cell carcinoma of the skin and severe infection and/or non-malignant medical problems that would limit full compliance with the study.
According to the staging work-up of the original study protocol, LN metastases were assessed with PET/CT. Because histological confirmation of the LN status was not available before the start of treatment, PET/CT results on LN assessment were used for validation of DW-MRI results.
Magnetic resonance imaging protocol
Patients underwent 1.5-T MRI (Echospeed Horizon and Infinity, GE Medical Systems) using the body coil and an 8-channel cardiac phased-array coil. Intramuscular butylscopolamine (Buscopan 1 mg, Schering) was admini-stered to all patients before the examination to reduce bowel peristalsis. Exams included morphological sequences and DWI: axial T1-weighted spin echo (SE) sequence and T2-weighted fast spin echo (FSE) sequences according to different planes (sagittal/axial/oblique axial and oblique coronal). DWI was acquired with a single-shot spin echo echo-planar imaging sequence with two b values (0 and 800 s/mm2) angled as axial oblique FSE T2-weighted images (WI). Axial T2-WI FRFSE was acquired up to the kidneys, to assess the eventual presence of lumbo-aortic LNs.
Positron emission tomography/computed tomography protocol
Patients fasted for 6 hours, had glucose levels < 200 mg/dl, and were hydrated with 500 ml of saline solution before intravenous injection of 18F-FDG (4 MBq/kg). PET/CT images were acquired by using a 3D Gemini GXL scanner (Philips Medical Systems) at 60 min (± 10 min) after FDG injection (3 min/bed position) from the skull base to the mid-thigh. A low-dose CT scan (120 KeV, 80 mA) was acquired for attenuation correction and anatomical localization. Images were reconstructed using the line-of-response row-action maximum likelihood algorithm (3 iterations and 33 subsets, voxel size: 4 × 4 × 4 mm3).
A LN was defined positive in the presence of increased 18F-FDG uptake higher than the surrounding background, regardless of the size of the LN on CT images.
Images analysis
Two radiologists with 10 years’ experience in female pelvis MRI revised the conventional and DW-MRI examinations in consensus on a Picture Archiving and Communication System (PACS) (Centricity, GE Medical Systems, Milwaukee, WI, USA).
Size-based evaluation
First, axial pelvic T2-WI was evaluated. All PET-positive LNs were depicted on axial T2-WI, which was used to determine the location and size of the LN. The pelvic LN area was divided as follows: the common iliac region, external iliac region, internal iliac region, obturator region, and inguinal region [13-15]. Axial LN short and long axis (SA, LA) were measured, and the SA/LA ratio was calculated. The same evaluation was performed for PET-negative LNs with SA > 5 mm, detected in the same patients, representing the control group of our study.
ADC-based evaluation
Axial pelvic DWI was obtained on the same axis as pelvic T2-WI. The same LNs evaluated on axial T2-WI were depicted on DWI and on an ADC map. Then, the ADC value was measured node-by-node both for PET-positive (Figure 1) and PET-negative LNs (Figure 2). The ADC map was obtained by a designated workstation (Advantage Workstation 4.6; GE Medical Systems, Milwaukee, WI, USA) and investigated using the Functool dynamic analysis tool (GE Medical Systems). To calculate the mean ADC, 3 circular regions of interest (ROIs) were placed on each LN. The mean ADC value among 3 ROI measurements was calculated (ADC) and used for statistical analysis. To calculate the correct ADC value (cADC), a ROI was placed in the right gluteus maximum muscle. The cADC value was obtained from the division between the ADC value of the LN and the ADC value of the gluteus maximum muscle. Then, the ADC value of the primary tumour was measured in the same way. The relative ADC value (rADC) was calculated by subtracting the mean ADC value of the primary tumour from the mean ADC value of the LN.
Figure 1
42-year-old woman with squamous cervical carcinoma. A) Combined positron emission tomography/computed tomography (PET/CT) image showing increased 18F-fluorodeoxyglucose (18F-FDG) uptake of a left obturator lymph node (LN) (arrow). B) Axial T2-weighted fast-spin echo (T2W-FSE) image: the LN (arrow) has short axis of 12 mm and inhomogeneous signal intensity due to presence of necrosis. C) Diffusion-weighted (DWI) image of the same LN (arrow) showing mildly inhomogeneous signal intensity. D) Apparent diffusion coefficient (ADC) map shows same heterogeneity. The ADC value of the LN was 0.884 × 10⁻³ mm2/s
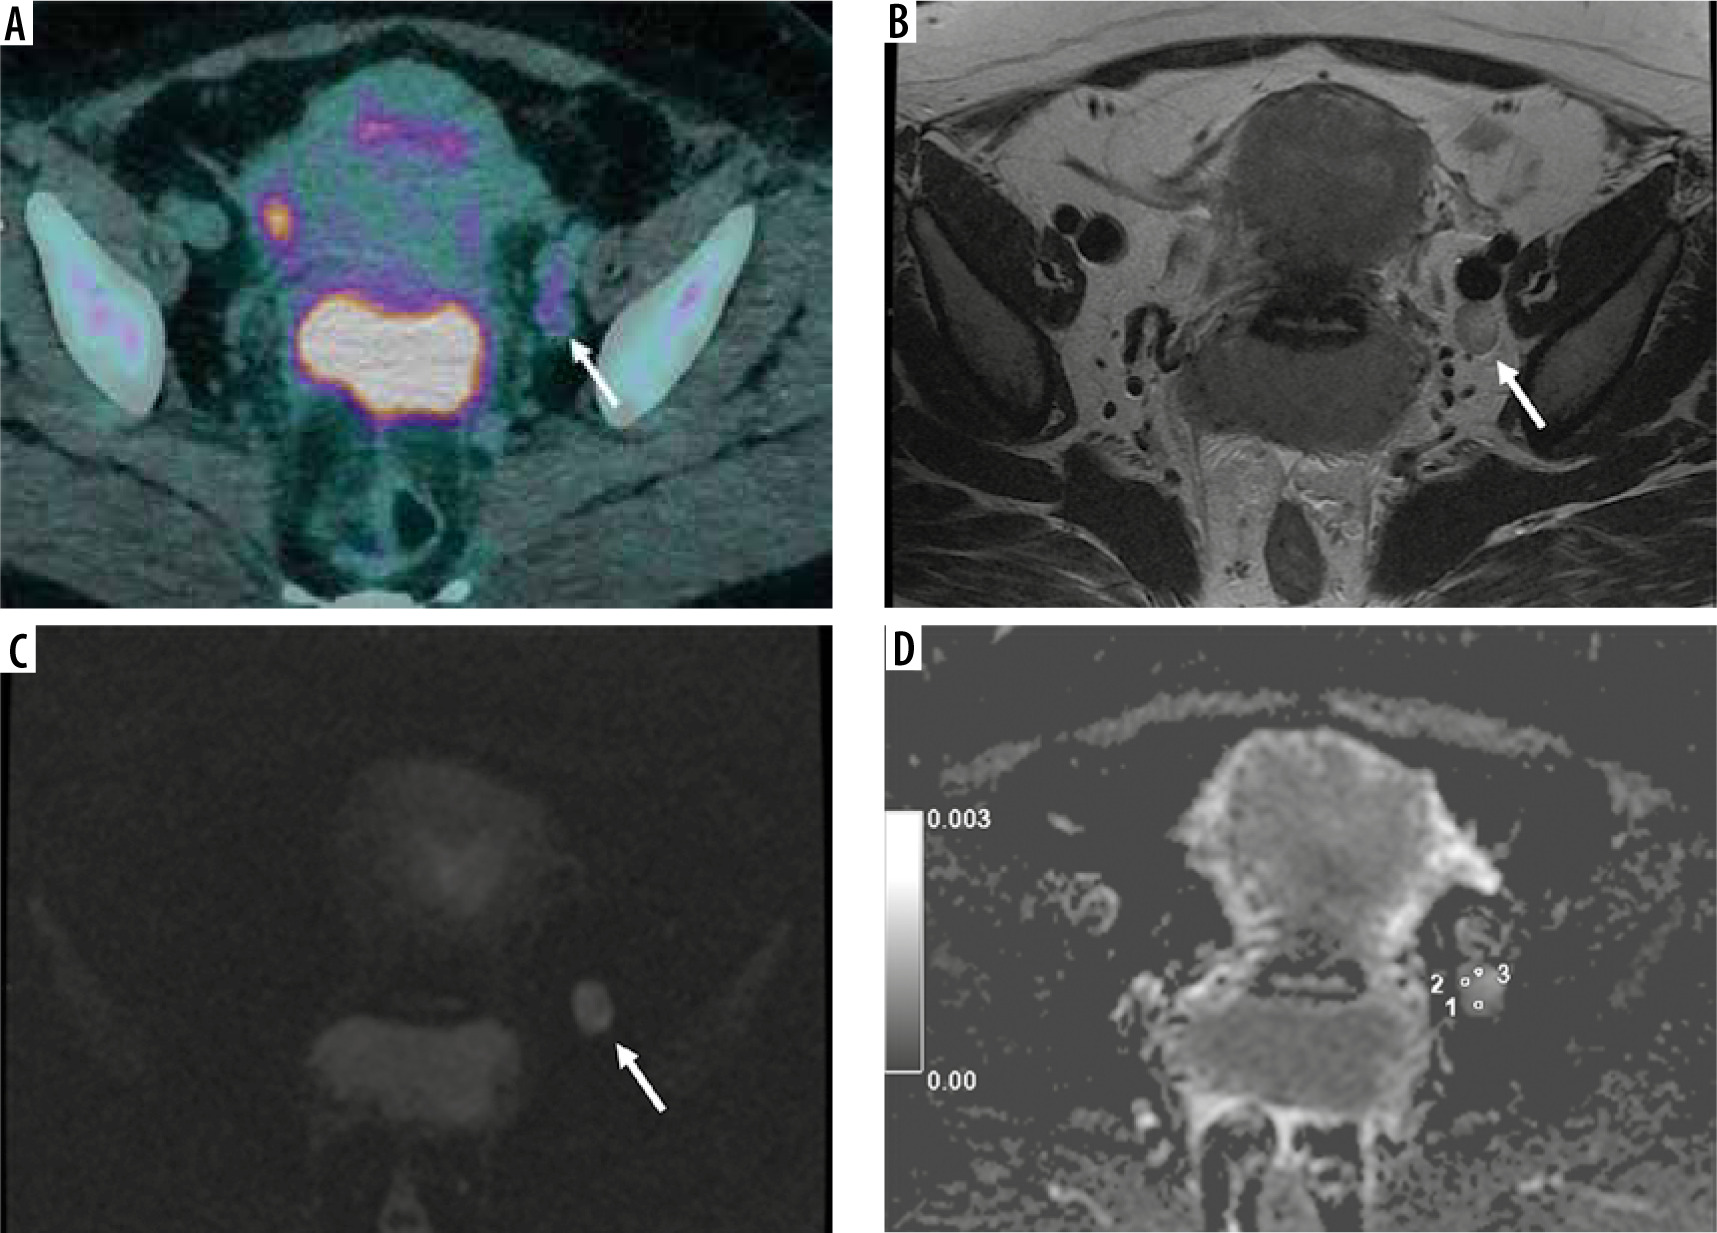
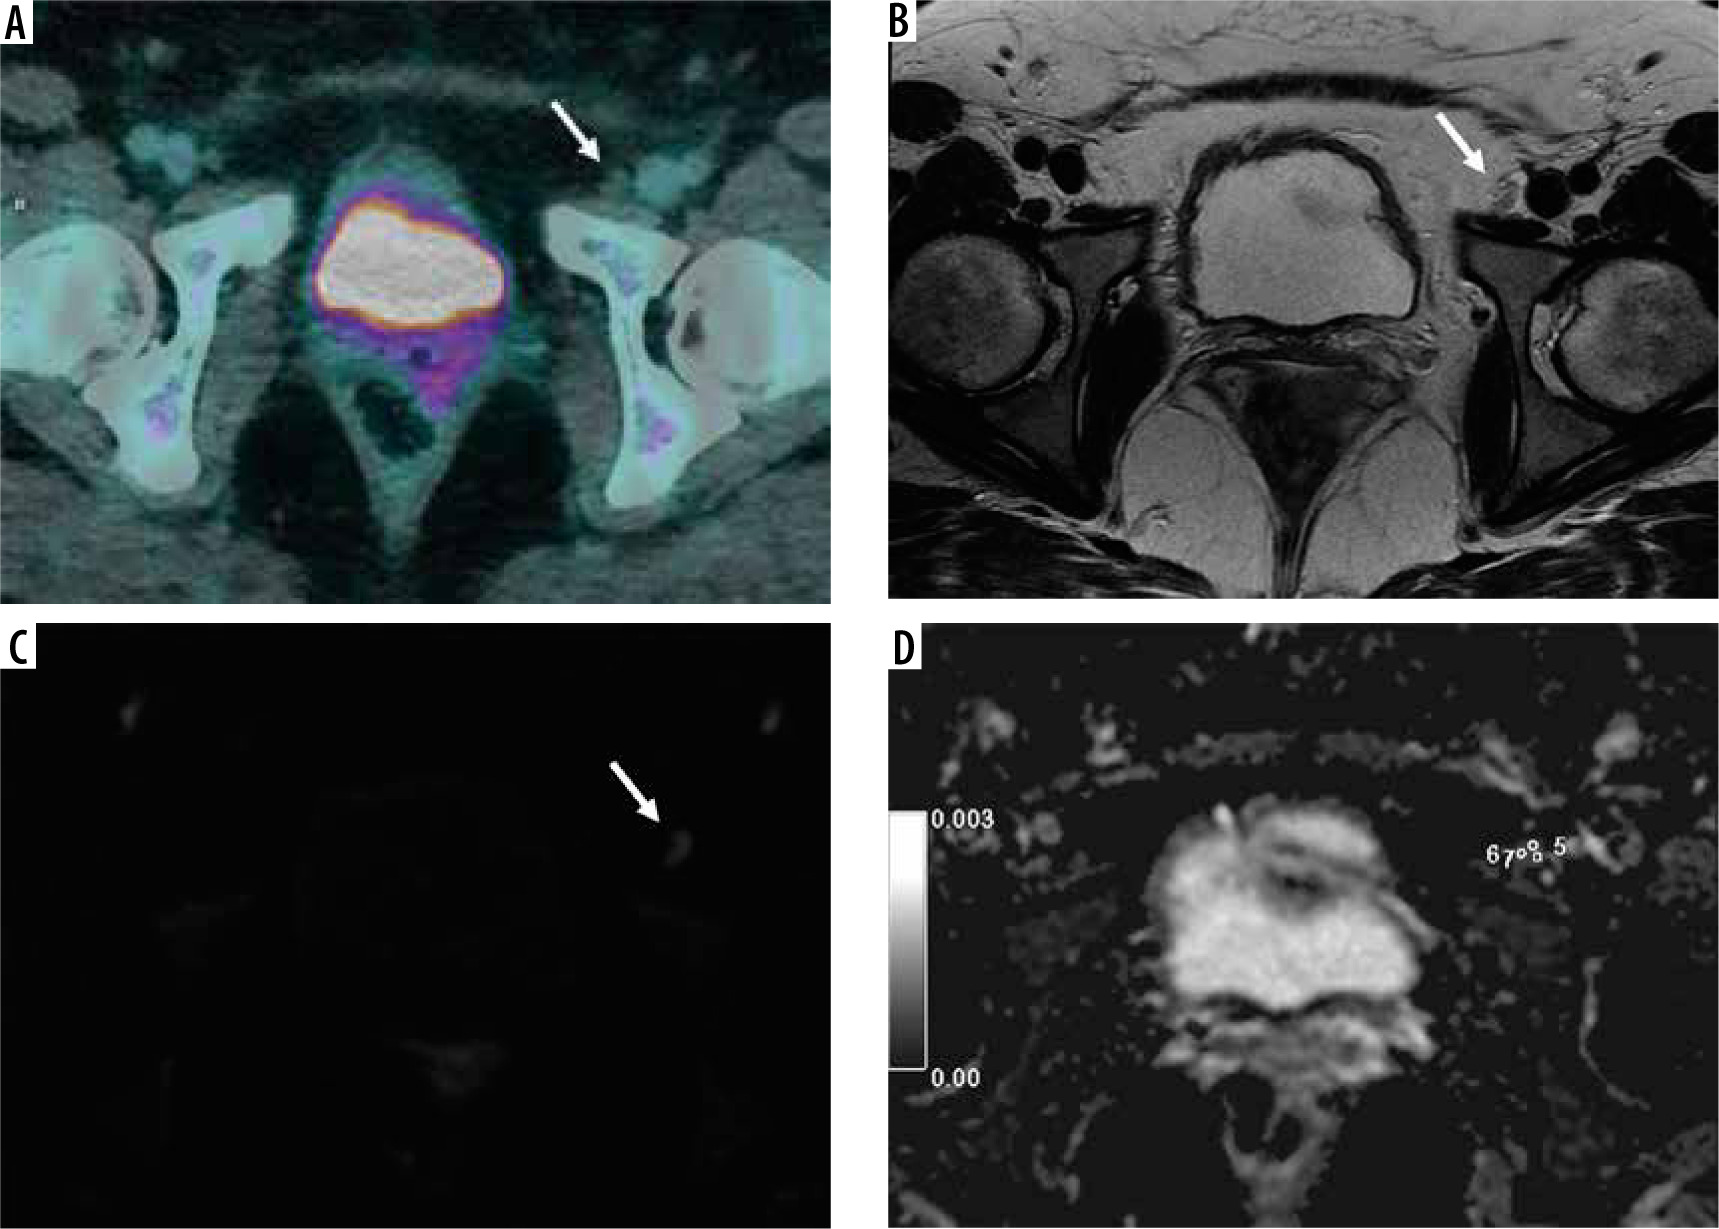
Figure 2
42-year-old woman with squamous cervical carcinoma. A) Combined positron emission tomography/computed tomography (PET/CT) image showing negative left external iliac lymph node (LN) (arrow). B) Axial T2-weighted fast-spin echo (T2W-FSE) image: the same left external iliac LN (arrow) with short axis of 6 mm showing normal appearance. C) Diffusion-weighted (DWI) image of the same LN (arrow) showing no significant diffusion restriction. D) Apparent diffusion coefficient (ADC) map. The ADC value of the LN was 1.270 × 10⁻³ mm2/s
Statistical analysis
All statistical analyses were performed with Statistical Package for the Social Sciences software (SPSS Statistic version 24.0; SPSS, Chicago, IL, USA). LNs were divided into 2 groups according to the PET/CT status: PET-positive and PET-negative. The results are presented as the mean and the median value of SA, LA, SA/LA ratio, ADC, rADC, and cADC. First, a normality test was performed. Comparisons between the 2 groups were made with a Mann-Whitney U test and Student’s t-test, as appropriate. Receiver operating characteristic (ROC) curves were created for each ADC-based parameter to calculate the area under the ROC curve (AUC) and to establish which could better distinguish the LNs. The cut-off points were chosen using the Youden index, according to the following formula: Youden index = sensitivity + specificity –1. The highest values were selected as threshold values. After-ward, the sensitivity and specificity of the threshold value for each parameter were determined. Pearson’s c2 test and Exact Fisher test were used to compare these parameters. The significance threshold was set at p < 0.05.
Literature search
During the study, we conducted a systematic review of the published literature from 2008 to 2020, searching several electronic databases: Pubmed, Cochrane library, Scopus, and Embase. The investigation comprised combined key words and exploded Medical Subject Headings (MeSH). We concentrated on the following terms: “uterine cervical neoplasms”, “lymph node”, “magnetic resonance imaging” or “MRI”, “DWI”, and “ADC”. The inclusion criteria were: 1) English-language human-based studies; 2) sample size of study more than 10 patients; 3) histological diagnosis of cervical cancer (any histology); and 4) data available (1-mean or median ADC value, rADC, and/or cADC; or 2-sensitivity and specificity for an ADC, rADC, and/or cADC cut-off value).
Exclusion criteria were: 1) reported data not adaptable; 2) lack of histological diagnosis of cervical cancer; and 3) review or meta-analysis or comment.
Results
Patients’ characteristics
Between October 2010 and June 2014, 108 patients were enrolled in the study; 20 were excluded (16 declined early examination, 2 had progression of disease, and 2 died). Eighty-eight patients completed nCRT and underwent surgery. Among those, 40 patients out of 88 had one or more positive LNs at baseline PET/CT. Six out of forty patients were excluded because of the presence of artefacts in DWI images or because DWI sequence was unavailable. In conclusion, 34 patients were included (Figure 3).
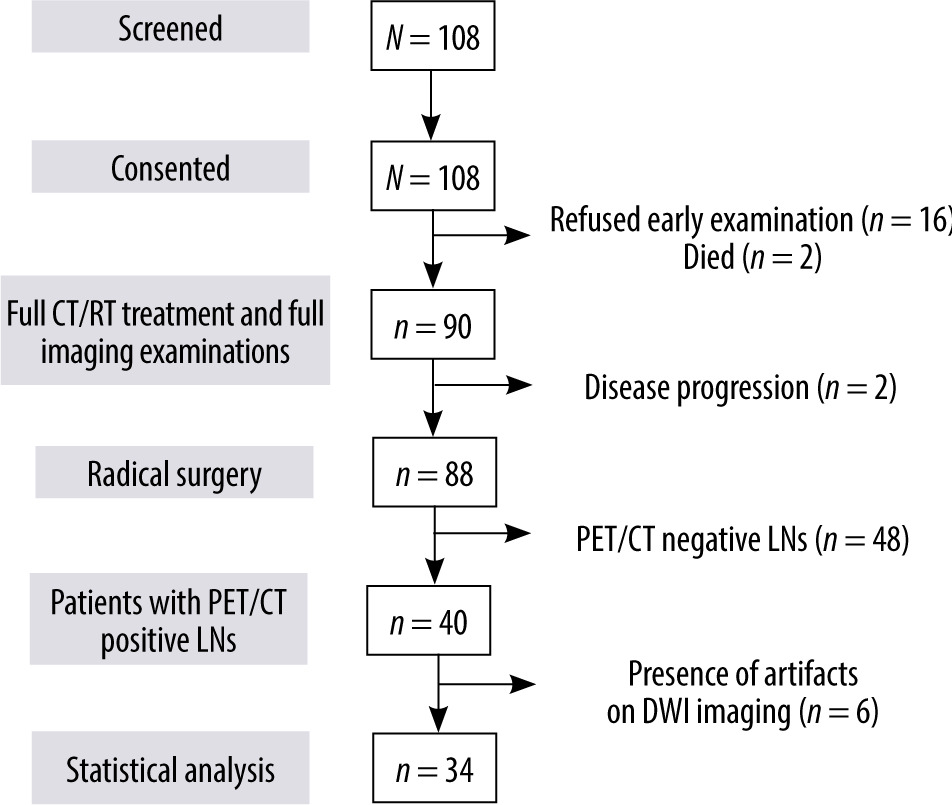
Table 1 contains clinical and pathological features of the study population.
Table 1
Clinical and pathological characteristics of the study population
A total of 105 LNs from 34 patients were considered for statistical analysis: 63/105 PET-positive LNs (60%) and 42/105 PET-negative LNs (40%). Fifty-five out of 63 PET-positive LNs were found in the obturator fossa.
Size-based results
The mean SA and LA of the PET-positive LNs were 10.3 ± 3.3 mm and 14.2 ± 3.5 mm. respectively. They were signifi-cantly higher than mean SA and LA of the PET-negative LNs, at 6.1 ± 0.4 mm and 11.2 ± 1.7 mm, respectively. The mean SA/LA ratio of the PET-positive LNs was significantly higher than that of the PET-negative LNs (0.72 ± 0.15 vs. 0.54 ± 0.09, respectively; p < 0.01).
The median SA value in the PET-positive group was 10 mm (7-12 mm), while in the PET-negative group it was significantly lower (6 mm). The median LA was significantly higher in PET-positive LNs than in PET-negative LNs: 14 mm (12-17 mm) vs. 12 mm (11-13 mm). The median SA/LA was also significantly higher in PET-positive than in PET-negative LNs: 0.8 (0.6-0.8) vs. 0.5 (0.4-0.6).
ADC-based results
The mean ADC value of PET-positive LNs (1.003 ± 0.382 × 10⁻³ mm2/s) was significantly lower than the mean ADC value of PET-negative LNs (1.305 ± 0.297 × 10⁻³ mm2/s). The mean rADC value of PET-positive LNs (0.170 ± 0.372 × 10⁻³ mm2/s) was also significantly lower than that of PET-negative LNs (0.477 ± 0.332 × 10⁻³ mm2/s). The mean cADC of the PET-positive LNs was also significantly lower than that of the PET-negative LNs (1.265 ± 0.466 vs. 1.647 ± 0.526, respectively; p = 0.01).
The median ADC value in the PET-positive group was 0.907 × 10⁻³ mm2/s (0.780-1.080), while in the PET-negative group it was 1.275 × 10⁻³ mm2/s (1.063-1.525). The median rADC value was significantly lower in the PET-positive group than in the PET-negative group: 0.120 × 10⁻³ mm2/s (-0.060 – 0.270) vs. 0.435 × 10⁻³ mm2/s (0.225-0.673). The median cADC value was also lower in the PET-positive than in the PET-negative group: 1.130 (0.980-1.420) vs. 1.615 (1.210-1.993), respectively. ADC-based parameter values are reported in Table 2.
Table 2
ADC-based parameters in both PET-positive and PET-negative groups, presented as mean ± SD and median (range). Minimum and maxi-mum value for each parameter is also reported
ROC analysis and ADC-based threshold determination
The ROC analysis indicated that SA and the SA/LA ratio had the highest diagnostic value (AUC 0.932 and 0.824, respectively). According to the ROC analysis of size-based values, the thresholds used were as follows: SA < 7.5 mm; LA < 13.5 mm; and SA/LA < 0.65. SA showed the highest sensitivity, specificity, positive predictive value (PPV), negative predictive value (NPV), and accuracy (SS 74.6%; SP 100%; PPV 100%; NPV 72.4%; ACC 84.8%).
ADC showed the highest diagnostic value (AUC 0.808), followed by rADC (AUC 0.779) and cADC (AUC 0.744). According to the ROC analysis of ADC-based values, the following thresholds were used: ADC < 1.149 × 10⁻³ mm2/s; rADC < 0.285 × 10⁻³ mm2/s; cADC < 1.375.
ADC showed the best sensitivity, specificity, PPV, NPV, and accuracy (SS 81.0%; SP 71.4%; PPV 81.0%; NPV 71.4%; ACC 77.1%). The comparison of sensitivity, specificity, PPV, NPV, and accuracy between PET-positive and PET-negative groups for both size- and ADC-based values is shown in Table 3.
Literature search
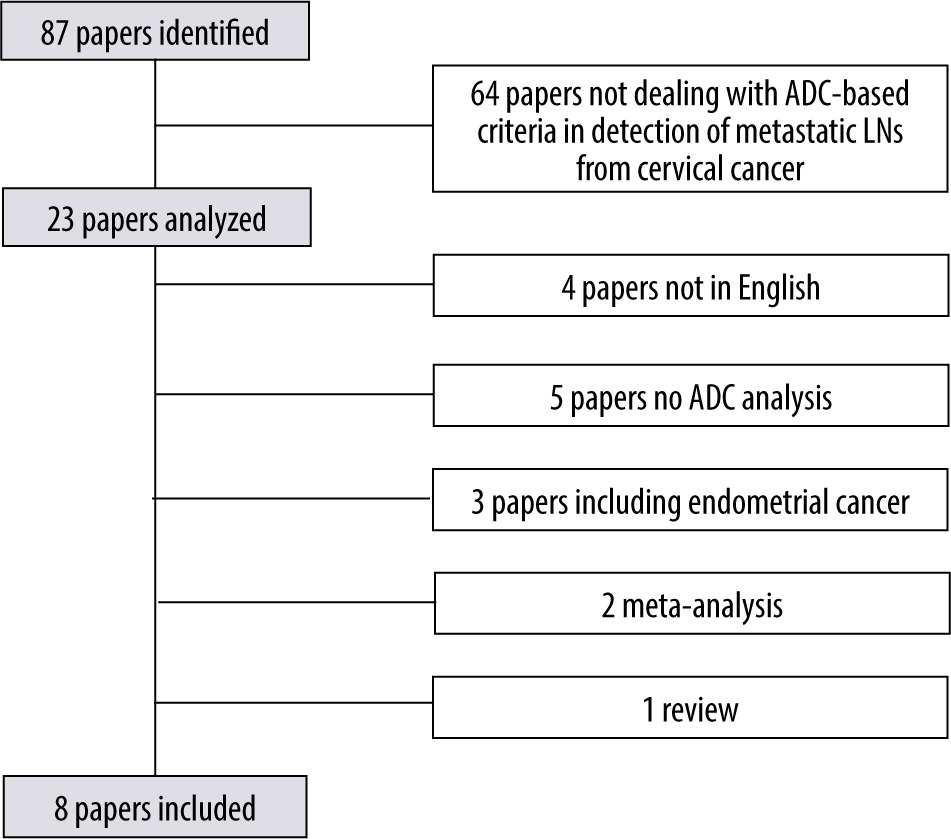
The search conducted involved 23 papers. After that, 4 papers were excluded because they were not in English, 5 papers in which LN ADC values were not analysed, 3 papers including patients with endometrial cancer, 1 paper missing LNs regions definition, 2 meta-analyses, and 1 review (Figure 4). Eight papers were finally included.
Discussion
This study demonstrated that both mean and median ADC and rADC values of metastatic (PET/CT-positive) LNs were significantly lower than those of non-metastatic (PET/CT-negative) LNs (1.003 ± 0.382 × 10⁻³ mm2/s vs. 1.305 ± 0.297 × 10⁻³ mm2/s). Regarding ADC values, the AUC for both ADC (0.808) and rADC (0.779) was high. ADC can improve LN assessment on MRI. In fact, ADC and rADC measurements increased the MRI sensitivity in the detection of PET-positive LNs, reaching 81% and 76.2%, respectively, regarding the sensitivity of SA measurement (74.6% in our series).
One of the powerful aspects of the present study was that we conducted an accurate node-by-node evaluation and compared it to the reference standard. Many authors correlated LNs surgically dissected with imaging, designing an inexact region-by-region depiction. Using PET/CT as a reference, we can correctly identify the same LN both on PET/CT and on MRI.
Obturator LN is considered the sentinel LN of cervical cancer [16]. In our study, 55/63 (87%) PET-positive LNs were located in the obturator fossa. Another advantage is represented by the selection of a PET-negative control group in the same 34 patients, depicting LNs showing no 18F-FDG uptake with short-axis > 5 mm.
The present study has some limitations [17]. Some authors defined PET/CT unsatisfactorily as a gold standard, considering it cannot replace histology, especially for LNs with short axis of 5 mm or less. Kitajima et al. [18] analysed the low sensitivity of PET/CT in detecting small metastatic LNs, reporting a sensitivity value of 16.7 % for metastatic LNs 4 mm or less in diameter.
In our study, the use of a 5-mm short-axis cut-off was chosen based on these results about PET/CT accuracy. In addition, Sironi et al. [19] described good performance for PET/CT in the recognition of metastases in LNs with short axis larger than 5 mm (SS 100%; SP 99.6%). These 2 studies supported our decision to use PET/CT as the gold standard in patients with LACC treated with neoadjuvant CRT.
DWI has an intrinsic limitation regarding the reproducibility of the ADC value threshold. Tissue diffusivity depends on several factors, such as tissue pressure, personal magnetic environment, body temperature, and perfusion rate, contributing an effective difference in ADC value measurement in different patients [20]. Therefore, a standardised ADC would need to be reproducible, but in our data the ADC value provided better correlation than rADC and cADC, and greater sensitivity than size-based criteria, reducing the quantity of false-negative cases. The third limitation is represented by the small ROI area and its placement on an ADC map. However, no significant difference was reported in ADC measurement between the choice of a single ROI as large as the whole LN and a multi-ROI placement approach [21].
In the literature, different authors reported different cut-off values for ADC, rADC, and cADC. Table 4 includes a list of the results of the papers reviewed.
Table 4
Literature search results
| First author | Year | Tesla (T) | Reference technique | Patients no. | LNs no. | Parameters | Value | AUC | Cut-off value | Sensitivity (%) | Specificity (%) | PPV (%) | NPV (%) | Diagnostic accuracy (%) | p-value | |
|---|---|---|---|---|---|---|---|---|---|---|---|---|---|---|---|---|
| Metastatic LNs | Non-metastatic LNs | |||||||||||||||
| Kim [20] | 2011 | 1.5 | Histology | 143 | 680 | Mean ADC[× 10-3 mm2/s] | 0.839 | 1.022 | 0.854 | 0.911 | 83 | 77 | – | – | 77 | < 0.05 |
| Mean SA [mm] | 6.69 | 4.11 | 0.856 | 4.42 | 91 | 65 | – | – | 67 | < 0.05 | ||||||
| Mean LA [mm] | 10.56 | 7.65 | 0.753 | 7.61 | 81.4 | 56.7 | – | – | 59 | < 0.05 | ||||||
| Choi [24] | 2009 | 1.5 | PET/CT | 169 | 339 | Mean ADC [× 10-3 mm2/s] | 0.756 ± 0.172 | 1.019 ± 0.238 | 0.836 | – | – | – | – | – | – | – |
| Mean SA [mm] | 10.3 ± 4.5 | 7.4 ± 1.7 | 0.764 | 8.8 | 55 | 84 | 64 | 78 | 74 | < 0.05 | ||||||
| Mean LA [mm] | 13.2 ± 5.2 | 11.0 ± 3.5 | 0.640 | 10.1 | 73 | 50 | 44 | 44 | 58 | < 0.05 | ||||||
| Chen [22] | 2011 | 1.5 | Histology | 61 | 153 | Mean ADC [× 10-3 mm2/s] | 1.05 ± 0.20 | 1.29 ± 0.19 | 0.824 | 1.150 | 83.3 | 74.7 | 71.4 | 85.5 | 78.4 | < 0.01 |
| Mean rADC [× 10-3 mm2/s] | 0.19 ± 0.17 | 0.40 ± 0.21 | 0.806 | 0.28 | 80.3 | 72.4 | 68.8 | 82.9 | 75.8 | < 0.01 | ||||||
| Mean SA [mm] | 9.6 ± 3.6 | 7.6 ± 1.8 | 0.666 | 8.5 | 59.1 | 71.3 | 60.9 | 69.7 | 66 | < 0.01 | ||||||
| Mean SA/LA | 0.78 ± 0.14 | 0.70 ± 0.14 | 0.667 | 0.77 | 56.1 | 71.3 | 59.7 | 68.1 | 64.7 | < 0.01 | ||||||
| Liu [23] | 2011 | 1.5 | Histology | 42 | 188 | Mean ADC[× 10-3 mm2/s] | 0.858 ± 0.144 | 1.301 ± 0.179 | 0.974 | 1.075 | 91.3 | 91.5 | 77.8 | 97 | 91.5 | < 0.05 |
| Mean cADC | 0.685 ± 0.125 | 0.922 ± 0.163 | 0.976 | 0.721 | 84.8 | 91.5 | 76.5 | 93.2 | 89.9 | < 0.05 | ||||||
| Mean SA [mm] | – | – | 0.878 | 7.75 | 76.1 | 85.9 | 62.5 | 91 | 77.7 | < 0.05 | ||||||
| Mean LA [mm] | – | – | 0.858 | 8.9 | 93.5 | 66.2 | 47.3 | 96.9 | 72.9 | < 0.05 | ||||||
| Song [25] | 2018 | 3.0 | Histology | 92 | 126 | Mean ADC [× 10-3 mm2/s] | 0.98 ± 0.15 | 1.00 ± 0.18 | – | – | – | – | – | – | – | – |
| Wu [26] | 2017 | 3.0 | Histology | 50 | 158 | Mean ADC [× 10-3 mm2/s] | 0.82 ± 0.19 | 0.79 ± 0.14 | – | – | – | – | – | – | – | – |
| Mean SA [mm] | 8.26 ± 4.16 | 4.13 ± 1.31 | 0.844 | 5.8 | 61.0 | 89.7 | 67.7 | 86.7 | – | < 0.01 | ||||||
| Mean LA [mm] | 12.7 ± 6.51 | 9.11 ± 3.44 | 0.694 | 9.5 | 70.7 | 59.5 | 38.1 | 85.2 | – | < 0.01 | ||||||
| Mean SA/LA | 0.67 ± 0.21 | 0.50 ± 0.20 | 0.726 | 0.482 | 78.1 | 56.0 | 38.5 | 87.9 | – | < 0.01 | ||||||
| Park [27] | 2009 | 1.5 | Histology | 130 | 255 | Mean ADC[× 10-3 mm2/s] | 0.748 ± 0.160 | 0.966 ± 0.196 | 0.872 | 0.790 | 79 | 93 | – | – | – | < 0.01 |
| Mean cADC *(Renal cortex) | 0.382 ± 0.080 | 0.538 ± 0.111 | 0.914 | 0.423 | 86 | 93 | – | – | – | < 0.01 | ||||||
| Kim [28] | 2008 | 1.5 | Histology | 125 | 3625 | Mean ADC[× 10-3 mm2/s] | 0.7651 ± 0.1137 | 1.0021 ± 0.1859 | 0.902 | 0.862 | 87 | 80 | – | – | 81 | < 0.01 |
| Mean SA [mm] | 8.3 ± 5.5 | 6.4 ± 1.4 | – | – | – | – | – | – | – | – | ||||||
| Our experience | 2019 | 1.5 | PET/CT | 34 | 105 | Mean ADC [× 10-3 mm2/s] | 1.003 ± 0.382 | 1.305 ± 0.297 | 0.808 | 1.149 | 81.0 | 71.4 | 81.0 | 71.4 | 77.1 | < 0.01 |
| Mean rADC [× 10-3 mm2/s] | 0.170 ± 0.372 | 0.477 ± 0.332 | 0.779 | 0.285 | 76.2 | 71.4 | 80.0 | 66.7 | 74.3 | < 0.01 | ||||||
| Mean cADC | 1.265 ± 0.466 | 1.647 ± 0.526 | 0.744 | 1.375 | 73 | 66.7 | 76.7 | 62.2 | 70.5 | 0.01 | ||||||
| Mean SA [mm] | 10.3 ± 3.3 | 6.1 ± 0.4 | 0.932 | 7.5 | 74.6 | 100 | 100 | 72.4 | 84.8 | < 0.01 | ||||||
| Mean LA [mm] | 14.2 ± 3.5 | 11.5 ± 1.7 | 0.739 | 13.5 | 54.0 | 90.5 | 89.5 | 56.7 | 68.6 | < 0.01 | ||||||
| Mean SA/LA | 0.72 ± 0.15 | 0.54 ± 0.09 | 0.824 | 0.65 | 71.4 | 90.5 | 91.8 | 67.9 | 79 | < 0.01 | ||||||
To summarize, our results are comparable to those of Chen et al. [22] and Liu et al. [23].
Chen et al. [22] measured both ADC and rADC, using histology as the gold standard. Histology results were obtained analysing tissue samples from patients both with no previous treatment and after neoadjuvant radiotherapy and/or chemotherapy. Sixty-one patients with LACC and LNs with SA larger than 5 mm were included in this study. FIGO stagings were Ib, IIa, or IIb. This population was very similar to ours; in fact, the authors found similar cut-off values, 1.15 × 10⁻³ mm2/s for ADC and 0.28 × 10⁻³ mm2/s for rADC. Also, the sensitivity and specificity associated with these cut-off values were similar to ours. Sensitivity was 83.3% for ADC and 80.3% for rADC while specificity was 74.7% for ADC and 72.4% for rADC.
Liu et al. [23] analysed 42 patients (FIGO IB to IIB) and LNs with SA > 5 mm and calculated ADC and cADC. The ADC cut-off value was similar to ours (1.075 × 10⁻³ mm2/s) with sensitivity and specificity of 91.3% and 91.5%, respectively. cADC was calculated using the right gluteus maximum as the reference site, as we did, but the resulting cut-off value was 0.721 (vs. 1.375 in our series). The AUC for cADC was 0.976, which is higher than that of our series (0.744), making these 2 results not comparable.
Kim et al. [20] analysed 680 LNs (in 143 patients) without specifying the FIGO staging of the patients, treated with hysterectomy and lymphadenectomy. The ADC cut-off value was 0.911. It showed good sensitivity (83%) but lower than that for SA, which was 91%. The authors chose a low cut-off value for SA (4.42 mm). As a result, SA showed high sensitivity (91%) and low specificity (65%).
Choi et al. [24] used PET/CT as the gold standard. The ADC was measured by placing a single ROI as large as possible. The mean ADC value of PET-positive and PET-negative LNs were 0.756 ± 0.172 and 1.019 ± 0.238 × 10⁻³ mm2/s, respectively. The AUC for minimum ADC was greater than that for mean ADC. Then, the authors reported only minimum ADC cut-off value was 0.712 × 10⁻³ mm2/s. This value was evidently lower than any mean ADC value reported in the literature.
Song et al. [25] included in their study 92 patients (FIGO IB 61/92, IIA 27/92, III 1/92). In these patients, only LNs with short axis between 5 and 10 mm were analysed. The authors did not find statistically significant differences in mean ADC values between benign and metastatic LNs.
Wu et al. [26] included 50 patients and detected no significant difference in mean ADC values between metastatic and non-metastatic LNs.
Park et al. [27] included 130 patients with 255 LNs. Among these, only 29/255 LNs were metastatic at histology, while 226/255 were non-metastatic. They calculated ADC and cADC, using the renal cortex as the reference site, retrieving a mean ADC cut-off value of 0.790 × 10⁻³ mm2/s and a mean cADC cut-off value of 0.423, which was clearly different from ours.
Kim et al. [28] analysed 3625 LNs in 125 patients. Among these, only 60 LNs were metastatic. The mean ADC cut-off value was 0.790. This value is the lowest mean ADC cut-off value reported in the literature for differentiating metastatic from non-metastatic LNs.
In women with LACC, conventional MRI misses up to 30-50% of metastatic LNs that are not enlarged [29,30]. In these patients, DWI and ADC assume a clinically relevant role, because LN involvement became part of the FIGO staging [2]. LNs SA on MRI has traditionally been used for the detection of metastatic LNs. Moreover, in recent years, different authors reported different cut-off values of short-axis to distinguish metastatic LNs, ranging from 4.4 mm [20] to 10.3 mm [24]. According to most authors, pelvic LNs larger than 8 mm should be considered malignant [31,32]. Functional parameters deriving from DWI add tumour information for lymph node evaluation.
Also, the rADC value represents the connection existing between LN status and the primary tumour. It provides quantitative evaluation of the heterogeneity in diffusion restriction. As reported in the literature, the ADC value of the primary tumour can predict partial pathological response after CTRT in cervical cancer [9]. A hypothetic role for rADC in LN response evaluation has not been investigated yet, and future studies can be designed to investigate this role.
Conclusions
The present study confirmed that measurement of ADC and rADC of LNs would provide supplementary information helping to correctly classify patients according to FIGO. Using 1.149 × 10⁻³ mm2/s as the ADC cut-off value, MRI demonstrated high sensitivity. Presently, PET/CT represents the imaging modality of choice in depiction of lymph node metastases. ADC can be a useful tool for customizing diagnostic workflow in patients with cervical cancer, although larger series are necessary to validate our data.