


Introduction
Autoimmune hepatitis (AIH) is a chronic autoimmune disease with progressive necro-inflammatory liver disease that presents with clinical presentation varying from minor symptoms to acute liver failure. AIH is characterized biochemically by high level of transaminase, histologically by the presence of interface hepatitis, and serologically by a high level of immunoglobulin G (IgG) [1-4]. AIH is further subdivided into type I and type II, depending on the autoantibody profile: AIH type I is characterized by positivity for the anti-nuclear antibody (ANA) and/or anti-smooth muscle antibody (ASMA), and AIH type II is characterized by the presence of anti-liver kidney microsomal antibody type I (anti-LKM1) and/or anti-liver cytosol type 1 [5-9]. Overlap syndrome describes variant forms of AIH, which includes features of a combination of AIH, primary sclerosing cholangitis, and primary biliary cirrhosis. These disorders may present simultaneously or consecutively. AIH generally responds to immunosuppressive treatment. Liver biopsy remains the reference standard for the diagnosis and staging of AIH, but it is an invasive procedure with risk of complications [3-7]. Limited studies discuss the role of shear-wave elastography, magnetic resonance (MR) elastography, and MR spectroscopy in the diagnosis and monitoring of patients with AIH, but these results are preliminary and overlapping [10-13].
Diffusion tensor imaging (DTI) provides in-vivo tissue microstructure information by measuring the water diffusivity for a given voxel that can be represented by parameters such as the mean diffusivity (MD) and the fractional anisotropy (FA) [14-21]. Some studies have reported that DWI is a promising technique in the detection and quantification of hepatic inflammation and fibrosis in adults and children [22-24]. Some studies also discuss the role of DTI in the detection of fibrosis in hepatic fibrosis and biliary atresia [25-29]. One study reported that FA is more sensitive than MD for the diagnosis of mild-to-moderate liver fibrosis [25], and another study added that MD is helpful in detecting liver fibrosis but cannot differentiate different grades of hepatic fibrosis in neonates with biliary atresia [26]. Another recent study added that the diagnostic performance of MD 2 using only 2 b-values showed excellently diagnostic performance in the diagnosis of hepatic fibrosis [27]. To our knowledge, there is no previous literature discussing the role of DTI of the liver in children with AIH.
The aim of this study is to evaluate the role of DTI of the liver in children with AIH.
Material and methods
Patients
Informed consent from the parents of paediatric patients and controls and institutional review board approval were obtained. A prospective study was conducted on 44 successive untreated children with pathologically proven AIH according to Simplified Criteria for the Diagnosis of AIH in Children [9]. Two patients were excluded from the study because they did not complete the MR imaging. The final patients included 42 children (30 girls and 12 boys, with age range 8-16 years; mean age 13 years). Twenty age- and sex-matched healthy children (12 girls and 8 boys, with age range 7-16 years; mean age 12 years) were included as a control group. The children in the control group had no previous medical history or current liver disease and had normal liver function tests. DTI of the liver and laboratory tests (ANA, ASMA, and anti-LKM1) were done for patients and controls, and liver biopsy was done only for patients. The patients were AIH type I (n = 31) and type II (n = 11), and patients were with (n = 9) and without (n = 33) overlap syndrome.
Magnetic resonance imaging
MR imaging was done on a 1.5 T scanner (Ingenia, Philips, Philips Medical Systems, Best, Netherlands). Patients fasted for 4-6 hours prior to the study, and sedation was administered for children 7-10 years old, who were afraid of MR and to avoid motion artifacts (n = 25) using oral chloral hydrate (70-80 mg/kg body weight), and children older than 10 years (n = 39) were scanned without sedation. Patients and controls underwent axial T2-weighted Fast Recovery Fast Spin Echo sequence (TR/TE = 3200/110 ms) and T1-weighted images (TR/TE = 600/25 ms) of the liver. The scanning parameters were as follows: field of view (FOV) = 22-25 cm, section thickness = 7 mm, inter-slice gap = 1 mm, and data matrix = 256 × 224. DTI of the liver was done using a single-shot echo-planar imaging sequence (TR/TE = 3200/90 ms) with parallel imaging, automatic shimming, and chemical shift selective fat suppression technique. Diffusion gradients were applied along 32 axes, using a b-value of 0 and 1000 s/mm-2. The scanning parameters were FOV = 22 × 25 cm, slice thickness = 7 mm, inter-slice gap 20%, data matrix = 192 × 154, and the total scan time was 7-8 min.
Image analysis
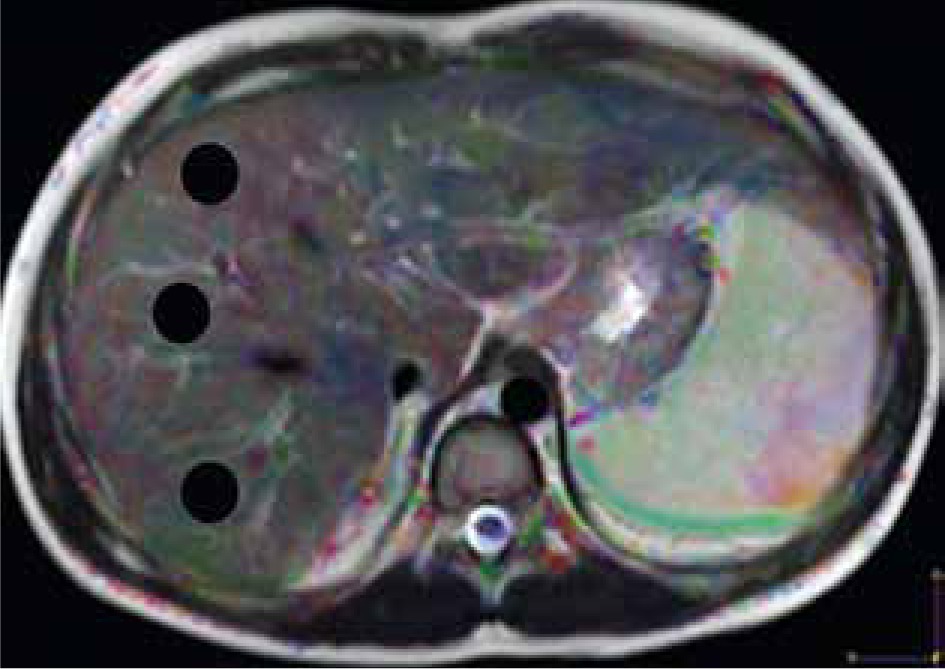
Image analysis was performed by one radiologist (AR), an expert in MR imaging, with 15 years of experience, who was blinded to the clinical presentation and pathological results. The images were loaded into a DTI software workstation (View Forum 7.2.0.1 exported patient image data, Philips Medical System, Best, Netherlands), and automated registration of DTI data was performed. A circular region of interest (ROI) measuring 3-4 cm2 was placed on the colour FA map at 3 different regions of the hepatic parenchyma, on 3 consecutive slices, away from the vascular and biliary structures (Figure 1). The mean of these 9 values was calculated, which represents the MD and FA of each patient used for statistical analysis.
Statistical analysis
The statistical analysis of data was done using Statistical Package for the Social Sciences (SPSS, Inc., Chicago, IL, USA) software, version 21. The analysis of the data was done to test a statistically significant difference between groups. Student’s t-test was used to compare 2 groups, and the one-way ANOVA test was used to compare more than 2 groups. The receiver operating characteristic (ROC) curve was plotted for calculation of the area under the curve (AUC). The cut-off point was chosen at the highest accuracy. The sensitivity, specificity, and accuracy were calculated. The p value was considered significant if less than or equal to 0.05 at a confidence interval of 95%.
Results
The mean age in the study group with AIH was 13 years, and AIH was more common in females. Table 1 shows the laboratory autoantibodies and immunoglobulin in patients with AIH. There was a significantly higher level of IgG (p = 0.001) and ASMA (p = 0.032) and an insignificant difference in ANA (p = 0.34) and anti-LKM1 (p = 0.08) between patients and controls (Table 1).
Table 1
Laboratory findings of patients with autoimmune hepatitis and controls
| Factor | Patients (n = 42) | Controls (n = 20) | p-value |
|---|---|---|---|
| IgG | 3002 (1160-5869) | 826 (570-1233) | 0.001 |
| ASMA | 11.5 (6-152) | 8.5 (3-15) | 0.032 |
| ANA | 10.0 (5-92) | 9 (3-17) | 0.34 |
| Anti-LKM1 | 8.0 (5-44) | – | 0.08 |
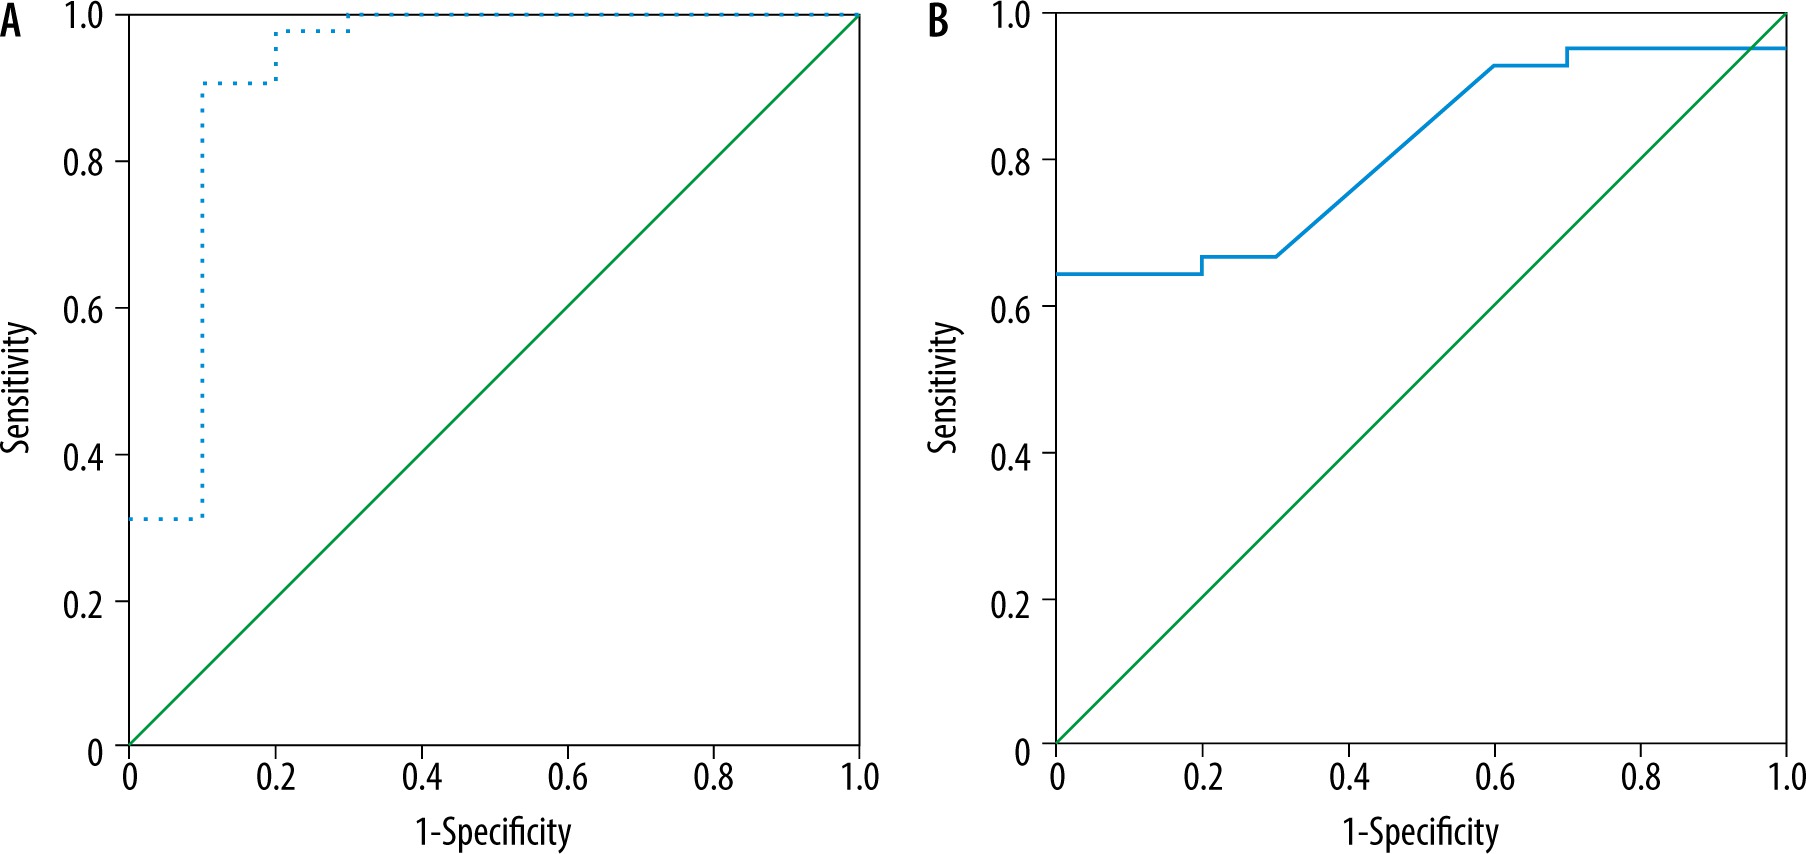
The mean MD and FA of the liver in AIH was 1.42 ± 0.06 × 10⁻³ mm2/s and 0.37 ± 0.11, and in the control group it was 1.55 ± 0.07 × 10⁻³ mm2/s and 0.25 ± 0.03, respectively. The MD was significantly lower and the FA was significantly higher in children with AIH compared to the controls (p = 0.001) (Table 2). The cutoff MD and FA used to differentiate patients from controls were 1.50 × 10⁻³ mm2/s and 0.31 with AUC of 0.919 and 0.813, sensitivity of 97.6% and 66.7%, specificity of 80% and 70%, and an accuracy of 94.2% and 67.3%, respectively (Table 3, Figure 2).
Figure 2
ROC curve of patients versus controls. A) The cutoff MD used to differentiate patients from controls was 1.50 × 10⁻³ mm2/s with AUC of 0.919, and accuracy of 94.2%. B) The cutoff FA used to differentiate patients from controls was 0.31 with AUC of 0.813, and accuracy of 67.3%
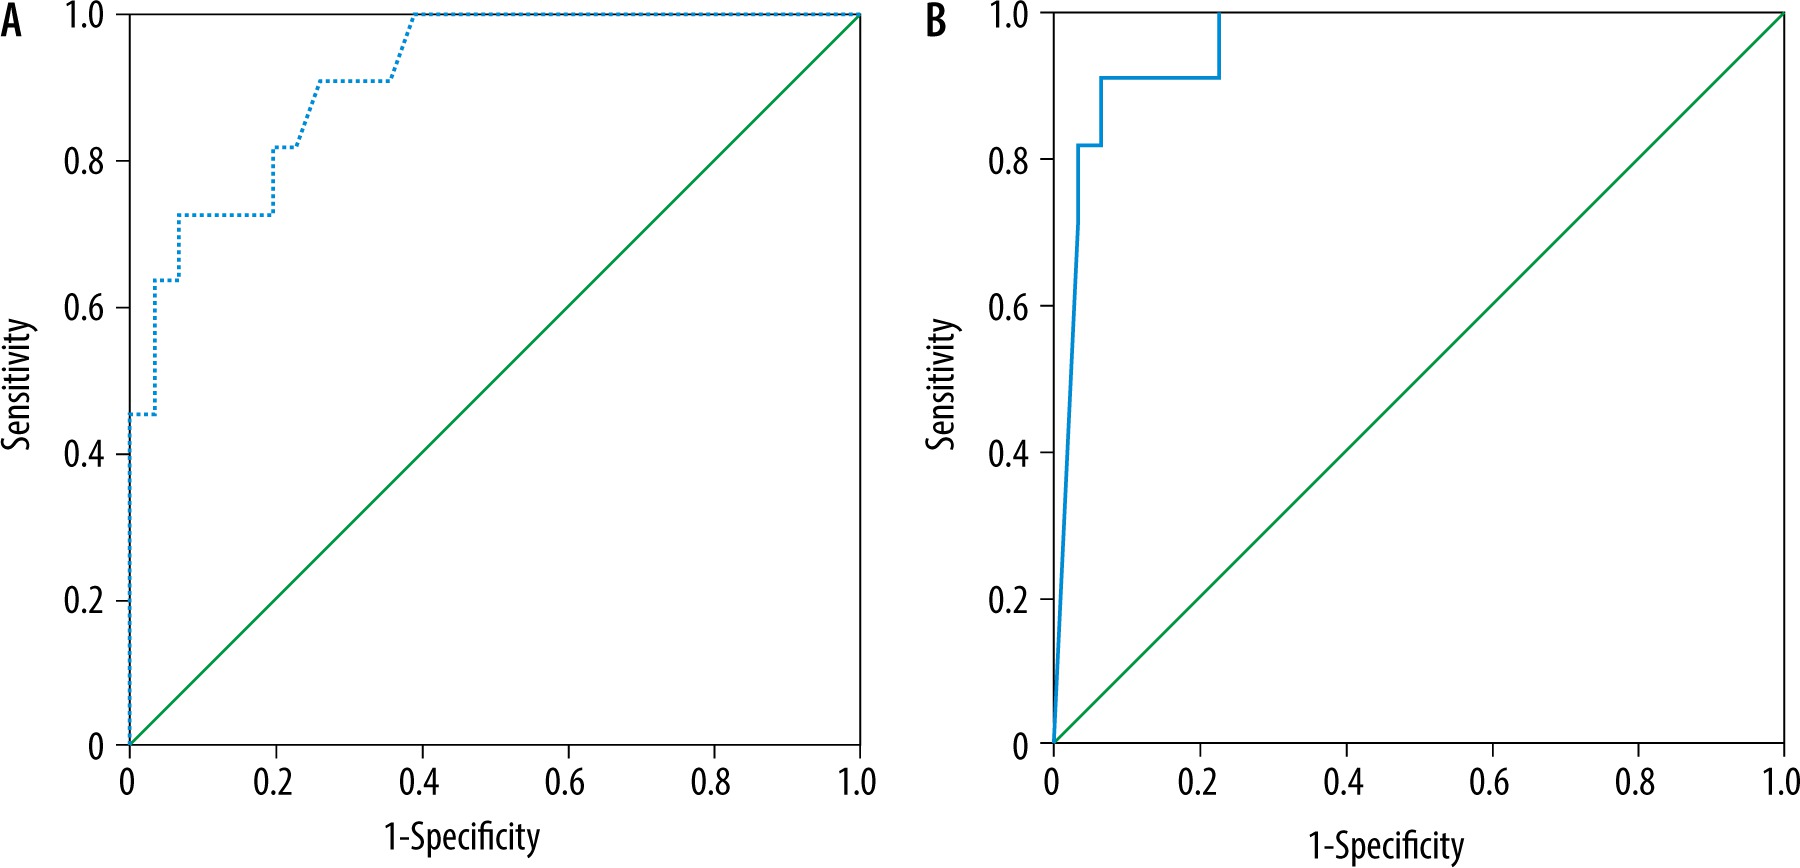
The mean MD and FA of the liver in AIH type I (n = 31) was 1.44 ± 0.04 × 10⁻³ mm2/s and 0.33 ± 0.09, and in AIH type II (n = 11) it was 1.34 ± 0.06 × 10⁻³ mm2/s and 0.50 ± 0.03, respectively. The MD was significantly lower and the FA was significantly higher in the children with AIH type II compared to type I (p = 0.001) (Table 2). The cutoff MD and FA used to differentiate AIH type I from type II were 1.42 × 10⁻³ mm2/s and 0.42 with an AUC of 0.915 and 0.959, sensitivity of 90.9% and 90.9%, specificity of 74.2% and 77.4%, and an accuracy of 78.6% and 80.9% of both reviewers, respectively (Table 3, Figure 3).
Table 2
The mean, MD (× 10-3 mm2/s) and FA of patients and controls
Table 3
The ROC curve results of MD (× 10-3 mm2/s) and FA of patients vs. controls
Figure 3
ROC curves of patients with AIH type I versus type II. A) The cutoff MD used to differentiate AIH type I from type II was 1.42 × 10⁻³ mm2/s with AUC of 0.915, and accuracy of 78.6%. B) The cutoff FA used to differentiate AIH type I from type II was 0.42 with AUC of 0.959, and accuracy of 80.9%
The mean MD and FA of the liver in AIH without overlap syndrome (n = 33) was 1.43 ± 0.06 × 10⁻³ mm2/s and 0.33 ± 0.09, and in AIH with overlap syndrome (n = 9) it was 1.36 ± 0.05 × 10⁻³ mm2/s and 0.51 ± 0.003, respectively. The MD was significantly lower and the FA was significantly higher in the children with AIH with overlap syndrome compared to those with AIH without overlap syndrome (p = 0.005) (Table 2). The cutoff MD and FA used to differentiate AIH with overlap syndrome from AIH without overlap syndrome were 1.42 × 10⁻³ mm2/s and 0.50 with AUC of 0.828 and 0.963, sensitivity of 88.9% and 88.9%, specificity of 69.7% and 93.9%, and accuracy of 73.8% and 92.9%, respectively (Table 3, Figure 4).
Figure 4
ROC curve results of patients with overlap syndrome versus without overlap syndrome. A) The cutoff MD and FA used to differentiate AIH with overlap syndrome from AIH without overlap syndrome was 1.42 × 10⁻³ mm2/s with AUC of 0.828, and accuracy of 73.8%. B) The cutoff FA used to differentiate AIH with overlap syndrome from AIH without overlap syndrome was 0.50 with AUC of 0.963, and accuracy of 92.9%

Discussion
The main findings in our work are the significantly lower MD and higher FA of the liver in patients with AIH than in the controls. There was significant lower MD and higher FA of the liver in children with AIH type II compared to children with AIH type I, and patients with overlap syndrome compared to patients without the syndrome.
In this work, AIH was more common in females in the 2nd decade of life with a significantly higher level of the IgG and ANA. Previous studies reported that AIH is more common in females in the 2nd and 3rd decades, characterized in the laboratory by elevated autoimmune antibodies and immunoglobulin, histologically by the presence of interface hepatitis and rosette formation, and clinically ranging from asymptomatic to having liver failure. AIH is characterized by positive autoantibodies including ANA, ASMA, and anti-LKM1 and increased immunoglobulin G (IgG) [2-7].
In this study, the MD of the liver in children with AIH was significantly lower compared to the controls. This may be due to the presence of interface hepatitis at the portal-parenchymal interface, with dense plasma cell-rich lymphoplasmacytic, infiltrates, hepatocellular regeneration with rosette formation, emperipolesis (active penetration by one cell into and through a larger cell), and hepatocyte swelling and/or pycnotic necrosis piecemeal necrosis with periportal/periseptal lymphocyte infiltrating the portal plasma cells. Fibrosis is present in all children with AIH apart from those with the mildest forms of the disease [2-7].
One study reported that there is a statistical difference in the MD of children with hepatic fibrosis (p = 0.001) and controls, and within the different grades of hepatic fibrosis (p = 0.002), with correlation between the MD and fibrosis score (r = 0.807, p = 0.001) [30]. Another study reported that the MD in children with fibrosis (1.53 ± 0.1710–3 mm2/s) is significantly lower than the MD of controls (1.74 ± 0.16 ´ 10-3 mm2/s), and MD is negatively correlated with the different stages of fibrosis (r = –0.799, p = 0.001) and necro-inflammatory activity grade (r = –0.468, p = 0.001) [31]. Another study reported that hepatic MD can be used for differentiation of biliary atresia from non-biliary atresia in neonatal cholestasis, and a decreasing tends of MD with increasing degree of fibrosis [26]. The stretched exponential model shows a higher diagnostic performance for determining significant hepatic fibrosis than the mono-exponential model of diffusion modules [28].
In this study, the FA is significantly higher in children with AIH than controls. This may be due to the increased connective tissue in the liver together with collagen fibre deposition, fatty infiltration, cell necrosis/apoptosis, and the presence of inflammatory cell infiltration. A previous study reported that the FA shows an increasing trend with increasing fibrotic stage, but there is an insignificant difference in the FA values (p = 0.183) at different fibrotic stages [26]. Another study added that the mean hepatic FA of hepatic parenchyma in neonates with biliary atresia (0.34 ± 0.04 and 0.36 ± 0.04) is significantly higher (p = 0.01, 0.02) than that of Alagille syndrome (0.30 ± 0.06 and 0.31 ± 0.05) for both readers (r = 0.80, p = 0.001) [29].
Based on the serum tests, there are 2 types of AIH; where AIH Type I is more common (two-thirds), tends to affect younger girls, and is usually associated with other autoimmune diseases and AIH type II (one-third), which primarily affects children between the ages of 2 and 14 years. While AIH generally occurs in early adulthood or adolescence, it can develop at any age. AIH represents approximately 10% of the 400 new paediatric referrals per year, two-thirds of the cases being AIH type I and one-third AIH type II [32]. In this study, AIH type II showed a lower MD and higher FA than AIH type I denoting that patients with AIH type II have more severe activity and fibrosis than type I.
Overlap syndrome is characterized by AIH with features of primary sclerosing cholangitis that are associated pathologically with a higher frequency of interface hepatitis (p = 0.008) and the presence of rosettes (p = 0.05) [30]. In this study, the MD was significantly lower in children with overlap syndrome. This may be attributed to the presence of associated pathological changes of the bile duct and the presence of cirrhotic changes [4-7]. This finding indicates that patients associated with the overlap syndrome have a more aggressive form of the disease.
Few studies have discussed the differences in DTI between 1.5 and 3.0 Tesla of the abdomen and spine. One study reported that the higher magnetic field strength provides a higher image quality in DTI of the spinal cord, better differentiation between the the renal cortex and medulla, and early detection of hepatic ischaemia-reperfusion injury [33-35].
There are some limitations to our study. First, there was a small number of patients, which limits the statistical power. Further studies are recommended upon a larger number of patients. Second, this study used DTI of the liver. Further studies using multiparametric MR imaging [36-43] combined with laboratory tests are recommended.