


Introduction
Increased use of ultrasound (USG) for diagnosing abdominal and gynaecological abnormalities has increased the detection of adnexal lesions (both symptomatic and otherwise). It is of utmost importance to determine if an adnexal lesion is benign or malignant because it has a significant bearing on its management and follow-up.
Transvaginal ultrasound is the primary imaging modality for evaluating adnexal pathology. Characterization of adnexal lesions is accurate when they show specific features on ultrasound as per IOTA (International Ovarian Tumour Analysis Group) [1]. However, the characterization becomes difficult when the lesions are complex and large.
Owing to its better tissue characterization, spatial resolution, and multiparametric features, magnetic resonance imaging (MRI) has been used as a problem-solving tool in the diagnosis of complex adnexal lesions. Conventional MRI sequences help in tissue characterization and show a high specificity in the diagnosis of benign ovarian lesions. Diffusion-weighted imaging (DWI) has been used for the differentiation of benign from malignant lesions in gynaecological imaging [2,3].
The aim of our study was to determine the role of diffusion-weighted MRI in differentiating benign from malignant adnexal lesions, to describe and analyse the signal characteristics of various adnexal lesions and their ADC (apparent diffusion coefficient) values on DWI.
Material and methods
A prospective analytical cohort study was carried out in the Department of Radiology of our institute over a period of 18 months on patients referred to MRI for characterization of adnexal lesions detected on ultrasound. All the cases referred for MRI scan regarding evaluation of adnexal lesions over a period of 18 months were included in the study. The study was approved by our Institutional Ethical Committee. Informed consent was obtained from all the patients included in this study. A total of 55 patients, constituting 67 lesions, were studied. The subjects encompassed all age groups. Cases with a prior history of surgical intervention or chemotherapy for ovarian tumours were excluded.
A 1.5 Tesla Magnetom Symphony Maestro class MRI (Siemens) was used to acquire the images. MR imaging protocol included Axial T1-weighted (TR/TE, 614/11 ms), T2W (TR/TE, 3350/98 ms) in axial, sagittal, and coronal planes, T1 Fat Saturation (T1 FS) in an axial plane. Diffusion-weighted images (TR/TE 4800/83 ms, slice thickness 4 mm, FOV 227-267 mm, matrix 102 × 160, and an acquisition time of 4 min) were acquired in the axial plane by using a single-shot echo-planar imaging sequence with b values of 0, 100, and 800. TIW FS images following IV gadolinium were acquired wherever necessary in axial, sagittal, and coronal planes.
Image analysis
The lesions were evaluated and classified based on the site of origin, size, and signal characteristics in T1/T2/T1FS images on conventional MRI.
Analysis of DWI: Both qualitative (signal intensity) and quantitative-apparent diffusion coefficient (ADC) values of the lesions were recorded.
Qualitative analysis: The lesions were described as hypo-, iso-, hyperintense on DWI based on their signal intensities compared with the uterine myometrium.
Quantitative analysis: The apparent diffusion coefficient values were calculated on the workstation with standard software (Diffusion Calculation) using a circular operator-defined region-of-interest (ROI) measuring 3 mm, placed on the cystic/solid components or both (if the lesion had both solid and cystic). The ROI was placed away from the wall of the lesion and septations in cases of multiloculated lesions. In large lesions, the mean value of 3 different ROI measurements on the same slice was calculated. In solid lesions, the necrotic core was avoided for calculations. In lesions showing components/locules with large differences in ADC values, both the highest and the lowest values were recorded. Analysis was done separately using the mean of lowest and of the highest values.
Statistical analysis
Statistical analysis was done using SPSS windows software, version 20. Statistical significance of non-descriptive variables (ADC values of benign and malignant lesions) was calculated using the independent samples test – t-test. The ADC values of solid and cystic components were evaluated separately. The statistical analysis was done comparing the benign solid lesions with solid components of malignant lesions and cystic fluid of the benign lesions with cystic components of malignant lesions. Evaluation of descriptive variants such as signal intensity of the solid components on T2W and DW imaging was calculated using cross tabulation c2 test. In both the above analyses p-values < 0.05 were considered significant.
Final confirmation
The diagnosis made on MRI was confirmed with the final clinical diagnosis made on the consensus of clinical setting/laboratory parameters/operative findings/follow-up. Guided biopsies were performed from the solid components of solid-cystic lesions (where feasible and accessible) of more than 10 cm in size with ascites. Solid lesions with a benign diagnosis on MRI were surgically excised. Lesions showing purely cystic components were followed up for a period of 6 months if the lesion size was less than 5 cm. Cystic lesions more than 5 cm were surgically excised.
Results
Of the 55 patients studied, 12 (22%) had bilateral adnexal lesions resulting in 67 lesions. In cases with bilateral lesions, the morphology/histology of the lesions was similar in our study. The mean age of the patients in the study was 58 years, and 14 were postmenopausal.
Sixteen of the studied lesions were diagnosed as malignant, 50 as benign and 1 as borderline. For statistical purposes, the borderline tumour was included among the malignant lesions. The final diagnosis of various lesions encountered in our study is presented in Table 1. Table 2 depicts the lesion sizes encountered in our study.
Table 1
Final diagnosis of lesions
Table 2
Distribution of lesion sizes
The lesions were classified based on morphology as purely cystic, predominantly solid, and mixed solid and cystic.
The pattern in solid components of lesions
Of the 16 malignant lesions, 5 (2 metastatic, 2 leiomyosarcoma, and 1 Sertoli-Leydig cell tumour) were predominantly solid in composition, with mixed solid and cystic components in 11. The solid components of all the malignant lesions were hyperintense on T2W images and DWI except the Sertoli-Leydig tumour, which showed isointense signal. Eight of the benign lesions were solid in composition. Three of the 8 benign lesions (2 fibro-thecoma and 1 fibroid with myxoid degeneration) showed hyperintense signal on T2W and DWI images with the remaining 5 showing hypointense signal.
Hyperintense signal of the solid component on T2W and DW images was significantly associated with malignancy and hypointense signal with benignity (p = 0.003 and p = 0.001, respectively).
The ADC values of the benign and malignant lesions are shown in Table 1.
Amongst the benign lesions (n = 9), there were 6 leiomyomas/fibroids, 1 case of ovarian torsion, and 2 fibro-thecomas. The case of torsion ovary was excluded from the statistical analysis. The leiomyomas showed hypointense signal on T1/T2/DWI (Figure 1). Degenerated fibroids showed intervening patchy areas of high T2 signal with no restricted diffusion. A case of myxoid degeneration of fibroid showed a hyperintense signal on T2W and DWI with no loss of signal on ADC maps.
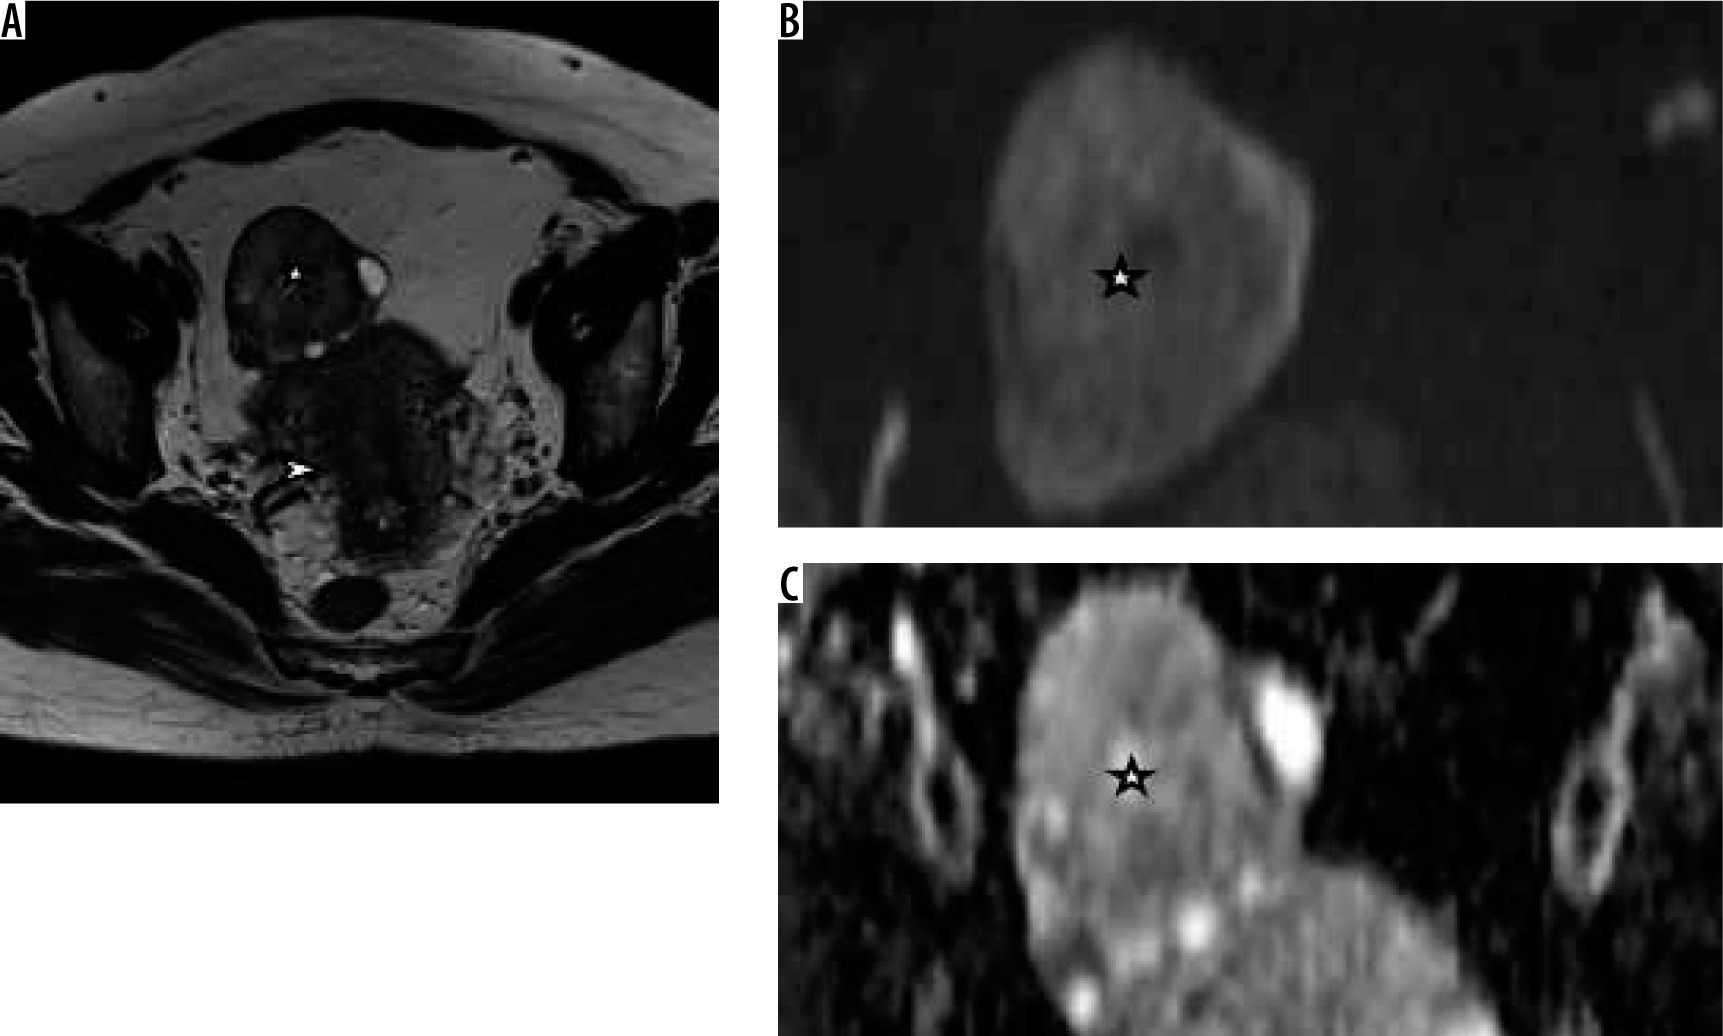
Figure 1
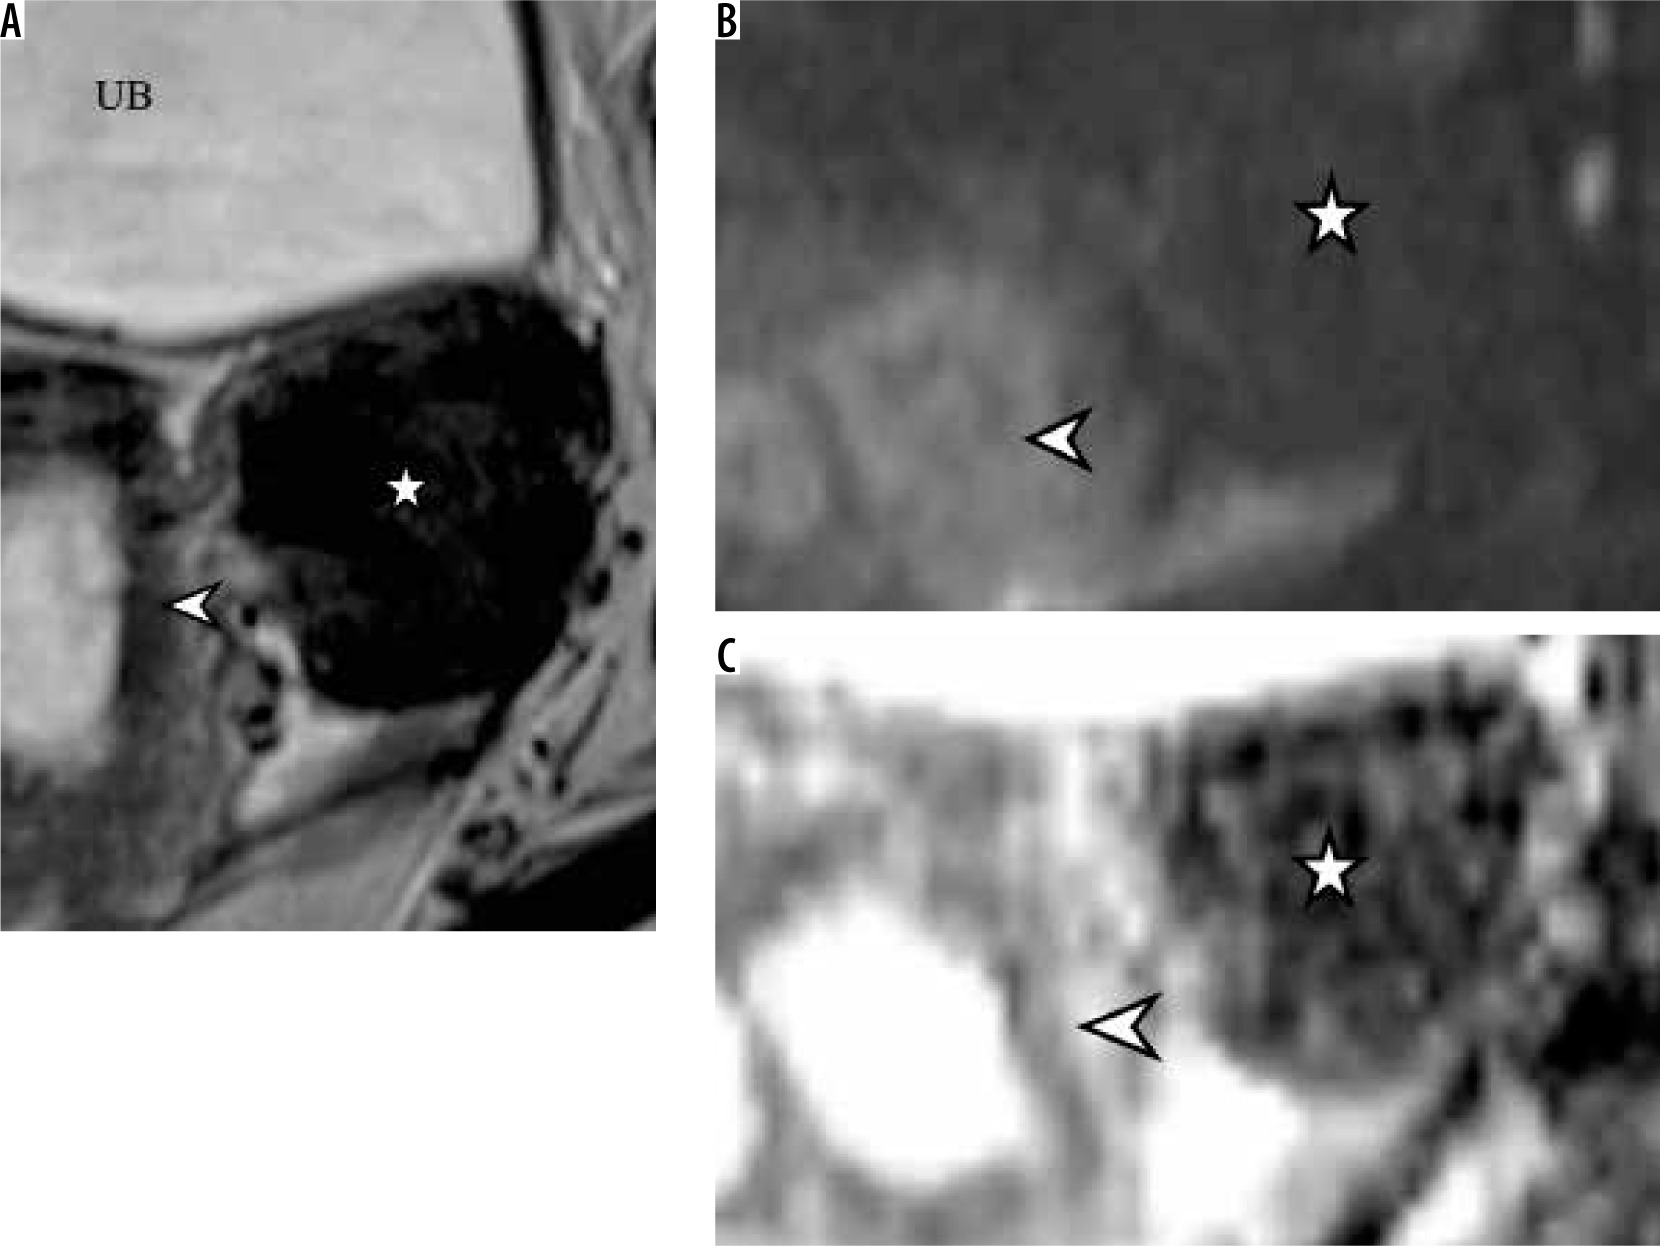
Left adnexal broad ligament fibroid (*). Lesion shows hypointense signal on T2W (A) and DW (B) images. The arrowhead in (A) marks the uterus. Note the low signal on the ADC map (C)
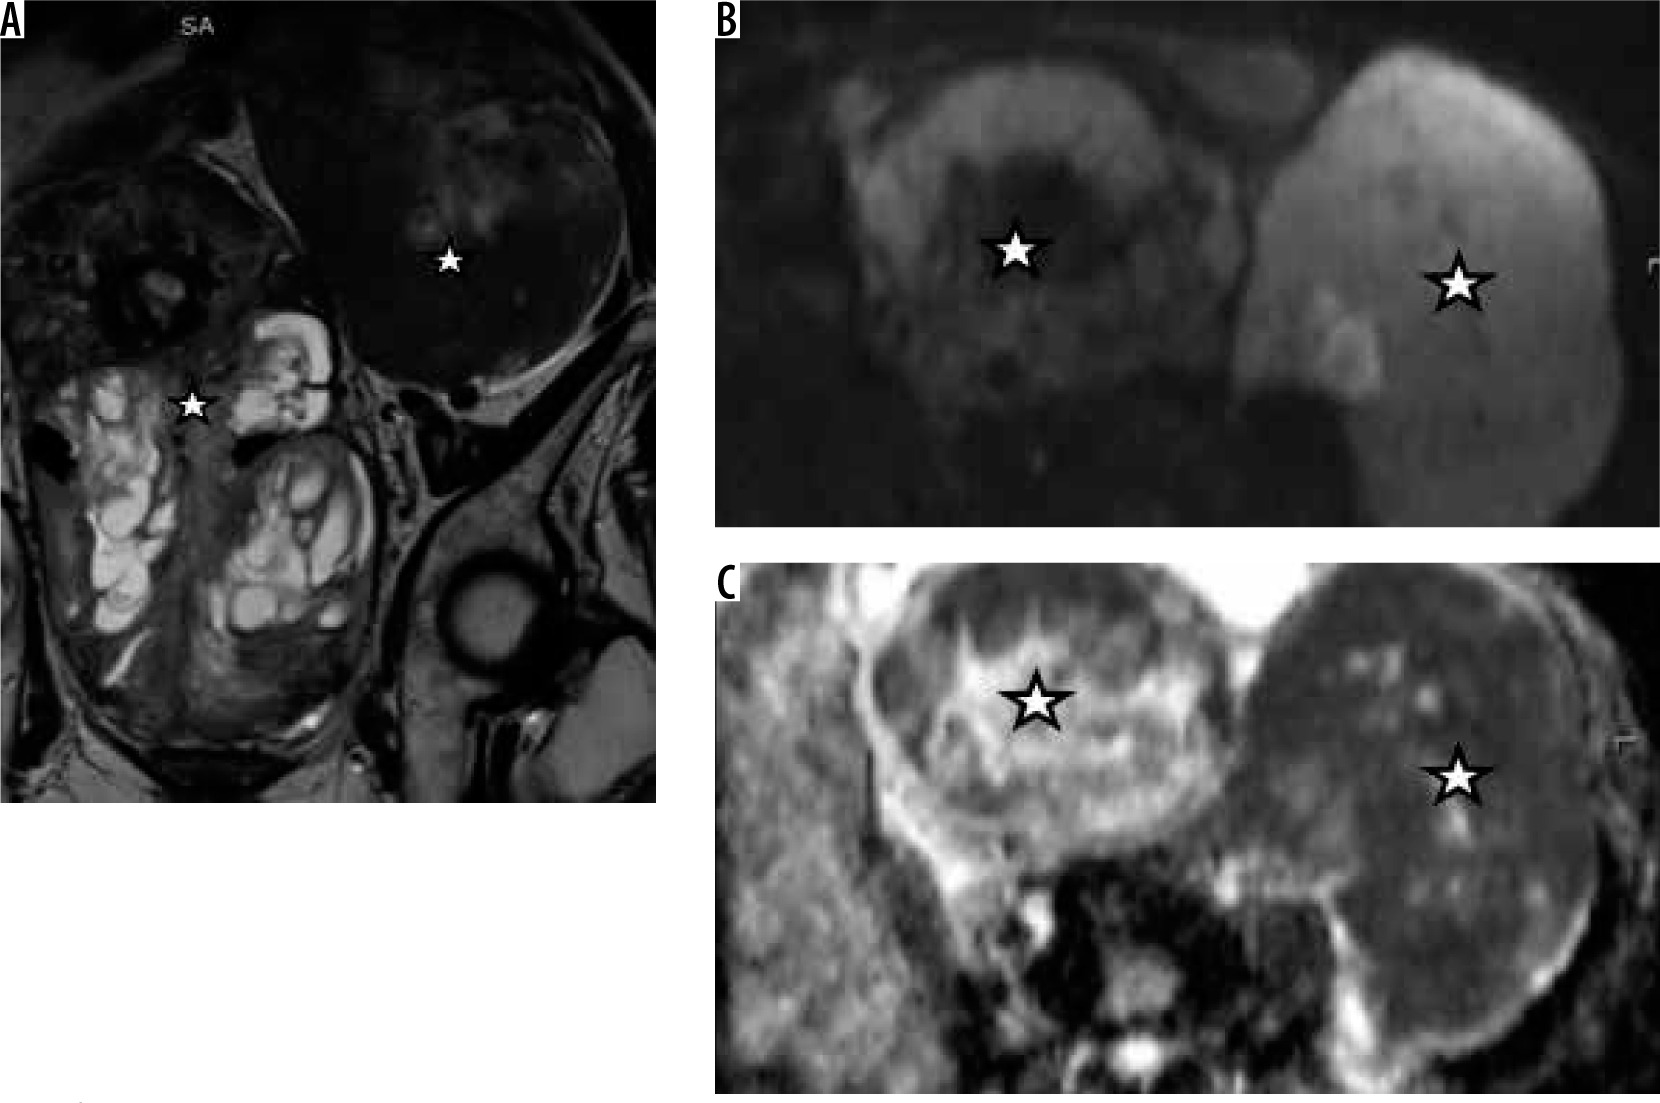
Leiomyosarcoma (LMS) deposits showed a hyperintense signal on T2W and DW imaging with restricted diffusion (Figure 2); ADC values were higher than leiomyoma (Table 1).
Figure 2
Leiomyosarcoma deposits (*) in both the ovaries showing predominantly solid morphology. T2W images (A) and DWI (B) reveal high signal with low signal on the ADC map (C)
The mean ADC value of malignant lesions was 0.87 × 10⁻³ mm2/s (Table 2). Necrotic/cystic components did not show any diffusion restriction. The ADC value of leiomyomas without degeneration (mean: 0.6 × 10⁻³ mm2/s) was lower than the normal myometrium, as well as that of malignant lesions. However, fibroids showing degeneration showed a higher ADC value (mean: 1.7 × 10⁻³ mm2/s) (Table 3).
Table 3
Distribution of ADC values of solid components
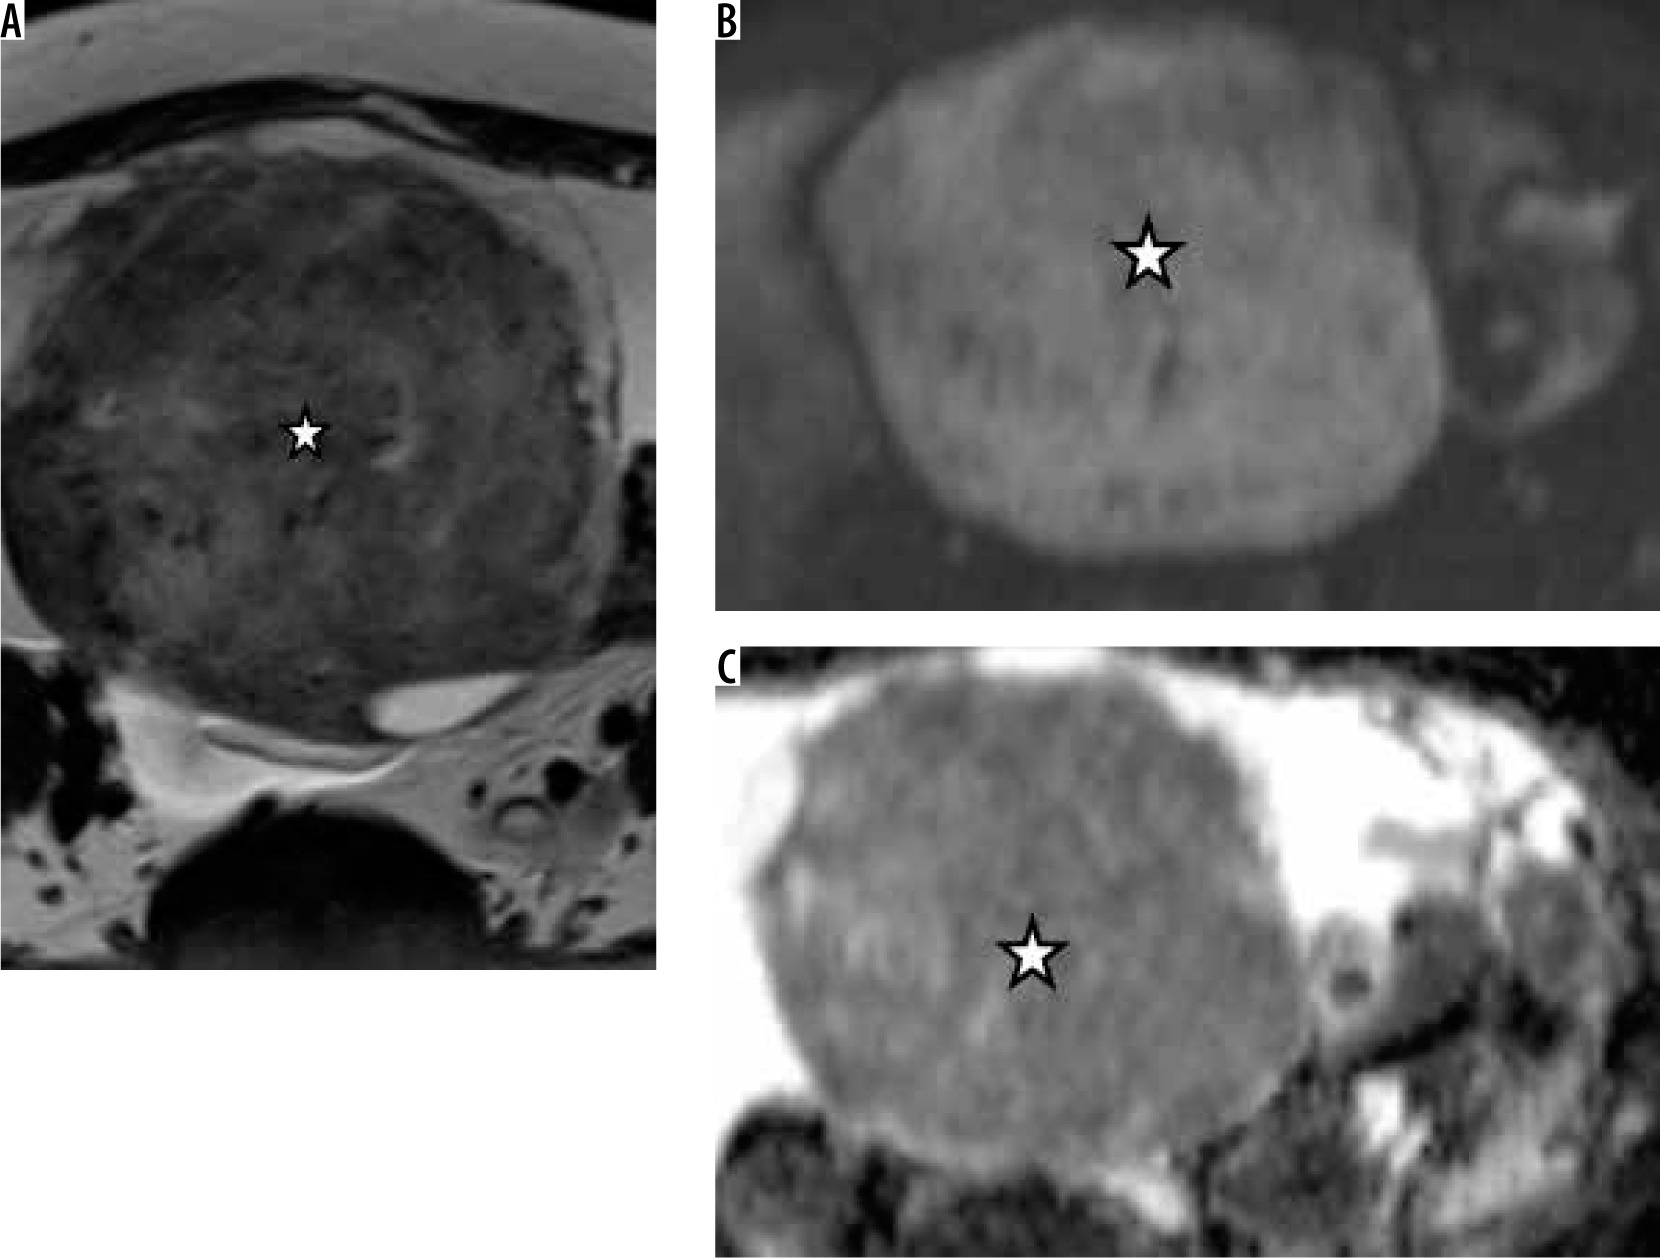
Fibrothecoma showed a hyperintense signal on T2W and DW images (Figure 3), with a mean ADC value of 0.75 × 10⁻³ mm2/s. They were wrongly classified as malignant lesions (false positive).
Figure 3
Fibrothecoma (*). A well-defined T2 hyperintense lesion (A) with areas of decreased signal. DWI (B) shows a hyperintense signal with a low signal on the ADC map (C)
When ROC curves were plotted with the ADC values of the solid components, a cut-off value of 0.77 × 10⁻³ mm2/s showed 93% sensitivity with a false positive rate of 5% for diagnosing benign lesions.
There was no statistical significance to the ADC values of the solid components for differentiating malignant from benign lesions (Table 4).
Pattern in cystic lesions/cystic components of solid lesions
Of the benign lesions, 42 were cystic in nature. The cystic fluid showed varying signal intensity on T1W images based on the fluid contents. Lesions containing blood products such as endometriomas, haemorrhagic cysts, and ruptured ectopic showed T1/T1FS hyperintense signal. The endometriotic cysts showed a drop in T2 signal (shading effect). Dermoid cysts showed T1 hyperintense signal with a drop in signal on T1FS. Other lesions showing a hyperintense signal on T1W images were abscesses and a few locules of mucinous cystadenoma. The borderline ovarian tumour showed predominantly cystic morphology with a few thick septations and small mural excrescences.
The diagnosis of a large convoluted hydrosalpinx was easier on MRI because of better anatomical delineation (visualization of ovaries separate from the lesion, retort-shaped lesions).
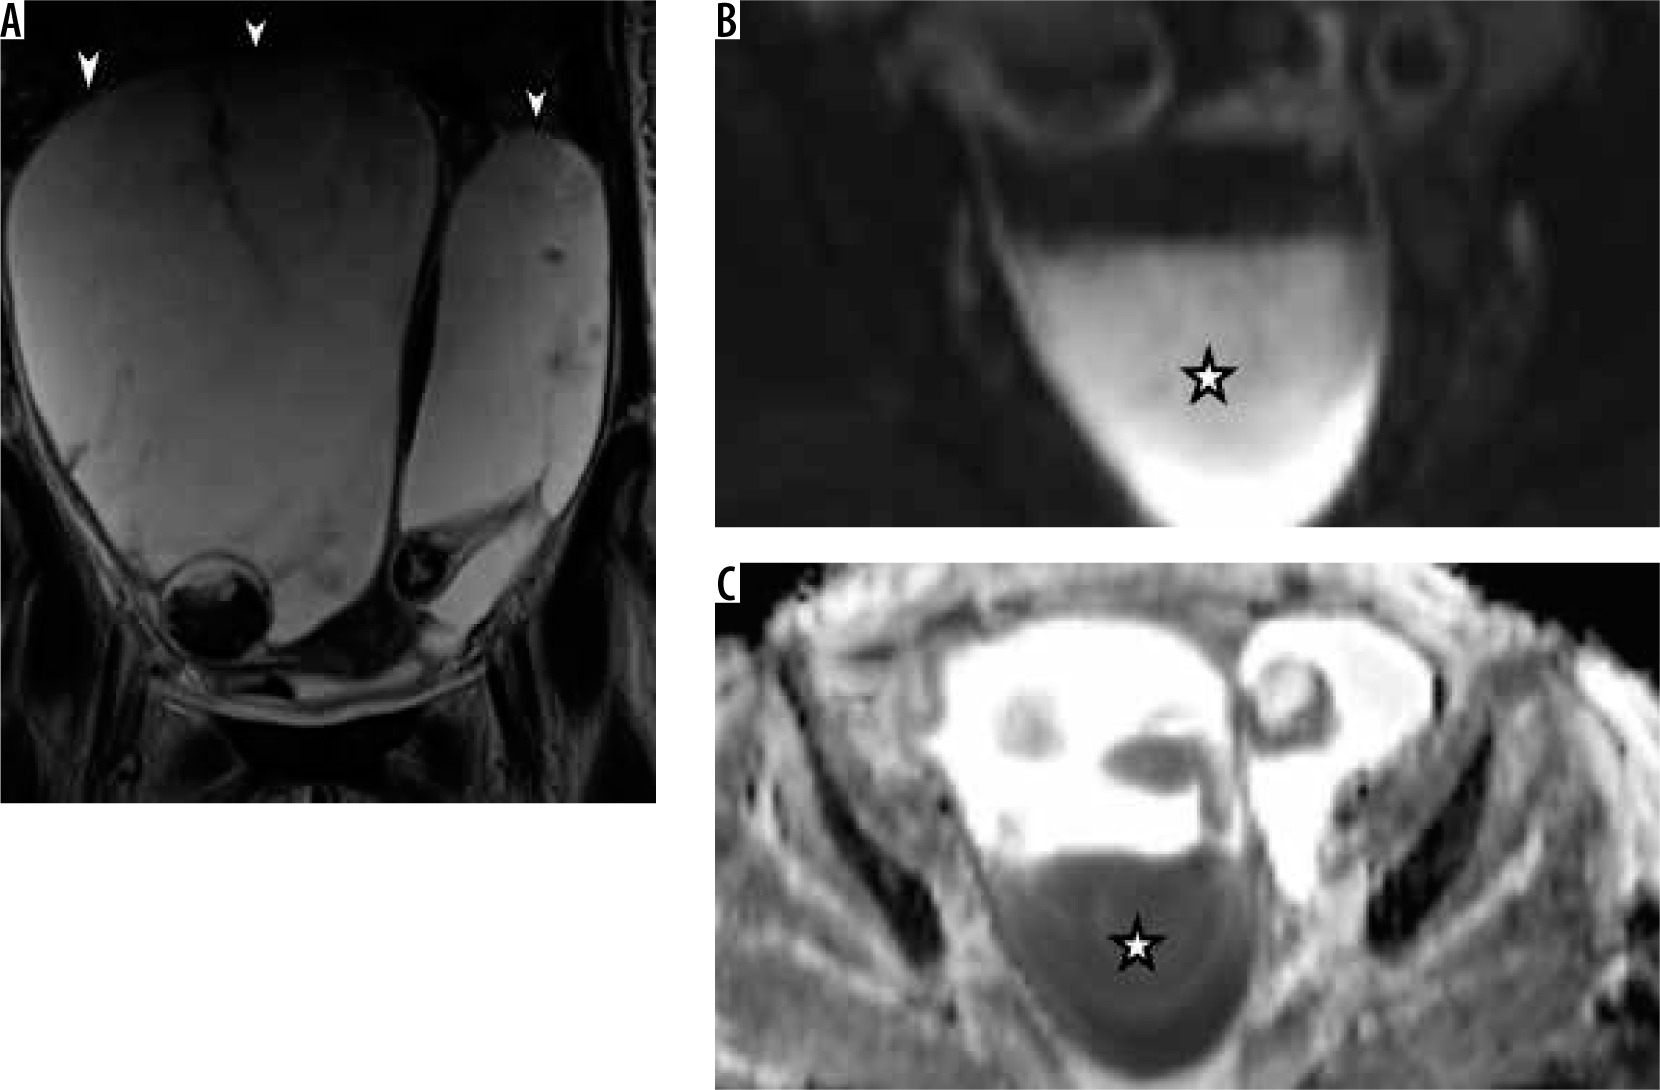
Two endometriotic cysts and an abscess showed fluid–fluid levels with one component showing a high signal on DWI. A corresponding decrease of signal in ADC maps s/o diffusion restriction was noted in abscesses (Figure 4).
Figure 4
Abscesses: (A) Multiloculated cystic lesions in bilateral adnexa. Dependent portion (*) shows high signal on DW (B) and corresponding low signal on ADC (C) maps, suggesting restricted diffusion
On DWI, dermoid cysts showed areas of hyperintense signal. ADC maps revealed low values in lipid components (0.5-0.7 × 10⁻³ mm2/s).
Five benign cystic ovarian neoplasms, 3 serous, and 2 mucinous were encountered in our study. Both were thin-walled cystic lesions with no solid components/mural nodules. Serous cystadenomas were unilocular with T1 hypo- and T2 hyperintense signals. The mucinous lesions, on the other hand, were multiloculated and showed locules of varying signal intensity. The cysts did not show a low signal on ADC maps.
The ADC values of the cystic components of the lesions are shown in Table 3. The mean ADC value of benign cysts (all lesions included) was lower than the cystic components in malignant tumours (Table 5). When the ADC values of fluid in malignant lesions and benign cystic lesions (excluding cysts with haemorrhage and fat) were analysed there was no significant association of ADC with malignancy (Table 6).
Table 5
Distribution of ADC values of the cystic fluid in benign and malignant lesions
Table 6
Mean ADC values of cystic components of benign and malignant lesions
ROC curves were plotted for the ADC values of the cystic lesions and cystic components of malignant lesions. A cut-off value of 2.4 × 10⁻³ mm2 had a sensitivity of 88% with a false positive rate of 6% for diagnosing malignant lesions.
Discussion
MRI has been used as a problem-solving tool in the diagnosis of adnexal lesions - in determining their site of origin and characterizing their tissue content [4,5]. Adnexal lesions may arise from the fallopian tubes, ovaries, or the uterus (pedunculated or broad ligament fibroids). Both benign and malignant ovarian lesions may show complex cystic/solid- cystic imaging morphology [6] resulting in a diagnostic dilemma. Many studies [7,8] found that the imaging features favouring malignancy in pre-operative scans were lesion size > 6 cm, thickness of the walls and septa > 3 mm, papillary projections, mural nodules, solid components, necrosis, haemorrhage, and intense enhancement of the solid components following administration of intravenous contrast.
The differentiation of benign from malignant lesions is pivotal for patient management in terms of surgical approach, the extent of surgical excision, and the need for post-surgical chemotherapy [9,10].
The signal of tissues on DWI is a function of their T2 characteristics and restricted water diffusion, and therefore diffusion-weighted images should be interpreted along with the ADC images. Highly cellular tissues such as malignancies restrict the movement of water molecules resulting in high signal intensity on DWI. This property has been used in the diagnosis of malignancies in gynaecological imaging [2,3,11,12].
Hyperintense signal of solid components on T2 and DWI was significantly associated with malignancy in our study, consistent with previous studies [13-15]. Hypo-intense signal in solid components reflecting the presence of fibrous stroma was similarly associated with benignity of the lesion [16].
Of the 30 benign and 47 malignant lesions studied by Thomassin Nagara et al. [13], low signal intensity on T2W and b1000 images were predictive of benignity with a positive likelihood ratio of 5.7 and 10.9, respectively. Similarly, a high b1000 signal with intermediate signal on T2W images was predictive of a malignant lesion with a positive likelihood ratio of 4.5. In a study involving 202 solid and complex ovarian lesions, Zhang et al. [17] demonstrated that the presence of a high signal on T2W images and DWI with low ADC was predictive of malignancy. The presence of solid components with high signal on T2, DWI with high ADC values, or hypo-intense signal on T2/DWI and ADC maps was predictive of benignity. They had taken an ADC cut-off value of 1.2 × 10⁻³ mm2/s.
In our study, a cut-off value of 0.7 × 10⁻³ mm2/s yielded a sensitivity of 93% and a false positive rate of 5%. Based on the ROC there is no significance of ADC values in distinguishing benign from malignant lesions. This result is probably due to the number (8 benign vs. 16 malignant) and the histology (most benign lesions being fibroids, which show low ADC values) of the lesions.
Two benign lesions falsely classified as malignant in our study were fibrothecomas. High signal on DWI was found in the 3 highly cellular fibrothecomas in a study conducted by Takeuchi et al. [14]. All these lesions showed interspersed focal areas of T2 hypointense solid components [14]. Similar findings were noted in our study along with ascites. The hyperintense signal on T2/DWI in fibrothecomas is attributed to the presence of theca-like cells with lipid-rich content and stromal oedema [18]. The ADC values of fibrothecoma are reflective of its fibrous content; the more fibrous the tissue, the lower the values [19].
A case of malignant Sertoli-Leydig cell tumour presenting with symptoms of hirsutism was encountered in our study. The tumour showed a solid morphology, presence of microscopic fat on chemical shift imaging, heterogenous moderate enhancement on contrast images, an isointense signal on DWI, and ADC values higher than the rest of the malignant lesions (Figure 5). The lesion could be correctly classified on conventional imaging as malignant but not on DWI alone.
Figure 5
A) Sertoli-Leydig cell tumour in right ovary (*). DWI (B) shows an isointense signal with no significant drop in signal on ADC maps (C)
Leiomyomas with no changes of degeneration in our study had low signal on T2W/DWI and low ADC values similar to previous studies [13,17]. Degenerated fibroids had ADC values higher than the non-degenerated fibroids. Fibroids with degenerative changes and myxoid degeneration showed high signal in ADC maps corresponding to the regions with high T2/DWI signal due to the T2 “shine through” effect [20,21].
Leiomyosarcoma (LMS) deposits, in contrast to leiomyoma (fibroids), showed hyperintense signal intensity on T2W and DW images with low ADC values (0.8 × 10⁻³ mm2/s). DWI can thus help differentiate leiomyosarcomas from degenerated fibroids when evaluated in conjunction with signals on ADC maps.
High signal on T2W and DWI was considered diagnostic of sarcomatous change in pre-existing fibroids in addition to hyperintense signal on T1W images suggesting haemorrhage [22]. However, later studies concluded that T1/T2/DW hyperintense signals in a fibrous lesion are not diagnostic but should raise suspicion for sarcomatous change [23].
The low ADC values seen in fibroids can be attributed to “the black-out effect” resulting from the presence of fibroblasts producing a dense collagen matrix [21]. Hence, ADC values do not contribute to the differentiation of benign from malignant solid lesions when considered in isolation [13,19].
The role of DWI in diagnosing cystic lesions of the adnexa is limited because of diffusion restriction demonstrated by many benign lesions [21]. Haemorrhagic cysts, endometriomas, dermoid cysts, mucinous cystic tumours, and abscesses can all show areas of diffusion restriction with low ADC values.
Cystic teratomas show a characteristic high signal intensity on T1W images, which is suppressed on T1W FS images and can be diagnosed accurately on conventional MRI [24]. Keratinous or epidermoid components within these cysts may show diffusion restriction [21,25].
Lesions containing blood products such as haemorrhagic and endometriotic cysts show high signals on T1W/T1W FS images. The endometriotic cysts show a characteristic drop in signal on T2W images known as the “shading effect” [26] due to the presence of hemosiderin and proteinaceous contents [27,28]. It is for the same reason that infective lesions such as abscesses can present as complex lesions with varying intensities on T1W and T2W images. Abscesses show diffusion restriction due to internal viscous contents (pus) and cell debris [29,30]. However, the clinical history and signal characteristics on conventional imaging aid in the diagnosis.
The cystic components of malignant lesions do not show diffusion restriction. With a cut-off of 2.2 × 10⁻³ mm2/s, differentiation of benign from malignant lesions showed a false positive rate of 6.4%. Therefore, based on the ADC values of the cystic components, we cannot differentiate benign from malignant adnexal masses. When ADC values of all benign cystic lesions (excluding haemorrhagic and dermoid cysts) and cystic components of malignant lesions were compared, the mean ADC value of the benign lesions (2.3 × 10⁻³ mm2/s) was lower than that of malignant lesins (2.5 × 10⁻³ mm2/s). The increased ADC value in cystic components of malignant lesions has been attributed to turbulent flow in large lesions due to the compressions by respiratory efforts known as “the sloshing effect” [31].
Conclusions
Qualitative DWI acts as an adjunct to conventional MRI in differentiating benign from malignant adnexal lesions showing solid/mixed morphology. It plays no role in differentiating cystic lesions due to a significant overlap of lesion characteristics. Quantitative DWI/ADC values play no role in differentiating benign from malignant adnexal lesions, irrespective of lesion morphology. DWI should always be interpreted in conjunction with conventional MRI.