


Introduction
High-resolution computed tomography (HRCT) of the thorax has become an indispensable diagnostic modality in the clinical context of lung pathologies. Consequently, the harmful effects related to radiation exposure have become an important factor to consider [1-3]. The high radiation dose of HRCT of the thorax and the location of most radiosensitive organs within the scan range make the situation much worse [3,4].
Some of the common indications for HRCT of the thorax include screening/diagnosis/follow-up of lung cancer, pulmonary infections including COVID-19 pneumonia, diffuse infiltrative lung disease, chronic obstructive lung disease, and acute respiratory distress syndrome [5-10].
It would be of great value to diagnose these conditions with the lowest possible radiation dose. To fulfil this need, a low-dose chest computed tomography (CT) protocol with a radiation dose of around 1.5 mSv had previously been implemented. Many previous studies have shown that this protocol offers good quality images for imaging some lung pathologies [3,6,7,11,12]. However, it is unable to offer complete protection from the risk of radiation [5].
Hence, an ultra-low-dose chest CT protocol offering a sub-millisievert radiation dose (~equal to 2 chest X-ray sessions) was considered [3,4,9]. This dramatic reduction in radiation dose was made possible after the introduction of several newer technologies [1,3,5,7,13-15].
This prospective study was done to test the ability of a non-contrast ultra-low-dose chest CT protocol to detect common pulmonary lesions using a third-generation Siemens dual-source CT scanner (Somatom Force).
Material and methods
Patient selection
The Local Ethics and Scientific Committee approved this study, and written informed consent was obtained from all participants. Patients of all age groups of both sexes, who underwent clinically indicated unenhanced HRCT thorax scans in the Radiology Department between July 2020 and August 2021 were included in this study. Images with extensive artifacts were excluded.
Methodology
The study was done using a third-generation, dual-source, dual-energy CT scanner (Somatom force, Siemens Healthcare). All the images were obtained with patients in the supine position. No IV contrast medium was injected. All patients underwent both standard and ultra-low-dose CT scans without a change in position or time delay. But the order in which they were taken was interchanged randomly to avoid bias. Because a slice thickness of 0.6 mm in ultra-low-dose CT yielded much higher image noise, it was increased to 3 mm for comparison with standard-dose CT images. All images were reconstructed in the transverse orientation, anonymized, and transferred for image analysis. The parameters of standard and ultra-low-dose CT are illustrated in Table 1.
Table 1
Parameters of standard and ultra-low-dose computed tomography
Image analysis
Image analysis was performed at lung window settings (window level, −500 HU; window width, 1500 HU), using a Syngo.via VB40 workstation. Image noise and image quality were assessed for all the patients.
Objective image noise
Image noise was defined as the SD of attenuation measured in the air of the tracheal lumen above the aortic arch. CT attenuation was measured on 2 sets of lung window images (standard-dose CT, ultra-low-dose CT). Each region of interest (ROI) was delineated at the tracheal lumen above the aortic arch, and the size and location of the ROI were held constant across the 2-image series. The SD was measured 3 times, and the mean value was used in the analysis.
Subjective visual assessment of image quality
All image sets (from which the patient information and image parameters had been deleted) were assigned random numbers, and image analysis was performed. Image quality was assessed by reference to both normal pulmonary structures and various pulmonary lesions.
Normal pulmonary structures (airways, vessels, pleura, and sub-pleural lung)
On the 5-point scale: 1 – denotes excellent image quality without artifacts, 2 – denotes slight blurring that did not compromise image assessment, 3 – denotes moderate blurring that slightly compromised assessment, 4 – denotes severe blurring rendering evaluation uncertain, 5 – denotes non-diagnostic image quality featuring strong artifacts.
Ratings of 1 to 5 were given to each of the above-mentioned normal pulmonary structures. The sum of these ratings was taken as the overall image quality score. The lower the score, the greater the diagnostic quality.
Image quality assessment for various pulmonary lesions
Subjective visual assessment was performed on 12 categories of pulmonary lesions as follows: consolidation, ground-glass opacity, emphysema, bronchiectasis, bronchial wall thickening, pulmonary nodules, tree-in-bud appearance, interstitial septal thickening, pleural effusion, mosaic attenuation, fibrosis, and subsegmental atelectasis. The presence or absence of pulmonary lesions in each category was noted.
While assessing the solid pulmonary nodules, those that measured larger than 3 mm were selected and compared with standard and ultra-low-dose CT. The maximum number of nodules selected for any patient was 5, which were of the greatest dimensions. The image sets, from which patient information and image parameters had been deleted, were used to perform size measurements.
Radiation dose estimations
The CT dose index volume (CTDIvol) and the dose length product (DLP) were recorded for each patient. The effective radiation dose (in millisieverts) was estimated by multiplying the DLP by a chest-specific conversion coefficient (0.014 mSv/mGy × cm).
Statistical analysis
The collected data were analysed using IBM-SPSS v27.0. Continuous variables were reported as mean ± SD, and categorical variables were reported as frequencies or percentages. The measure of agreement in terms of nodule size among standard and ultra-low-dose CT was determined with the aid of Cohen kappa (κ) statistics. A κ value of 0 ≤ κ ≤ 0.20 was regarded as poor, 0.2 < κ ≤ 0.4 was fair, 0.4 < κ ≤ 0.6 was moderate, 0.6 < κ ≤ 0.8 was good, and κ > 0.8 was excellent. Continuous variables, including radiation dose parameters, overall image quality scores, and image noise, were compared among the 2 groups (standard-dose CT and ultra-low-dose CT protocol) using a paired samples t-test. Bivariate analysis of discrete variables between both groups was done using the c2 test. The diagnostic accuracy of various pulmonary lesions in ultra-low-dose CT and standard-dose CT was measured and expressed using sensitivity, specificity, positive predictive value, and negative predictive value. A p-value of < 0.005 was considered as statistically significant.
Results
A total of 124 patients were included in the study (81 males and 43 females). The mean (± SD) age was 55.78 ± 15.63 years (range, 12 to 85 years). The mean body mass index (BMI) was 25.33 ± 5.37 (range, 16.29 to 39.00). Twenty-six patients had a BMI of 19.9 or less, 36 patients had a BMI of 20.0 to 24.9, 33 patients had a BMI of 25.1 to 29.9, and 29 patients had a BMI of ≥ 30.
Objective image noise
The mean ± SD value of image noise (HU) in standard-dose CT was 46.02 ± 14.16 and that of ultra-low-dose CT was 81.73 ± 17.71. Thus, the image noise was higher in ultra-low-dose CT, and there was a significant statistical difference between them.
Overall image quality for normal pulmonary structures
The mean ± SD value of the overall image quality score for standard-dose CT was 5.0 ± 0 and that of ultra-low-dose CT was 7.54 ± 1.43. The mean score was higher for ultra-low-dose CT with a statistically significant difference as compared to the standard-dose CT. Therefore, it was clear that the standard-dose CT yielded higher image quality than the ultra-low-dose CT.
The overall image quality was determined to be diagnostic in 100% of standard CT images and 96.77% of ultra-low-dose CT images. Only 4 of the total 124 patients had non-diagnostic-quality images in ultra-low-dose CT scans; all these patients had a higher BMI (≥ 30).
The mean ± SD values of image quality in ultra-low-dose CT were 6.57 ± 0.57, 6.80 ± 0.46, 7.81 ± 1.01, and 9.00 ± 1.82 in patients with BMI ranges of ≤ 19.9, 20.0-24.9, 25.0-29.9, and ≥ 30, respectively. On the other hand, the mean ± SD values were the same (5.0 ± 0) in standard-dose CT among patients with all the above-mentioned BMI ranges.
It was observed that there was a proportional increase in the image quality score as the BMI range increased. Statistically significant differences were observed between both protocols among patients in all the BMI ranges.
Subjective assessment of image quality for various pulmonary lesions
The findings of standard CT were used as a reference standard for comparison with the findings of ultra-low-dose CT. The imaging findings are summarized in Table 2.
The order of sensitivity for various pulmonary lesions in ultra-low-dose CT was as follows: consolidation (97%) > pleural effusion (95%) > fibrosis (92%) > solid pulmonary nodules (91%) > subsegmental atelectasis (82%) > ground glass opacity (68%) > tree-in-bud appearance (50%) > pulmonary emphysema (41%) > bronchiectasis (38%) > bronchial wall thickening (36%), interstitial thickening (32%), and mosaic attenuation (9%).
The ultra-low-dose CT expressed higher sensitivity (> 90%) for the detection of solid pulmonary nodules of size > 3 mm and ≤ 20 mm (Figure 1), consolidation (Figure 2), pleural effusion (Figure 3), and fibrosis (Figure 4).
No false-positive results were observed in ultra-low-dose CT.
Specificity and positive predictive value (PPV) were 100% for all the 12 categories of pulmonary lesions in ultra-low-dose CT.
In ultra-low-dose CT, most of the analysed pulmonary lesions yielded a higher negative predictive value (> 90%).
Figure 1
Axial sections of computed tomography (CT) showing detectability of solid pulmonary nodule (yellow arrow) by ultra-low dose CT. Solid pulmonary nodule was well seen on both standard and ultra-low dose CT scans
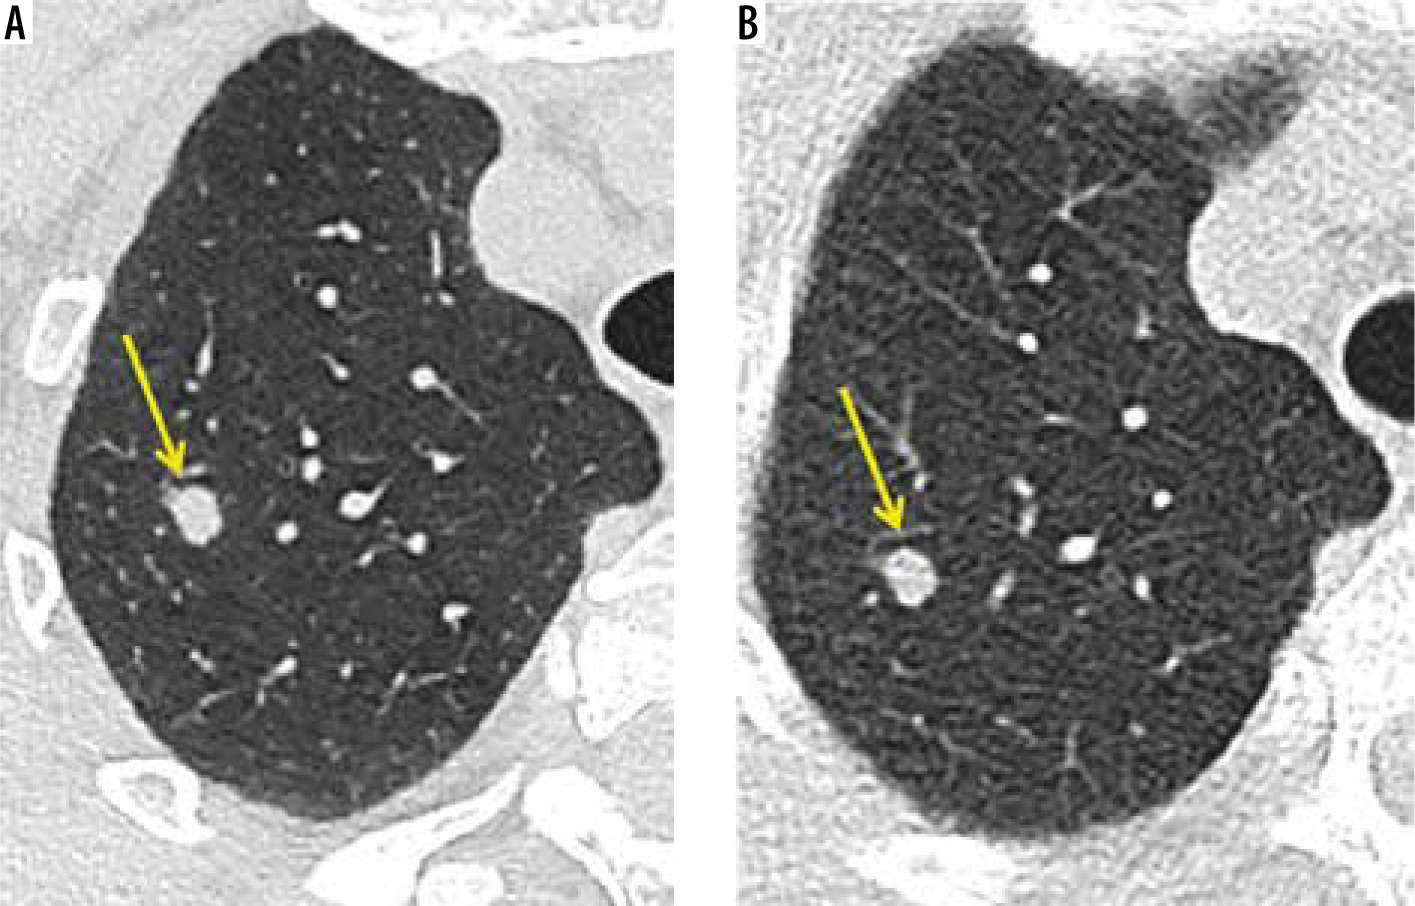
Figure 2
Axial sections of computed tomography (CT) showing detectability of consolidation (yellow arrow) by both standard ultra-low dose CT
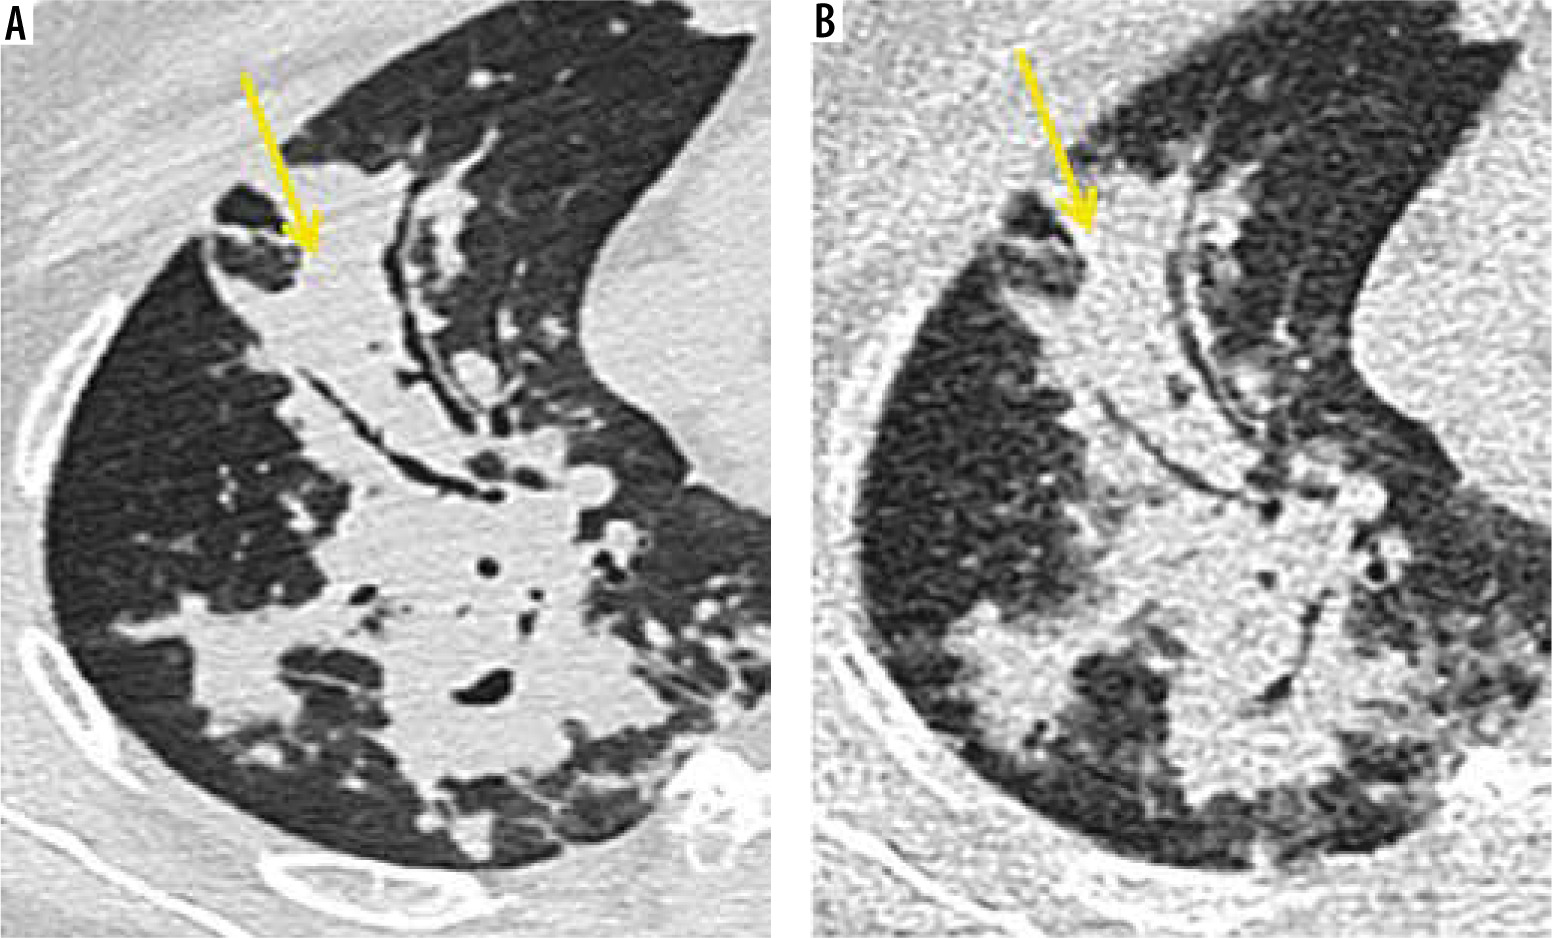
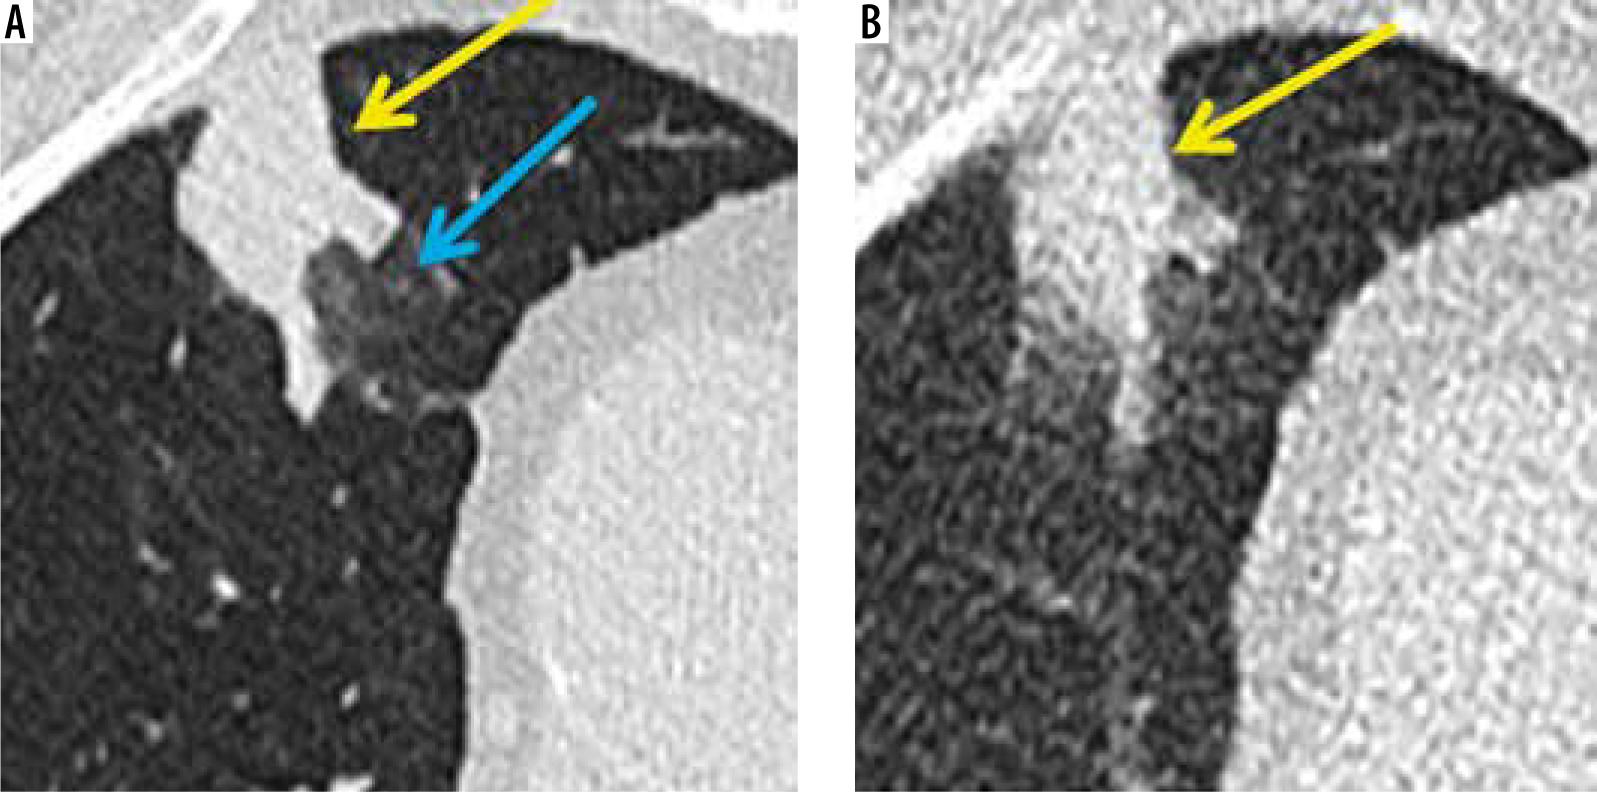
Figure 3
Axial sections of computed tomography (CT) showing detectability of pleural effusion and non-detectability of emphysema by ultra-low dose CT. Pleural effusion was obvious on both standard and ultra-low dose CT scans. The mild paraseptal emphysematous changes (yellow arrow) as evident on standard CT were not appreciated on ultra-low dose CT
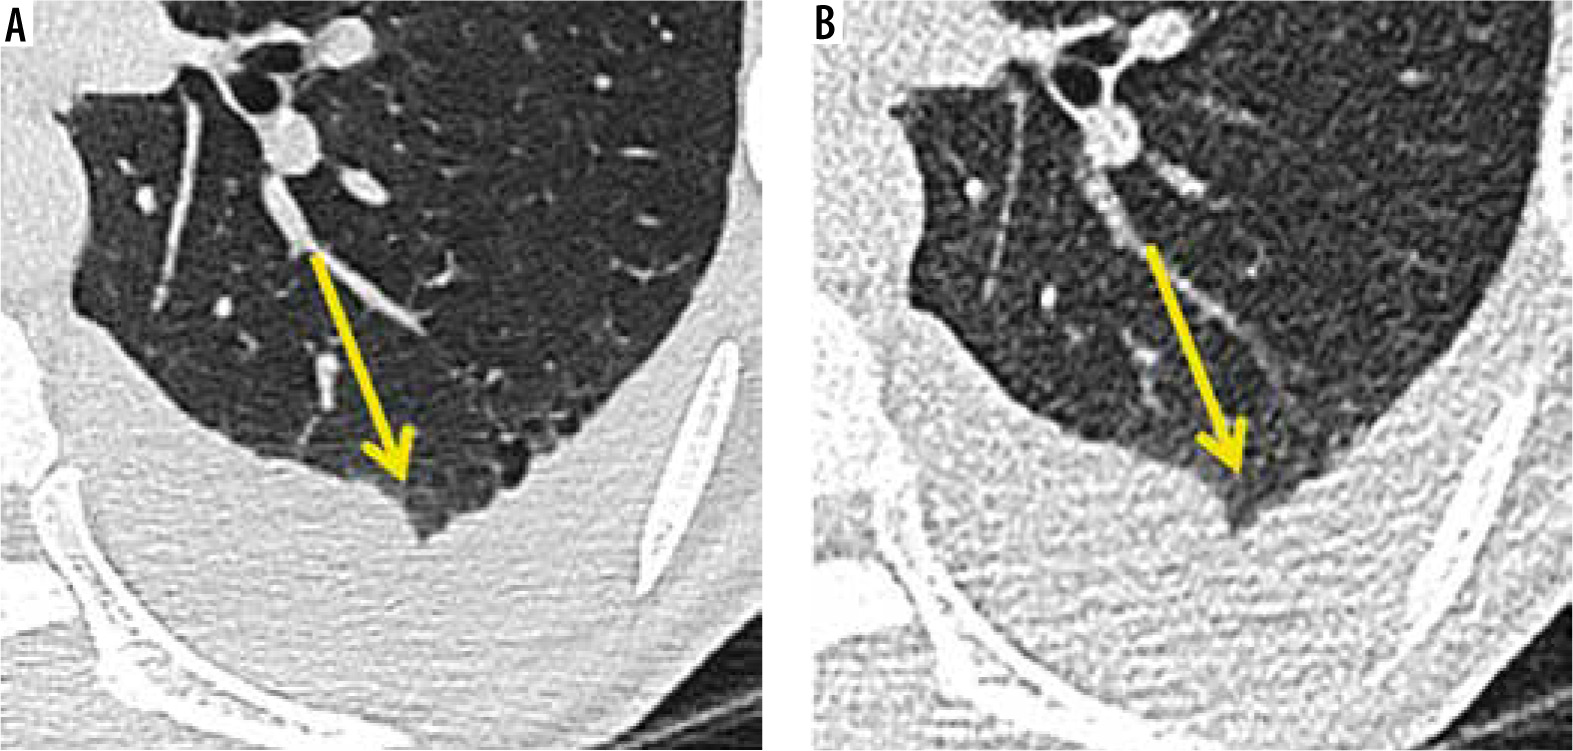
Figure 4
Axial sections of computed tomography (CT) showing detectability of fibrosis (yellow arrow) and non-detectability of bronchiectasis (yellow arrow) by ultra-low dose CT. Fibrosis is appreciated on both standard and ultra-low dose scans. But bronchiectatic changes were missed on ultra-low dose CT
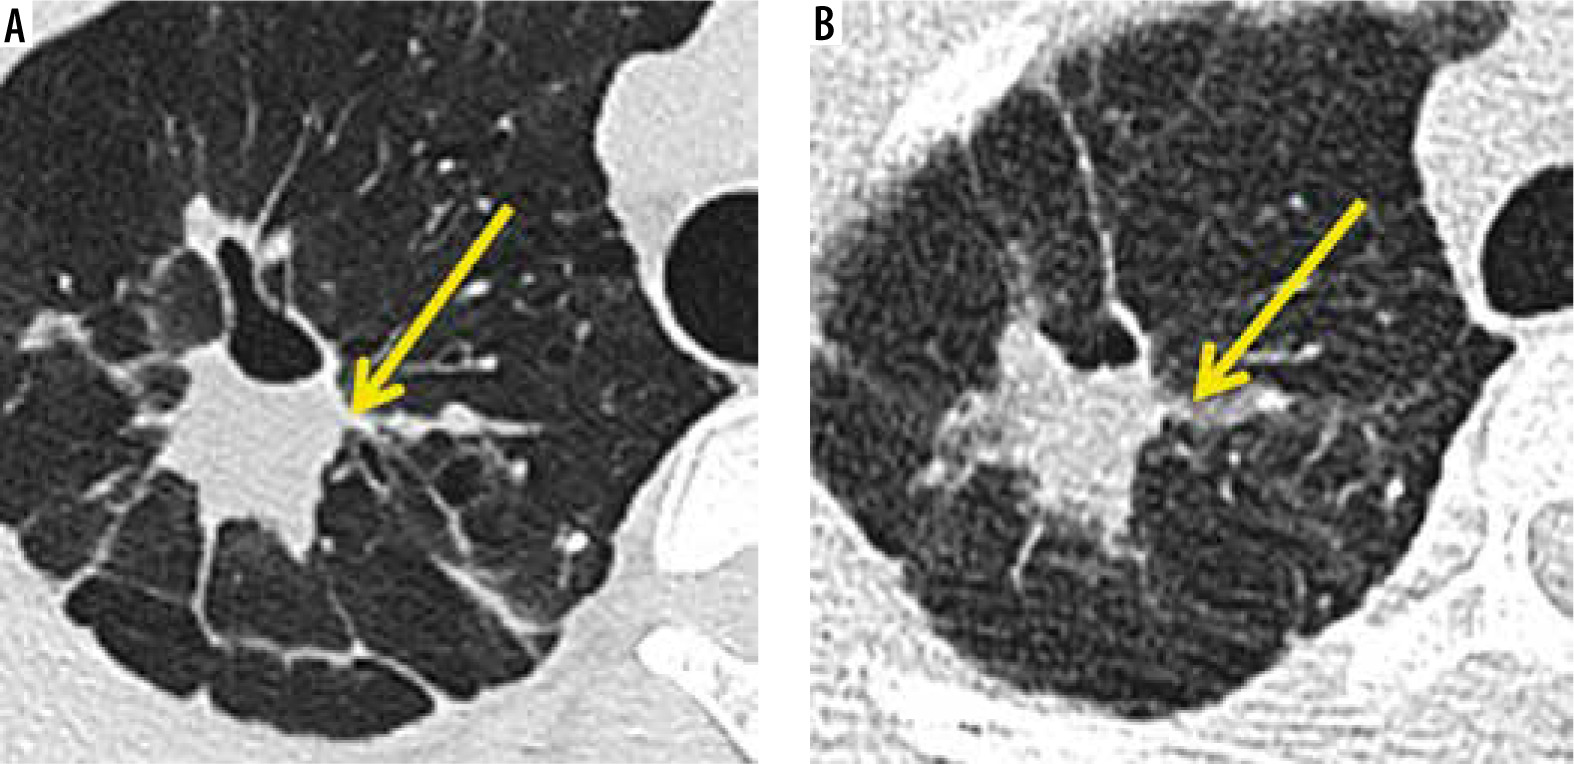
Table 2
Analysis of various pulmonary lesions
Pulmonary nodule size assessment
A total of 65 solid nodules in 22 patients that were 3 mm to 20 mm in the longest dimension were measured in both standard CT and ultra-low-dose CT and compared. The measure of agreement was excellent (κ = 0.944) and statistically significant (p < 0.001) for standard CT and ultra-low-dose CT in size measurements of pulmonary nodules.
Radiation dose estimation
The mean CT dose index volume (mGy), dose length product (mGy × cm), and effective radiation dose (mSv) showed statistically significant differences on both standard and ultra-low-dose CT protocols. The ultra-low-dose CT protocol was associated with a statistically significant reduction in radiation dose compared to standard CT (Table 3).
Table 3
Comparison of radiation dose parameters between standard and ultra-low-dose computed tomography
Discussion
Owing to its greater diagnostic accuracy, there are several clinical indications for HRCT thorax, including screening for lung cancer and the diagnosis of benign lung parenchymal diseases such as pulmonary infection. The radiation risk incurred by patients is one of the major concerns that prevent its extensive use. Although low-dose CT was developed to overcome this, it also raises the concern of radiation risk in young patients and those undergoing repetitive CT examinations. It will be a boon if CT could be performed with the same diagnostic accuracy with a dose almost equivalent to that of a chest X-ray. This study was done to evaluate whether ultra-low-dose CT was able to serve this purpose.
In our study, the results showed good diagnostic accuracy of ultra-low-dose CT in the detection of > 3 mm sized solid pulmonary nodules with a sensitivity of 91%, a specificity of 100%, PPV of 100%, and negative predictive value (NPV) of 98%. Hence, it could identify fresh lesions in an otherwise normal case, as well as monitor changes in the number of already diagnosed cases (provided the nodule size was > 3 mm) (Figure 1).
As well as changes in the number, the size of the existing nodule is also an important parameter to be assessed in follow-up studies. Our observation in this study was that the concordance value was excellent (κ = 0.944) and statistically significant (p < 0.001) for both standard and ultra-low-dose CT in size measurements of a total of 65 pulmonary nodules. However, further studies with a higher sample size are needed to prove the efficacy of ultra-low-dose CT in size measurements.
Neroladaki et al. [1] in 2012, Huber et al. [16] in 2016, and Messerli et al. [6] in 2017 concluded that there was a good detection rate for solid pulmonary nodules in ultra-low-dose CT (mean effective radiation dose ~0.13 to 0.16 mSv). Gordic et al. [17] in 2013 reported similar results at a dose of 0.06 mSv. Kim et al, [18] in 2015 concluded that ultra-low-dose protocols with doses of 0.44 and 0.31 mSv also allowed size measurements.
Thus, ultra-low-dose CT can be utilized for screening and follow-up studies of primary or secondary lung cancers for the detection or exclusion of solid pulmonary nodules of size > 3 mm and monitoring of the number of > 3 mm sized solid pulmonary nodules. The average dose (0.05 mSv) offered by the ultra-low-dose protocol of our study deserves a particular mention because it was much lower than any of the previous protocols, with excellent dia-gnostic quality.
In addition to solid pulmonary nodules, diagnostic accuracy was also obtained for consolidation, pleural effusion, and fibrosis; all of them had sensitivity > 90%. Hence, their progression or resolution as a response to treatment could be identified using ultra-low-dose CT during follow-up. This is in concordance with the observation of Kim et al. [18] stating that ultra-low-dose CT could offer diagnostic-quality images for instances of increased attenuation.
Although lesions with good sensitivity like consolidation and pleural effusion are important findings of cardiogenic pulmonary oedema, ultra-low-dose CT has still not been recommended as an initial imaging modality. This is because other findings of this condition like smooth interstitial thickening and ground glassing (Figure 6) had a sensitivity of < 90%, and the diagnosis could be missed if the later ones were the sole CT manifestations, which may be the case in early stages. However, the ultra-low-dose CT could be used in follow-up imaging of this condition to look for resolution of consolidation.
In our study, there was a sensitivity of <90% for tree-in-bud nodules, ground glassing, interstitial thickening, bronchiectasis, bronchial wall thickening (Figure 5), subsegmental atelectasis, mosaic attenuation (Figure 5), and pulmonary emphysema. Hence, ultralow dose CT played no remarkable role in the evaluation of pulmonary infection with the above-mentioned presentations, diffuse infiltrative lung disease, and COPD.
Figure 5
Axial sections of computed tomography (CT) showing non-detectability of mosaic attenuation (yellow arrow) and bronchial wall thickening (blue arrow) by ultralow dose CT
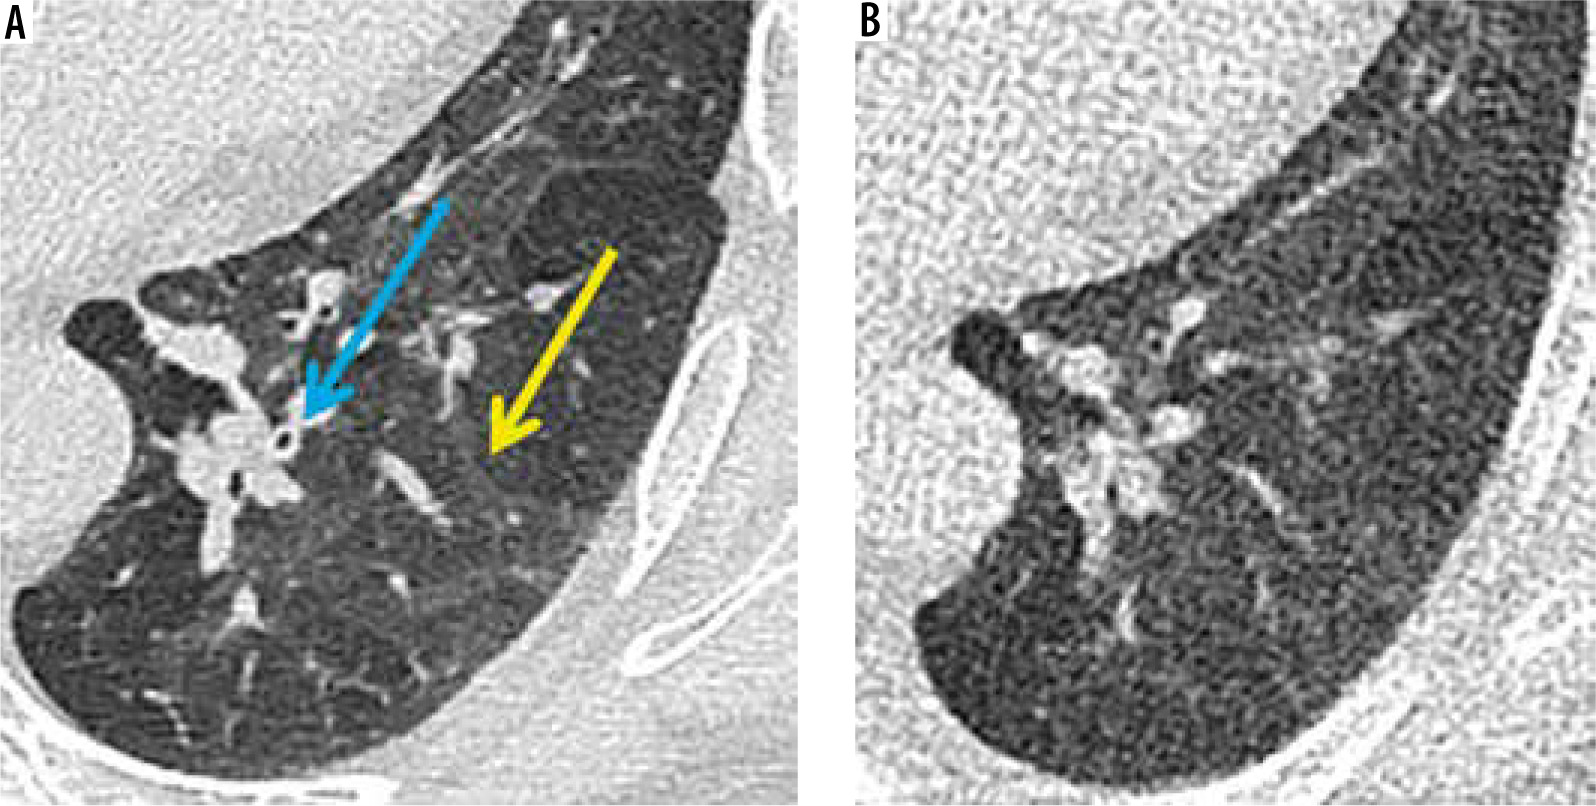
Figure 6
Axial sections of computed tomography (CT) showing detectability of consolidation (yellow arrow) and non-detectability of ground-glassing (blue arrow) by ultralow dose CT
Kim et al. [18] also quoted the limited role of ultra-low-dose CT in pulmonary emphysema, but for tree-in-bud nodules, ground glassing, interstitial thickening, bronchiectasis, and bronchial wall thickening the results were contradictory. This could be explained by the higher mean effective radiation dose (0.3 mSv) in their ultra-low-dose protocol in contrast to that used by us (0.05 mSv). Moreover, in their study the comparison was made between low-dose and ultra-low-dose CT, whereas in our study it was between standard-dose and ultra-low-dose CT.
Owing to the current COVID-19 pandemic, CT of the chest had been used as a screening modality in many institutions. Ground glassing was the most important CT manifestation, which unfortunately had a sensitivity of < 70% in ultra-low-dose CT, and hence this protocol was not recommended for imaging in this case. Shiri et al. [19] also suggested that ultra-low-dose imaging was not diagnostic of this condition.
In the context of image quality for normal pulmonary structures, it was found that ultra-low-dose CT offered dia-gnostic image quality in 96.77% of patients. Only 4 of the total 124 patients had non-diagnostic image quality, and all these patients had BMI > 30. This interpretation reinforced the conclusions of Lee et al. [20] and Ye et al. [21] that better results could be observed by using this protocol selectively for patients with BMI < 30.
In our study, the mean value of image noise in standard-dose CT was 46.02 HU whereas that of ultra-low-dose CT was 81.73 HU. Although the image noise offered by ultra-low-dose CT was statistically higher, the subjective image quality was diagnostic in most of the patients. Similar results were observed in a study by Kim et al. [18] in which statistically higher image noise was observed for ultra-low-dose CT when compared to low-dose CT (mean image noise: 76.8 HU and 102.3 HU vs. 47.7 HU). Lee et al. [20] also reported higher image noise for ultra-low-dose CT as compared to a CT protocol that was similar to our standard CT (mean image noise: 86.7 HU vs. 33.0 HU).
The CT dose index volume (mGy), dose length product (mGy × cm), and effective radiation dose (mSv) are the 3 parameters that were used for radiation dose estimation in our study. All 3 parameters were significantly lower for ultra-low-dose CT when compared to standard CT. This was evident from the much lower mean values of CT dose index volume (0.1 mGy), dose length product (3.63 mGycm), and effective radiation dose (0.050 mSv) in ultra-low-dose CT when compared to 7.87 mGy, 285.44 mGycm, and 3.99 mSv, respectively, in standard CT. The mean effective radiation dose is around 30 times lower than a usual low-dose chest CT protocol. The mean radiation dose (0.05 mSv) in our ultra-low-dose CT protocol was inarguably low because it was very close to the dose of a chest X-ray (0.02 mSv) and also lower than previous studies of ultra-low-dose CT, e.g. Lee et al. [20] (0.29 mSv), Agostini et al. [22] (0.28 mSv), Macri et al. [3] (0.27 mSv), Yoon et al. [11] (0.17 mSv), Neroladiki et al. [1] (0.16 mSv), Messerli et al. [6] (0.13 mSv), and Burgard et al. [23] (0.1 mSv). This dramatic reduction in radiation dose was made possible by incorporating recent techno-logies like high-pitch dual-source scanning (turbo flash) and tin filtration in our ultra-low-dose protocol.
Despite the limited role of ultra-low-dose CT in diagnosing various clinical conditions, the drastically reduced radiation dose has made it a recommended tool wherever possible. In that context, ultra-low-dose CT could emerge as a revolutionary tool in thoracic imaging wherever indicated.
Conclusions
The ultra-low-dose chest CT images acquired in a third-generation Siemens dual-source CT scanner employing 100 kVp and 30 mAs with turbo flash and tin filtration techniques offered a mean effective radiation dose of 0.05 mSv, which is almost equal to that of dose of a chest X-ray. Ultra-low-dose CT could be used for the detection and follow up of > 3 mm-sized solid pulmonary nodules. It is also useful for the follow-up imaging of consolidation and fibrosis to look for either progression or resolution. However, ultra-low-dose CT plays no remarkable role in evaluating pulmonary infection including COVID-19 infection, pulmonary oedema, diffuse infiltrative lung disease, and COPD.