


Introduction
Echinococcosis, a zoonotic disease caused by the larval form of cestode Echinococcus, still constitutes a major health concern in many areas. Among the four known species of Echinococcus, human infections are caused preponderantly by two species, namely E. granulosus and E. multilocularis. Morphologically hydatid disease can be classified into two broad categories. The more common unilocular cystic form caused by E. granulosus and less common form of multilocular alveolar hydatid caused by fox tapeworm E. multilocularis [1,2]. The bulk of human infections of alveolar echinococcosis have been reported from endemic zones including Turkey, former Soviet Union, Iran, Iraq, China, and Japan [3]. By contrast, cases of E. granulosus infection are cosmopolitan and are found in all the continents. Alveolar hydatid disease is the more fulminant form and carries a poor prognosis in the absence of early diagnosis and treatment. This parasite has a sylvatic (wild) life cycle that involves a definitive host and natural intermediate host. The definitive hosts are red foxes, and rodents are the intermediate hosts. Humans are accidental hosts [4].Upon ingestion the eggs of E. multilocularis develop into metacestodes in liver, lungs, or spleen. Less commonly kidneys, bones, brain, or muscle are affected. The slowly growing metacestodes produce infiltrative growth patterns that closely mimic neoplastic disease. The larval mass proliferates peripherally, and at the same time regressive changes occur centrally, which produces a progressively enlarging mass of necrotic tissue with a zone of peripheral viable proliferating tissue [1,5]. Florid fibro-inflammatory reaction that develops around parasitic tissue commonly affects the walls of biliary ducts and blood vessels, leading to obstruction. There is no clear margin between the parasitic tissue and the adjacent normal liver parenchyma, unlike E. granulosus, which is demarcated by an outer fibrous capsule referred to as pericyst. Hepatic alveolar echinococcosis (HAE) can cause biliary obstruction leading to cholangitis or secondary biliary cirrhosis, portal venous obstruction leading to portal hypertension, and its associated complications like variceal bleeding, hepatic venous outflow obstruction causing Budd-Chiari disease or complications related to heart, lung, or brain involvement [6,7].
More than one third of these infections are asymptomatic and are detected incidentally. Some cause mild symptoms while some present with dramatic symptoms. Owing to the broad repertoire of clinical manifestations, imaging is the cornerstone for diagnosing hydatid disease supplemented by serology. Histopathology is the final arbitrator. A thorough understanding and knowledge of the myriad imaging appearances of alveolar hydatid disease is quintessential to clinch the correct diagnosis of hydatid disease. Commonly used modalities for diagnosis and follow-up include ultrasonography (US), computed tomography (CT), and magnetic resonance imaging (MRI). Kodama et al. proposed a morphological classification of HAE based on T2W MRI [8]. It classified HAE into five types. Type 1 is composed of T2W hyperintense micro vesicular cysts without a solid component. Type 2 is composed of a solid hypointense component with hyperintense micro vesicular cysts. Type 3 shows dominant central hyperintense cystic component with a surrounding thick solid rind resembling a pseudocyst. Type 4 is a solid mass without any cystic component. And type 5 is a cystic lesion with no solid component. Diffusion-weighted imaging (DWI) depends on the haphazard microscopic motion of water protons and helps in assessment of tissue diffusivity by calculation of the apparent diffusion coefficient (ADC). DWI is increasingly used in characterisation of focal liver lesions. The purpose of this study was to report the gamut of imaging findings in hepatic alveolar echinococcosis (HAE) with an emphasis on the potential role of DWI in the characterisation of these lesions.
Material and methods
This was a descriptive, retrospective study covering a two-year period, from October 2017 to September 2019, conducted in two separate Radiology Departments of our state. The relevant clinical records and imaging findings of 23 histopathology-proven cases of hepatic alveolar echinococcosis (HAE) referred for diagnostic work-up during the study period were reviewed. Each included patient had prior USG and CT of the abdomen. Nineteen patients (82.6%) had also undergone MRI of liver, among whom 16 patients had also undergone DWI. For the purpose of this study, both the reports and the images were reviewed by the authors (one registrar in radiology and the other a consultant in radiology with seven years of experience). We studied ultrasound, CT, and MRI features of HAE. We studied the PNM staging of HAE in these patients on CT according to the World Health Organisation informal working group on echinococcosis (Table 1). Additionally, we calculated the mean apparent diffusion-weighted coefficient values of these lesions. One-way analysis of variance (ANOVA) was used to compare continuous variables (ADC values) between five types of lesions. A p-value of < 0.05 was considered statistically significant.
Table 1
PNM classification of hepatic alveolar echinococcosis
Results
Ultrasonography revealed features of ill-defined, heterogeneously hyper-echoic hepatic mass lesion with no detectable calcification in 12 cases (52%) (Figure 1). Eight patients (34.7%) showed ill-defined hyperechoic hepatic mass with scattered foci of calcification (Figure 2). Two patients showed complex hepatic mass with heterogeneous solid component and associated cystic areas. And one patient showed thick-walled cystic lesion with calcifications in the wall.
Figure 1
A) Transverse ultrasound image of liver shows a peripheral wedge-shaped hyperechoic mass in segment VII. B) Non-contrast axial computed tomography (CT) image shows wedge-shaped hypodense mass with central calcifications. Post-contrast axial CT image in portal phase (C) and hepatic venous phase (D) does not reveal any enhancement of the lesion. No biliary dilatation or vascular invasion is seen (P1 disease)
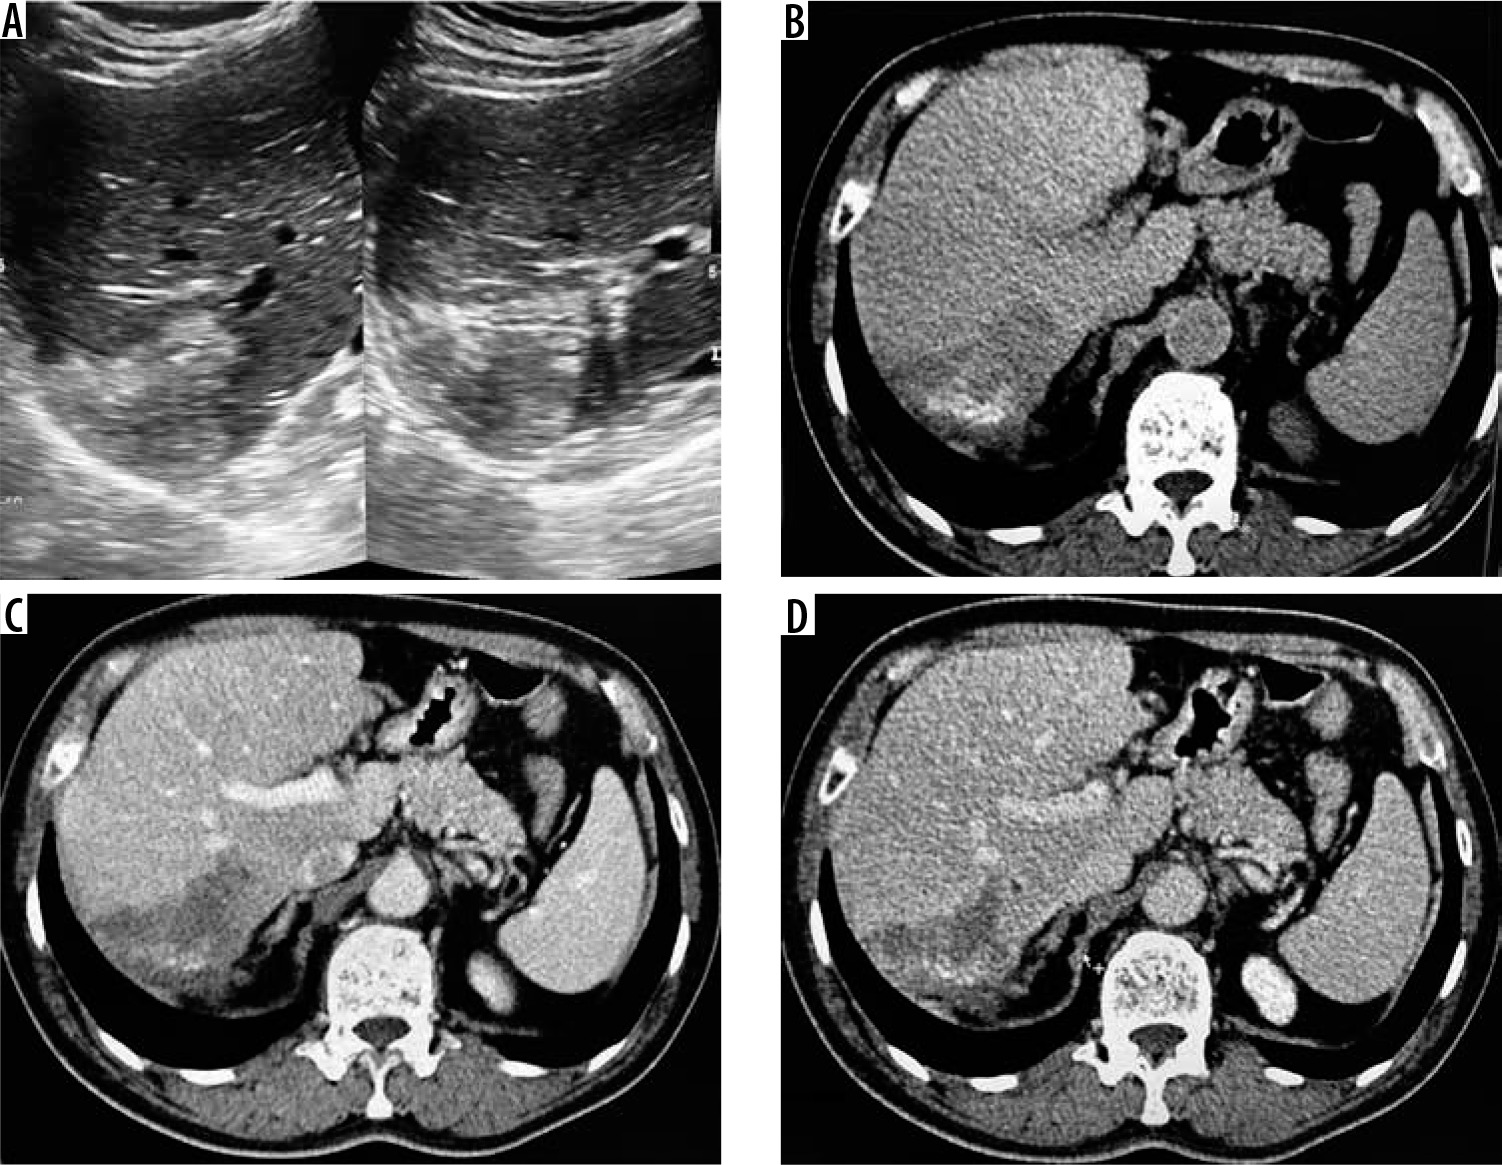
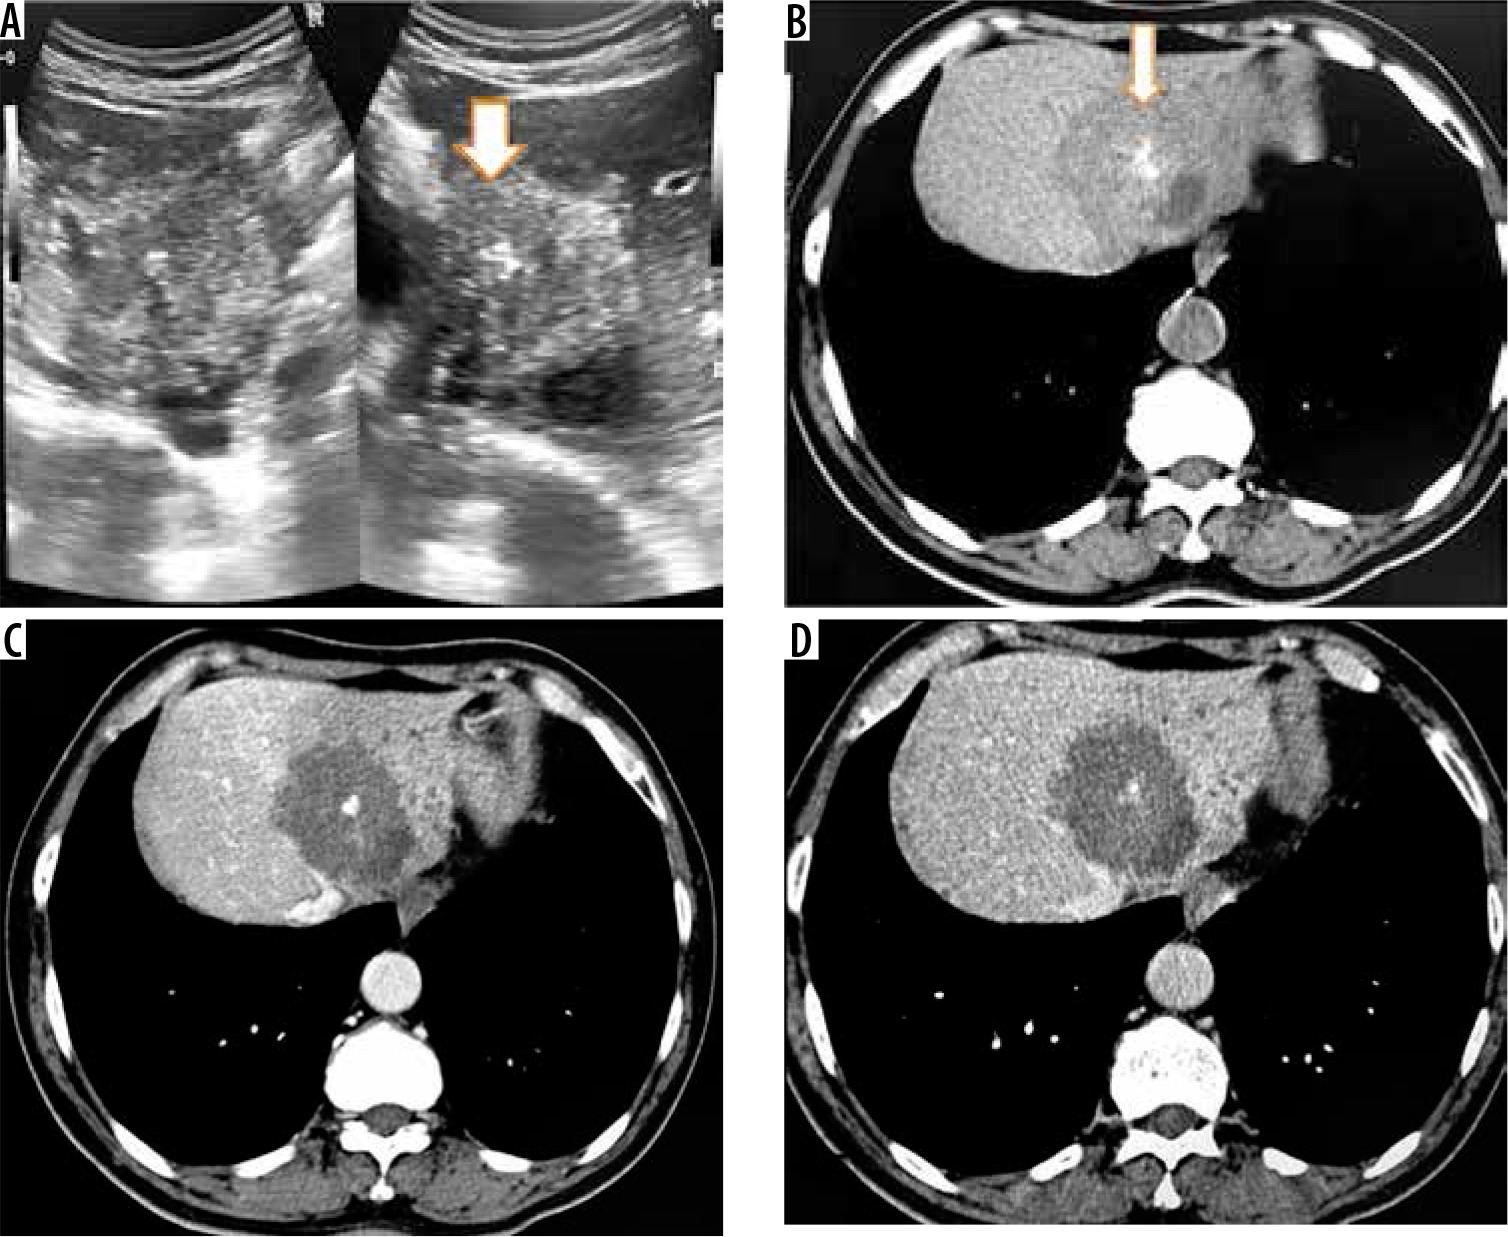
Figure 2
A) Transverse sonogram of liver shows a large heterogeneously hyperechoic mass with central foci of calcification (arrow). B) Axial non-contrast computed tomography (CT) image shows hypodense mass with central calcification (arrow). Post-contrast axial CT images (C, D) do not reveal any enhancement of the mass. There is left lobe biliary dilatation (P2 disease)
On non-contrast CT, 15 patients (65%) revealed hypodense hepatic mass with scattered foci of calcification with no associated cystic component (Figures 1 and 2). Four (17.3%) patients revealed complex hepatic mass with hypoattenuating cystic areas and hyperattenuating calcifications (Figure 3). Four (17.3%) patients revealed thick walled hypodense cystic lesion (Figure 4). None of the lesions showed intralesional enhancement in arterial, portal, or hepatic venous phase CT (Figures 1 and 2). Five cases showed mild peripheral irregular enhancement in hepatic venous phase. Hepatic atrophy with capsular retraction was seen in three cases. One patient had superadded infection with hepatic abscess formation that required pigtail catheter drainage. With regards to the extent of disease, seven patients showed peripheral hepatic lesions with no biliary or vascular involvement (P1). Biliary radical obstruction was seen in seven patients. Peripheral biliary radicals above the primary confluence were infiltrated in four (P2). Hepatic hilar involvement with both lobe biliary radical dilatation was seen in three patients (P3). Single hepatic vein involvement was seen in three patients (P2). Three patients showed combined infiltration of at least two hepatic veins (P3). Main portal vein encasement was seen in two patients, and two showed combined infiltration of both IVC and hepatic veins (P4) (Figure 5). Extra hepatic infiltration was seen in four cases including adrenal gland infiltration in two patients, parietal wall infiltration in one patient, and diaphragmatic invasion in one patient (Figure 6) (N1 disease). Three patients showed metastatic disease. Two among them had pulmonary involvement (Figure 6) and one had splenic involvement (M1 disease). A break up of the patients according to PNM staging is given in Table 2. On MRI all the patients showed hypointense signal intensity on T1-weighted sequence. On T2-weighted sequence one (5.2%) patient showed micro-vesicular cysts with no solid component (Kodama type 1) (Figure 3C). Six (31.5%) patients showed heterogeneous signal intensity mass with both hypointense solid and hyperintense cystic components (Kodama type 2) (Figure 3D). Two (10.5%) patients showed central hyperintense cystic component with surrounding hypointense solid component (Kodama type 3). Eight (42.1%) patients showed hypointense mass with no cystic component (Kodama type 4) (Figure 7). Two patients (10.5%) showed thick walled cystic lesions (Kodama type 5) (Table 3). Post-contrast T1-weighted images revealed no enhancement of the lesion. Three cases showed peripheral rim of enhancement in delayed phase. DWI revealed free diffusion characterised by low signal intensity on high b value DWI images and high signal on ADC in all cases (Figure 8) except one patient who had developed superadded infection with abscess formation and required pigtail drainage. Mean ADC value of HAE was 1.74 ± 0.48 × 10⁻³ mm2/s (range: 1.39 × 10⁻³ mm2/s to 2.3 × 10⁻³ mm2/s). Mean ADC of different Kodama types of HAE did not differ significantly from each other (p = 0.058) (Table 3). The mean ADC of the surrounding liver parenchyma was 1.10 ± 0.21 × 10⁻³ mm2/s.
Figure 3
Non-contrast axial (A) and corresponding post-contrast axial computed tomography image (B) of a young female reveals two heterogeneous density masses in inferior segments of both lobes of liver with mixed density pattern resulting from combination of cystic, solid component, and calcifications with absence of post-contrast enhancement. T2-weighted axial magnetic resonance images at slightly different levels reveal a bunch of micro vesicular cysts in segment VI (Kodama type 1 lesion) and another heterogeneous composition lesion having central T2 hypointense components with surrounding small cysts (Kodama type 2 lesion) in segment IV/V
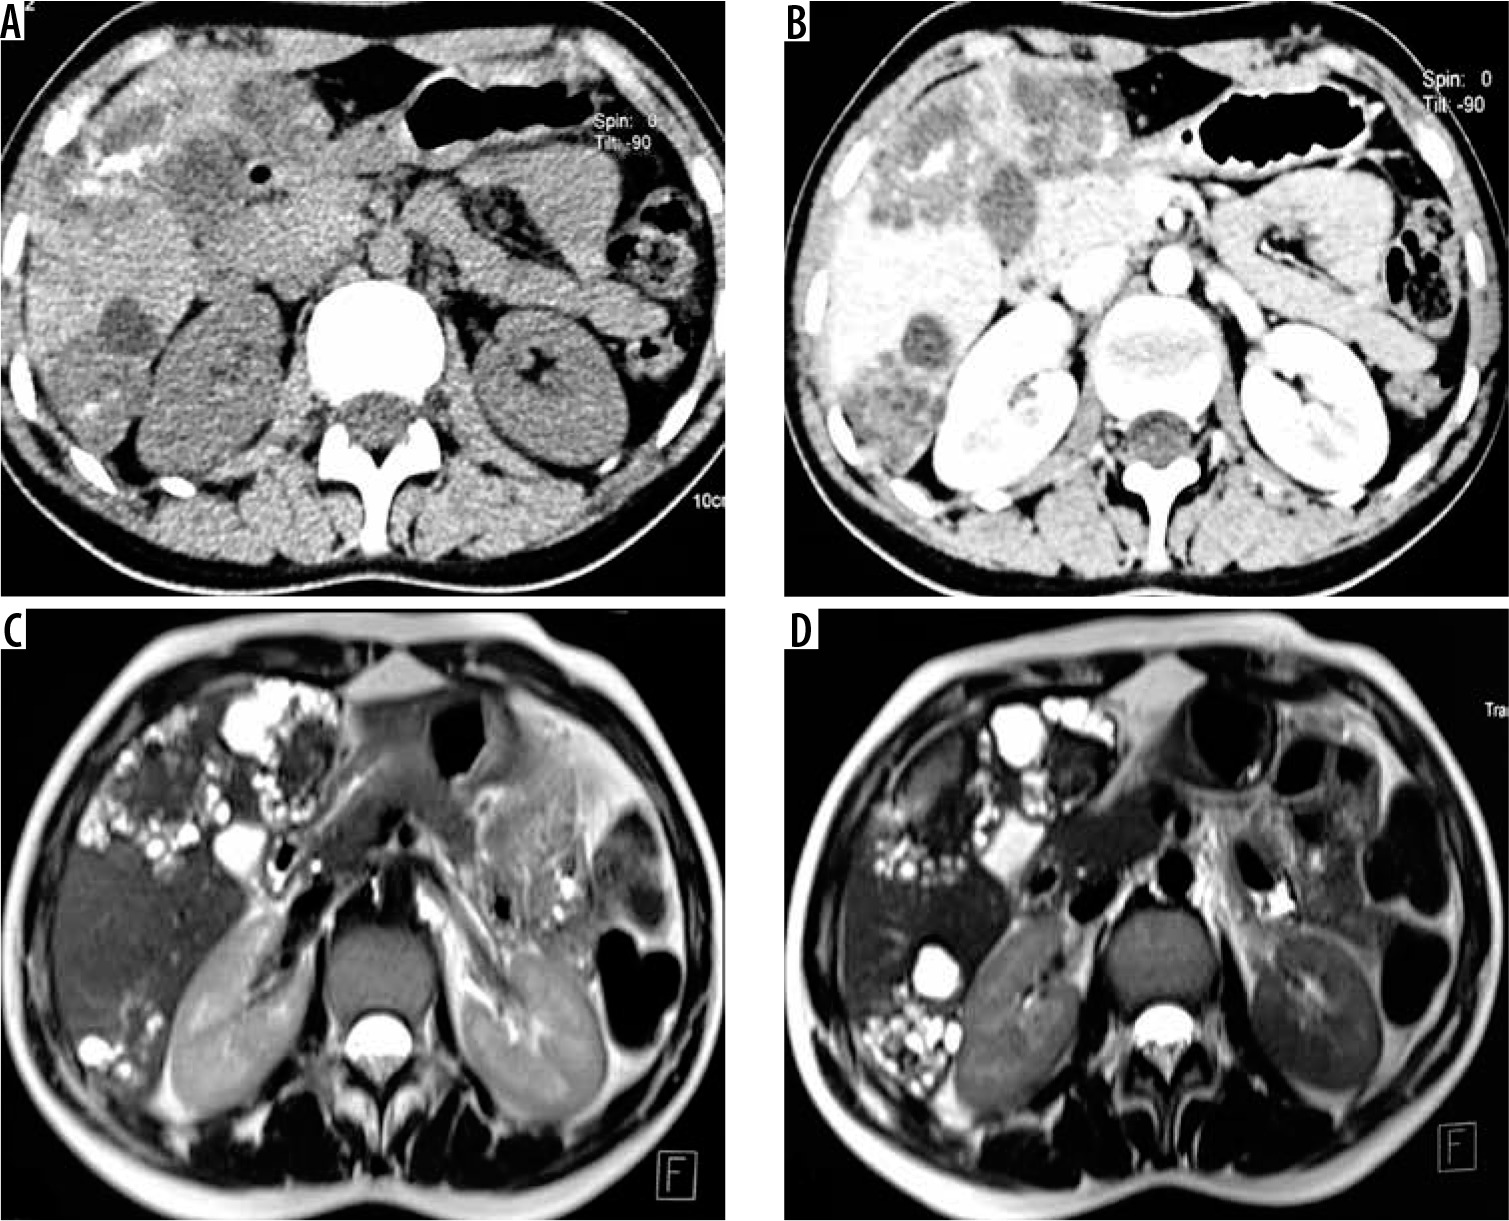
Figure 4
A) Non-contrast axial computed tomography (CT) image in a patient showing large thick-walled cystic mass in segment VII and VIII with peripheral calcification. B) Corresponding arterial phase axial CT image reveals absence of any enhancement. C) Axial non-contrast CT image in a different patient shows large heterogeneous density mass lesion in segment VII and VIII with sheet-like central calcification. D) Corresponding post-contrast axial CT image reveals no enhancement of the mass. The lesion is seen infiltrating the right and middle hepatic vein (P3 disease)

Figure 5
A) Axial non-contrast computed tomography (CT) image through upper abdomen reveals a large heterogeneous mass involving whole right lobe with scattered matrix calcifications with capsular retraction. Portal phase contrast-enhanced axial CT images (B, C) at slightly different levels reveal no enhancement of mass. B, C) Mass shows infiltration of hepatic hilum with encasement of portal vein, common bile duct, and hepatic artery. D) Sagittal post-contrast CT image clearly shows encasement of intra hepatic IVC (P4 disease)
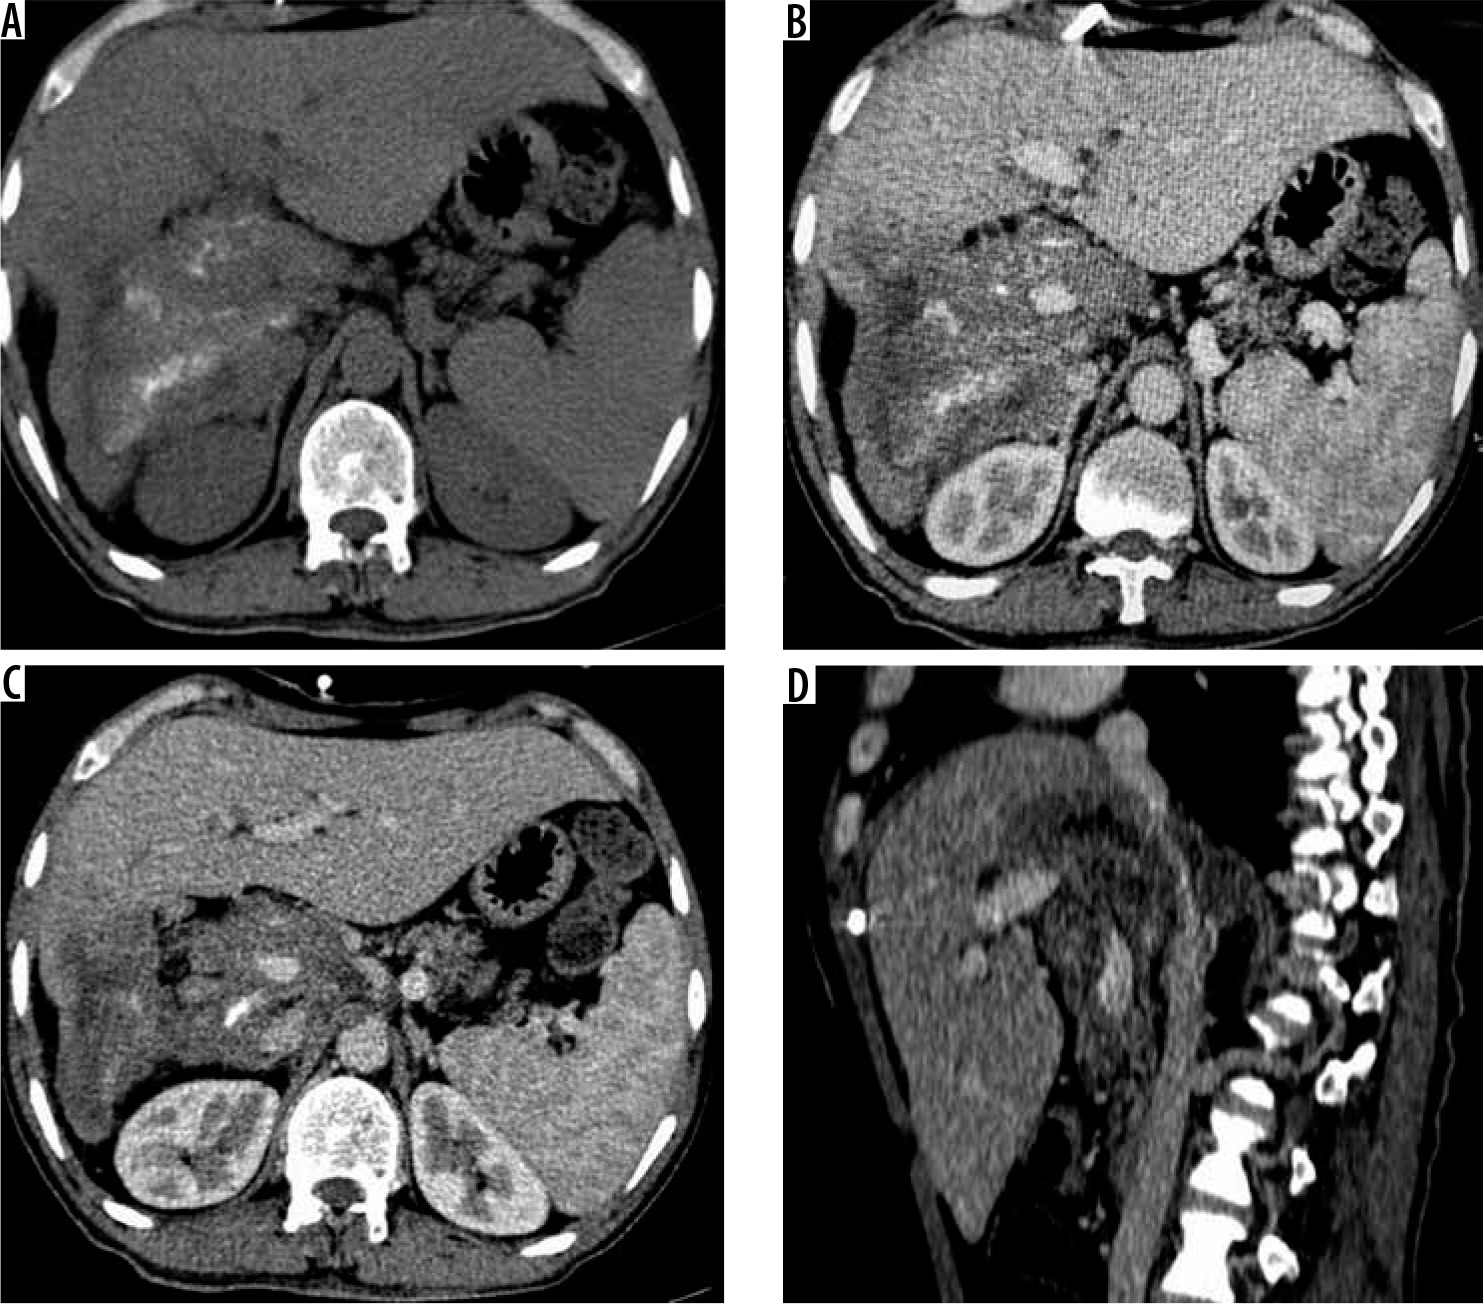
Figure 6
Axial non-contrast computed tomography (CT) (A) and post-contrast CT (B) images reveal infiltration of diaphragm and right adrenal gland (arrows) (N1 disease). C) Axial contrast enhanced image in another patient shows infiltration of parietal wall (arrow) (N1 disease). D) Axial contrast-enhanced CT image in a young boy shows metastatic involvement of left lung (M1 disease)
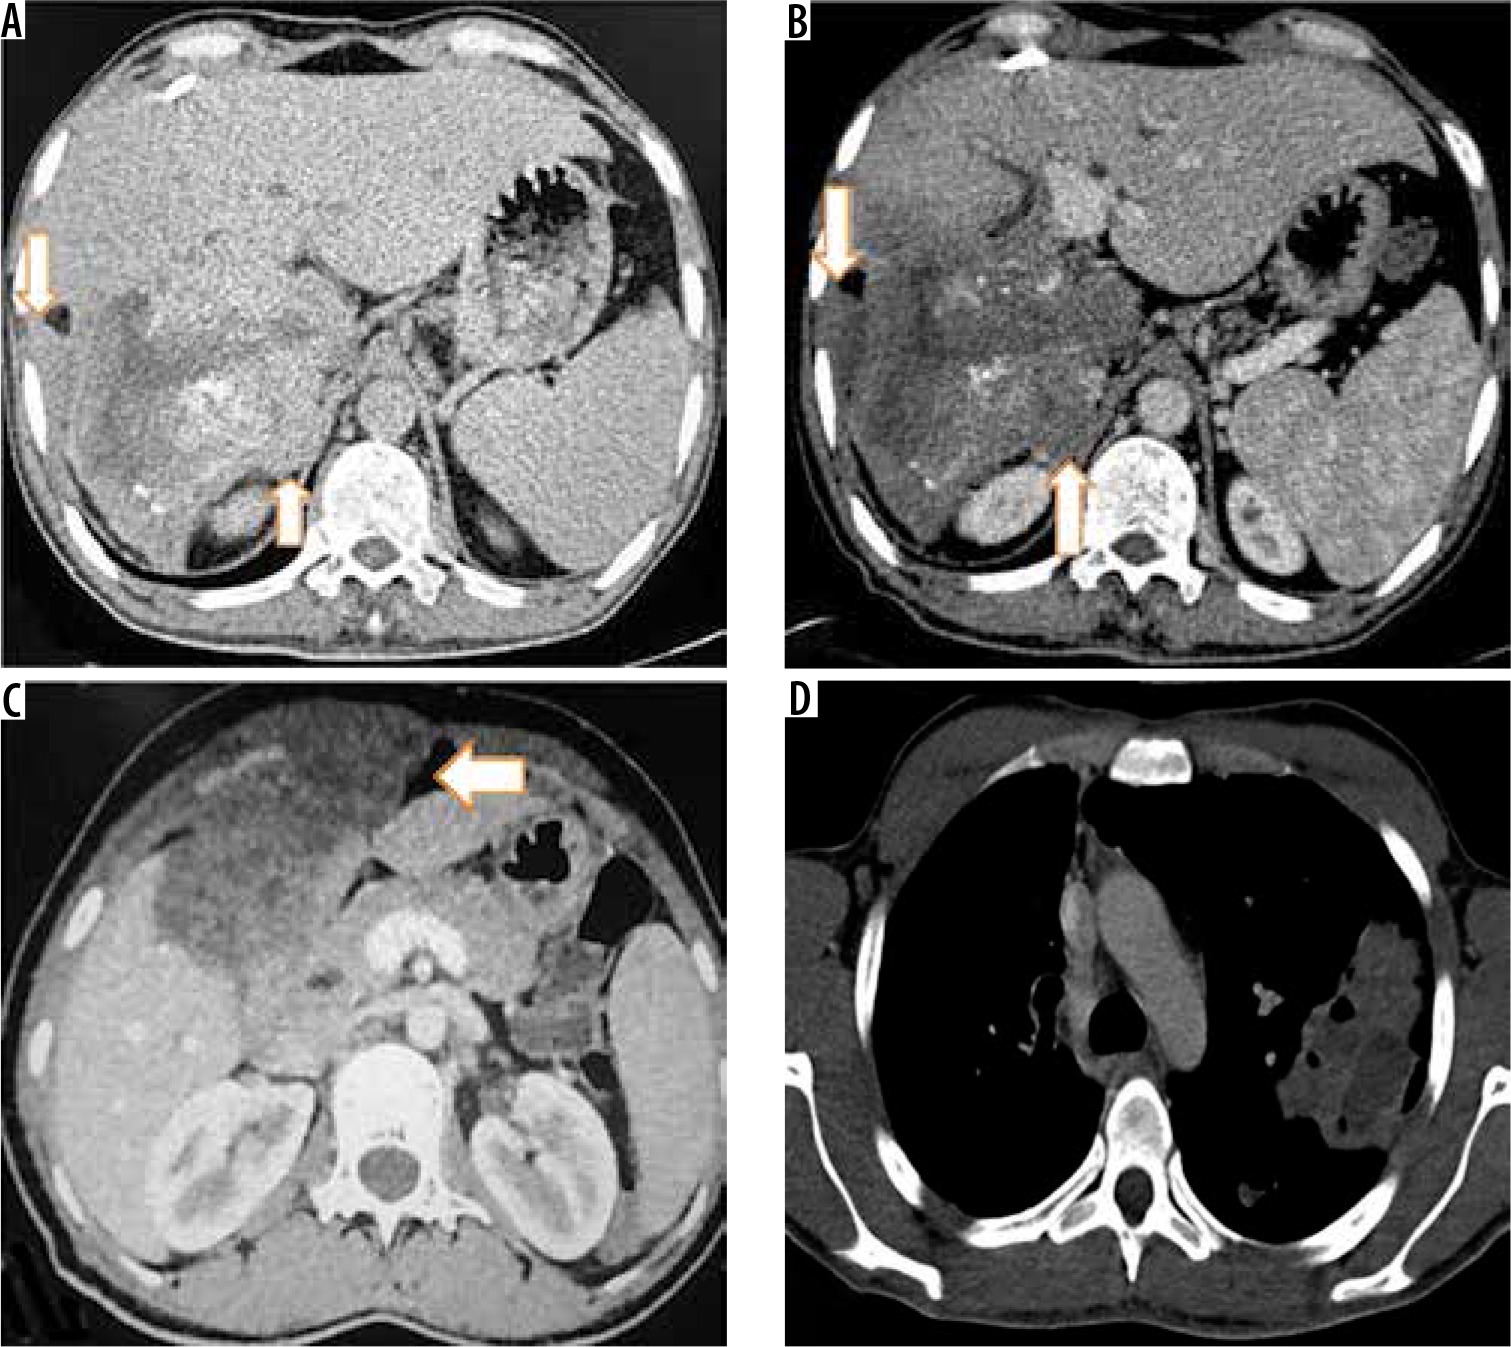
Figure 7
T2-weighted axial (A) and corresponding T-weighted magnetic magnetic resonance (MR) image (B) reveals solid hypointense peripheral lesion in segment VII. Post-contrast volumetric interpolated breath-hold examination (VIBE) MR image in arterial (C) and portal venous phase (D) reveals absence of contrast enhancement
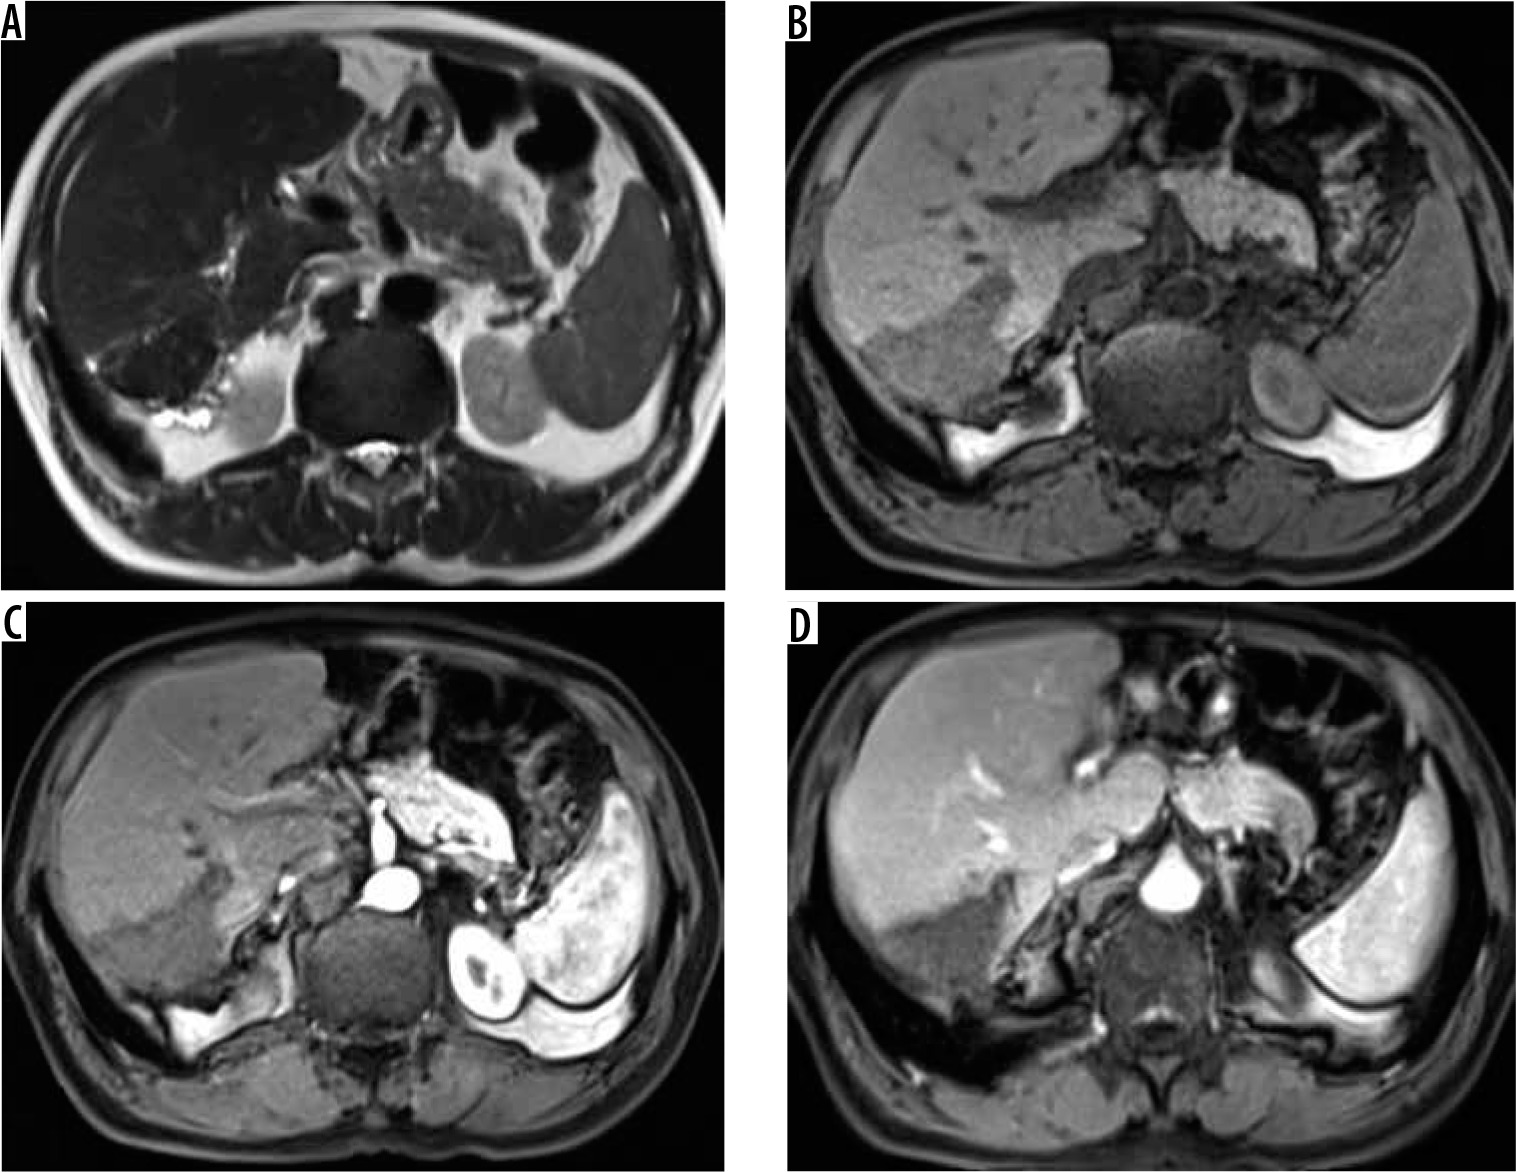
Figure 8
A) Axial T2-weighted magnetic resonance (MR) image shows hypointense hepatic mass lesion in segment IVa. Corresponding diffusion image (b-value 800 s/mm) shows free diffusion in the lesion (hypointense signal). High b-value (800 s/mm) diffusion-weighted image of the same patient shows another non-restricting lesion in segment VI. D) Apparent diffusion values (ADC) image shows both the hepatic lesions (arrows) with high signal intensity (free diffusion) and ADC value of 1.65 × 10⁻³ mm2 per second

Table 2
Showing break-up of patients as per PNM classification
| PNM stage | n (%) | |
|---|---|---|
| P | P1 | 7 (30.4) |
| P2 | 5 (21.8) | |
| P3 | 7 (30.4) | |
| P4 | 4 (17.4) | |
| N | N0 | 19 (82.6) |
| N1 | 4 (17.4) | |
| M | MX | 11 (47.8) |
| M0 | 9 (39.2) | |
| M1 | 3 (13.0) | |
Table 3
T2W MRI features of different types of hepatic alveolar echinococcosis according to Kodama classification and their ADC values
Discussion
Alveolar echinococcosis caused by cestodes of fox tapeworm, E. multilocularis, is a potentially lethal disease with high mortality in the absence of proper treatment. Metacestodes of E. multilocularis develop in the host organ and produce large infiltrative parenchymal masses. The liver is the commonest organ affected followed by lung, spleen, and brain. HAE is a master of disguise and closely mimics primary as well as metastatic tumours of the liver. Many cases are asymptomatic and are detected accidently. Symptomatic patients present with symptoms of mass effects of enlarging mass like upper abdominal discomfort or its complications including features of biliary, portal venous, or hepatic outflow obstruction [8-10].
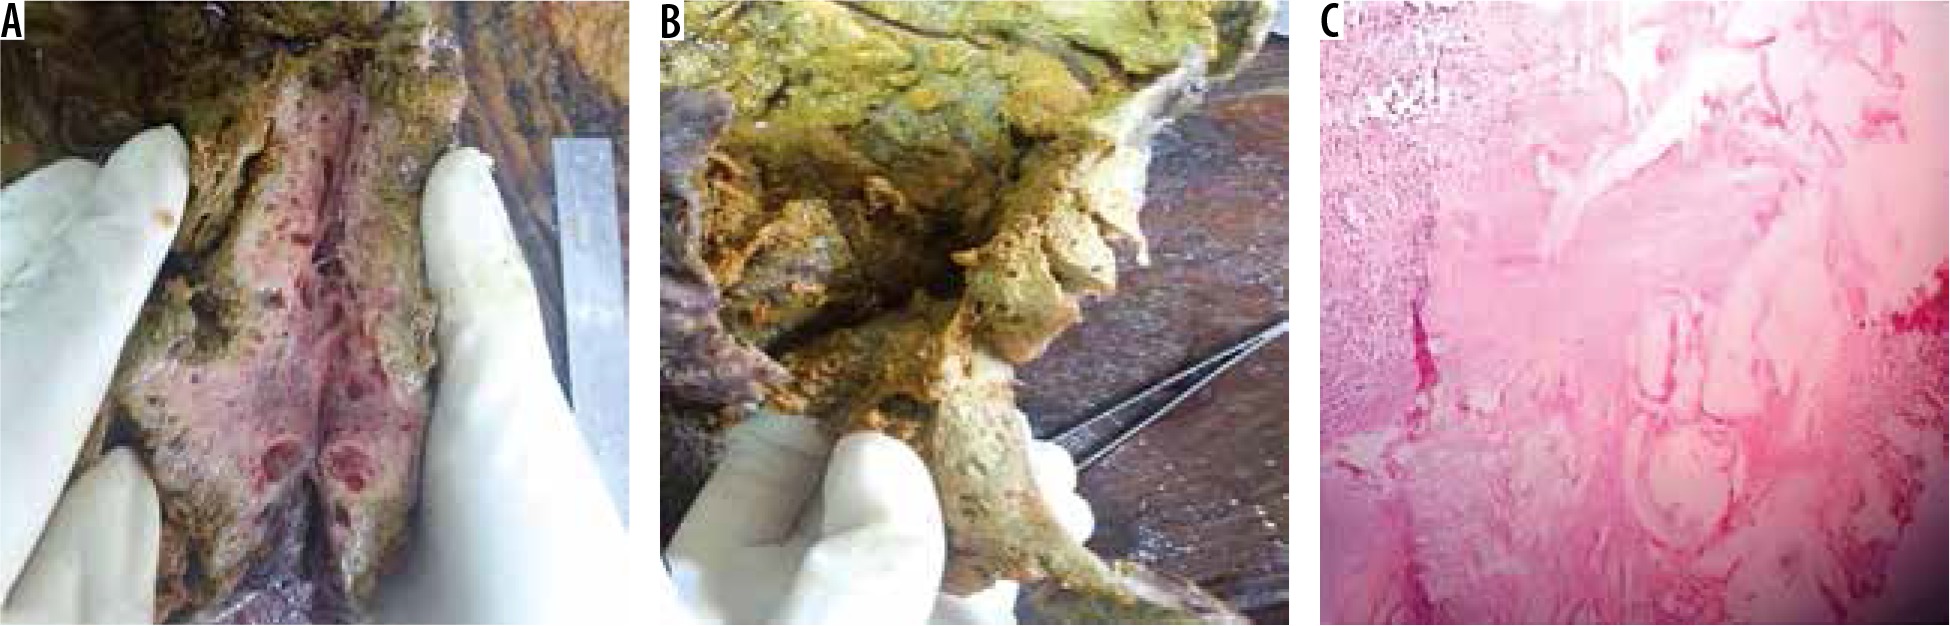
Gross pathological examination of HAE shows a multi- vesicular mass composed of numerous cysts of varying sizes with areas of fibrosis and calcification. There is no clear margin between the parasitic mass and surrounding hepatic parenchyma. Microscopic examination reveals cysts composed of outer laminar membrane and inner germinal layer with exuberant inflammatory cells and fibrosis (Figure 9).
Figure 9
A) Gross resected hepatic lobectomy specimen shows liver parenchyma replaced by multiple small cystic cavities. B) There was an also a huge cavity measuring 15 × 13 cm with thick wall. C) Low power (10×) photomicrograph revealed parasitic vesicles delineated by the laminated membrane, granulomatous infiltrate in form of epithelioid cells, macrophages, and diffuse mixed inflammation rich in eosinophils. Areas of calcification and hyalinization are also seen
Ultrasound is the initial modality used to scan these patients. Ultrasound features include poorly marginated hyperechoic mass with no detectable calcification or hyperechoic mass with calcification within the lesion or at the periphery. Less commonly a thick-walled cystic lesion is seen in necrotic forms. Heteroechoic mass with irregular margins and calcifications favours the diagnosis of HAE on ultrasonography [11,12].
CT is usually the second modality employed to assess a hepatic mass seen on preliminary ultrasound. On non-contrast CT, HAE typically appears as an irregular infiltrative mass with heterogeneous density pattern. Areas of low density in the mass correspond to necrosis and the parasite tissue, whereas hyperdense areas represent calcifications [13]. Calcification pattern can be sheet like, single calcification, multiple scattered foci of calcification, or dense intralesional calcifications. Following contrast administration, HAE does not enhance. However, in portal or hepatic venous phase, irregular peripheral enhancement corresponding to active fibro inflammatory tissue may be seen [14]. The growing hepatic parenchymal mass induces atrophy in liver with capsular retraction. In hepatic lesions with dominant cystic component, CT shows a large necrotic core surrounded by an irregular rind of fibrous tissue that often contains calcifications. The central necrotic core of these lesions may become infected with bacteria and fungi with resultant abscess formation. Ill-defined hepatic mass with calcifications with no enhancement in arterial, portal, or venous phase CT is a strong pointer towards the diagnosis of HAE. CT is also an excellent modality to demonstrate the extent and complications of HAE. It demonstrates vascular invasion, biliary invasion, and extrahepatic extension with exquisite detail and helps in planning treatment. Given the locally infiltrative nature of HAE and its ability to involve distant organs it is easily confused with malignant hepatic masses, earning it the moniker of malignant hepatic echinococcosis [15,16]. Invasion of the diaphragm, peritoneum, mesentery, spleen, pancreas, adrenal glands, kidneys, gallbladder, abdominal wall, and stomach have been reported. The lungs are the most common organ involved by metastasis, followed by the spleen [3,17,18].
The internal structure of HAE determines the MRI appearance. On magnetic resonance imaging HAE exhibit heterogeneous signal intensity on T2W sequence with both hypointense and hyperintense areas. Hyperintense areas correspond to the cystic portions, whereas fibrous tissue-rich solid complements and intralesional calcification exhibit hypointense signal intensity. On T1W sequence the cysts also appear hypointense to surrounding normal hepatic parenchyma. Post-contrast study usually does not reveal any enhancement of the lesion, but a few lesions may show irregular peripheral enhancement owing to fibro inflammatory reactionary tissue at the peripheral of HAE [19-21]. MRI is also essential to reveal biliary or hepatic vascular involvement or extra hepatic extension of mass into surrounding organs. DWI performed using different b values of 0, 50, 400, and 800 s/mm2 is a useful adjunct to routine MRI. It usually shows non-restricted diffusion with low signal intensity on high b-value diffusion images (b value of 400 s/mm2 and above) and high signal on ADC images compared to surrounding hepatic parenchyma [22,23]. Restricted diffusion can be seen only in cases with superadded infection and abscess formation. The ADC value of HAE is more than that of malignant hepatic lesions and less than that of other cystic lesions of the liver. The presence of free diffusion with high mean ADC value in a solid infiltrative hepatic mass is a vital clue to its diagnosis as malignant hepatic tumours exhibit restricted diffusion Mean ADC of 1.31 ± 0.29 × 10⁻³ mm2/s for cholangiocarcinoma was previously reported by Cui et al., which is clearly lower than the ADC value of HAE [24].
Although many studies are available on the imaging manifestations of hepatic alveolar echinococcosis, there is a paucity of literature on the role of DWI in hepatic alveolar echinococcosis. To the best of our knowledge, use of DWI in hepatic alveolar echinococcosis was first described by Becce et al. [22]. In a study population of 22 patients with 63 lesions, calcification on CT was reported in 56% cases. We observed calcification in the majority (87%) of cases on CT. On MRI they reported Kodama type 5 (33%) as the commonest lesion followed by Kodama type 2 (30%), type 3 (27%), and type 1 and 4 (5% each). Mean ADC was 1.76 ± 0.44 × 10⁻³ mm2/s. They did not find ADC helpful in classifying lesions along the lines of Kodama classification because the ADC values between different types of lesions were not statistically different except for those of type 4, which had ADC lower than other types (1.15 ± 0.42 × 10⁻³ mm2/s), with a p-value of 0.031. However, there were only three (5%) type 4 lesions in their study. Our results are concordant with the findings of Becce et al. Our results revealed Kodama type 2 and type 4 as the commonest lesions. The mean ADC of 1.74 ± 0.48 × 10⁻³ mm2/s in our study is similar to Becce et al. Among all Kodama type lesions, type 4 had the lowest ADC. However, there was a statistically insignificant difference (p = 0.058) in ADC values between various Kodama type lesions in our study, which is again in tune with the previously described study. Zheng et al. [25], in a study of eight patients of hepatic alveolar echinococcosis with total of 14 lesions in an attempt to study the role of DWI in discriminating between active versus quiescent stages of hepatic alveolar echinococcosis, reported a mean ADC value of 19.8 × 10⁻³ mm2/s (range 0.73 × 10⁻³ mm2/s to 3.38 × 10⁻³ mm2/s). The ADC value of HAE in the current study is not significantly different from their study.
DWI is useful adjunct to the routine MRI liver in cases of suspected HAE. Not only it will increase the diagnostic confidence but it will also yield potentially useful information regarding the activity/viability of HAE and can be used in lieu of FDG PET for this vital piece of information, as was demonstrated by Zheng et al. Short acquisition times and absence of radiation make DWI an attractive and easily available alternative to PET scan for this purpose. However, ADC values are prone to intra- and interobserver variations and thus must be performed multiple times in a meticulous manner and then median values should be recorded.
There are some limitations of our study. The retrospective nature and small sample size with insufficient Kodama type 1 (n = 1), type 3 (n = 2), and type 5 (n = 2) lesions are the two main limitations. It is desirable to have large sample studies in future to corroborate our results and to further study the role of DWI in alveolar echinococcosis diagnosis and also to help predict parasite viability.
Differential diagnosis of HAE includes cholangiocarcinoma and metastases (in the case of a solid mass), cystadenoma/cystadenocarcinoma in the case of a cystic mass. Leiomyosarcoma of IVC may be considered as a differential diagnosis when a solid mass centred around posterior hepatic segments is seen obliterating inferior vena caval lumen (Table 4).
Table 4
Imaging features of hepatic alveolar echinococcosis and common mimics
Given the aggressive appearance of alveolar hydatid many times PET-CT is performed in these patients. FDG uptake is seen in the peripheral zones of the parasitic lesions. However, no uptake is present in the central necrotic tissue. PET-CT using 18-fluorodeoxyglucose radiotracer is considered a reliable method for differentiation between active and quiescent HAE. It can be used as a follow-up modality in patients undergoing medical treatment [26,27]. Biopsy is the final arbitrator and helps make the correct diagnosis. Serological tests have a supplementary role, and any patient with a hepatic mass with positive serological tests may be deemed to have HAE and should be evaluated further along the lines of HAE [3].
Treatment includes drug therapy with benzimidazole and surgical resection of the lesion or affected lobe, or liver transplantation. Treatment of HAE is dictated by the degree of involvement of the liver together with biliary and vascular complications, neighbouring organ involvement, and the presence or absence of metastatic disease. Radiologists must follow PNM classification while reporting cases of HAE and convey complete information about the location of the lesion, its relations, and the presence of any biliary, portal, hepatic venous, or inferior vena caval invasion. Extrahepatic extension of the lesion must also be determined. In the event of suspicion of distant organ involvement, further appropriate imaging must be recommended.
In summary, radiologists residing in endemic zones must familiarise themselves with varied imaging appearances of this parasitic disease. HAE must be considered as a differential diagnosis in an appropriate clinical setting (like an echogenic hepatic mass in the absence of a known malignancy anywhere).
Conclusions
HAE by virtue of its infiltrative growth pattern with a tendency to involve biliary, vascular, and extra hepatic structures can be easily misdiagnosed as malignant hepatic neoplasm. Knowledge of varied imaging appearances of HAE is essential to suspect and then to make the appropriate diagnosis, especially in an endemic zone. Usually a combination of USG, CT, and MRI is needed to make a correct diagnosis and also to convey the disease burden (using PNM staging) to the clinician to help them plan an appropriate treatment. Diffusion-weighted imaging is a useful adjunct with relatively high diffusivity (high ADC values) suggesting diagnosis of alveolar hydatid.