


Introduction
Prostate cancer (PCa) is the most common noncutaneous malignancy among Western men and the leading cause of cancer mortality, preceded only by lung cancer in the United States, with an annual incidence of 161,360 cases resulting in 26,730 deaths in 2018 [1]. PCa is most often diagnosed on systematic transrectal ultrasound (TRUS)-guided prostate biopsy. TRUS-guided prostate biopsy is considered the gold standard for diagnosis of PCa, which should include 12 cores, thereby leading to a detection rate ranging between 24% and 44% according to the current European Association of Urology (EAU) guidelines.
It is crucial to diagnose tumour aggressiveness or, in other words, to correctly differentiate nonclinical significant prostate cancer (ncsPCa) from clinically significant prostate cancer (csPCa), to apply the appropriate treatment modalities and reduce overtreatment or ineffective treatment results [2,3]. CsPCa is defined as GS ≥ 3 + 4 = 7, tumour measuring ≥ 0.5 cm3, or showing features of extra-prostatic extension [4]. PCa is primarily based on prostate-specific antigen (PSA) screening and TRUS-guided prostate biopsy. However, prostatitis can also cause elevated PSA, and normal PSA does not exclude a tumour [5,6].
Multiparametric magnetic resonance imaging (MpMRI) has assumed a primary role in the diagnosis of PCa; it is non-invasive and the gold standard diagnostic imaging modality for PCa, which is a combination of standard anatomical T1- and T2-weighted imaging with functional imaging techniques (diffusion-weighted imaging [DWI] and dynamic contrast-enhanced MRI). DWI measures the Brownian motion of water molecules in vivo on unenhanced MRI sequences and provides information about tissue cellularity and membrane integrity. It has shown potential to increase the accuracy of tumour detection, localization, and characterization of prostate cancer [7-10]. We can measure the water molecules’ mobility (Brownian motion) in vivo on unenhanced MRI sequences and also provide apparent diffusion coefficient (ADC) map-derived DWI sequences, which are used to inversely correlate with cellularity in different tumour types, provides quantitative information about tumour aggressiveness, and has shown an overall high correlation with Gleason score (GS) [11,12]. However, in some reported studies, the ranges of ADC values have again demonstrated significant overlaps within the same GS groups [13,14].
To avoid these inconsistencies and standardize the quantitative metrics, the ADC selective (sel-ADC), ADC exponential (exp-ADC), and ADC ratio (ADCr) (the quantitative parameter ratio between the tumour and nontumoural prostatic tissue) were also evaluated in this study. Several earlier studies demonstrated that the ADCr had better correlation with GS than the mean ADC value [15,16] as well as a favourable impact on diagnostic performance [17].
This study aims to investigate the relationship between ADC parameters and Gleason score with the aid of histopathological findings by TRUS-guided prostate biopsy in patients with prostate cancer.
Material and methods
Study population
This retrospective study was approved by the responsible ethics committee. We performed a search using our institutional Picture Archiving and Data Reporting System (PACS; Centricity, General Electric CA, U.S.) to identify all patients who underwent multiparametric prostate MRI and TRUS-guided biopsy of the prostate between July 2016 and March 2019. Forty-four consecutive patients were retrospectively included in the study with the following including criteria: a) 3-Tesla MR platform with an 18-channel phased array surface coil and a spine coil underneath the pelvis; b) at least 1 suspicious lesion with a large axial diameter of 5 mm in the peripheral zone and a PIRADS-v2 score > 3 – each identified lesion is scored according to the PIRADS v2 classification system from ESUR; c) each patient was diagnosed as prostatic adenocarcinoma histopathologically with TRUS biopsy using a Loqic E9 (General Electric Healthcare) PSA – PSA density levels and prostate volumes were recorded – TRUS-guided prostate biopsy was performed involving 14 cores after the magnetic resonance imaging (MRI) examinations.
Magnetic resonance imaging protocols and imaging analysis
Magnetic resonance imaging acquisition
All patients underwent a multiparametric prostate MRI including tri-planar T2-weighted (T2W), dynamic contrast-enhanced (DCE), diffusion-weighted imaging sequences using a 3.0-Tesla MR scanner (Skyra, Siemens Medical Systems, Germany) with a dedicated 18-channel body coil and a spine coil underneath the pelvis, with the patient in the supine position. Routinely, just before the beginning of the examination, 20 mg butylscopolamine bromide (Buscopan, Boehringer Ingelheim, Germany) was injected (i.m.) to reduce bowel movements. 135 ml sodium di-hydrogen phosphate + di-sodium hydrogen phosphate (B.T. enema) was administrated to the patient to reduce motion artifacts due to bowel peristalsis. We imaged the entire prostate and oriented axial images to be perpendicular to the rectal wall guided by sagittal images.
Prostate MRI was done using the following protocol – axial T2-weighted (T2W) sequence (TR/TE 3200/96 ms; slice thickness 3.5 mm with 0.5 mm interslice gap; field of view [FOV] 200 × 200 mm; matrix size 448 × 336; average 2) sagittal T2W volumetric space sequence (TR/TE 1500/139 ms; slice thickness 0.9 mm without any interslice gap; FOV 220 × 220 mm; matrix size 256 × 205; average 1.4); a coronal T2W sequence (TR/TE 4870/117 ms; slice thickness 3 mm with 0.6 mm interslice gap; FOV 240 × 240; matrix size 314 × 448; average 1) echo planar imaging (EPI)-based DWI sequence in axial planes at b values of 50, 400, 1000, 1400 s/mm2 (TR/TE 4100/61 ms; slice thickness 3.5 mm; FOV 200 × 200, and matrix size 114 × 114); an axial multiphase 3-dimensional (3D) T1W dynamic gradient-echo sequence obtained after 10 ml intravenous bolus injection of 0.1 mmol gadobutrol (Gadovist; Bayer Laboratories, Berlin, Germany) per kilogram of body weight followed by a 20 ml saline flush at a rate of 2.0 ml/s. Approximately 32 series were obtained, which lasted for a total of 8 minutes with flip angle 15°; slice thickness 3.5 mm with 0.6 mm interslice gap; FOV 220 × 220; matrix 80 × 192, average 1 mm.
Pelvic postcontrast T1 axial fat-saturated Turbo Spin Echo (TSE; TR/TE 515/20; slice thickness 5 mm with 1 mm interslice gap, FOV 350 × 350, matrix 320 × 240; average 1 mm and axial Short Tau Inversion Recovery (STIR); TR/TE 4550/91; slice thickness 5 mm with 1 mm interslice gap, FOV 350 × 350, matrix 384 × 269; average 1 mm) sequences were obtained.
The ADC maps were constructed from DWI images by using the mono-exponential model. Calculated and acquired high b-value DWI images were compared for lesion visibility and image quality by a radiologist with 5 years’ experience in prostate with knowledge of the pathology data. Signal intensities on the high b-value (1400 s/mm2) images of the peripheral zone, and the defined lesions were visualized. The exponential exp-ADC, sel-ADC, and ADCr of defined lesions were evaluated using region of interest-based measurements. The exp-ADC value calculated for the suspected lesion by drawing a region of interest (ROI) around the suspicious lesion using a ROI covering the whole of the lesion. Sel-ADC was measured, using a region of interest (ROI) of 5-10 mm2 at the area of lowest ADC value within the lesion. ADCr was calculated as ADC tumour/ADC mirror normal-appearing prostate parenchyma. Exp-ADC, sel-ADC, and ADCr were correlated with the Gleason score obtained via transrectal ultrasound-guided biopsy. The cases were classified into 2 groups, according to their Gleason score, as group I with Gleason score 6, and Gleason score 7-10 stratified as Group II.
Each biopsy was performed in a left lateral decubitus position. We used endocavitary 4 to 10 MHz broadband curved array endfire transducer with Logiq E9 (General Electric Healthcare) and an 18-20 gauge cutting core biopsy needle. Patients first underwent systematic 14-core biopsies (6 from each lobe and 1 more from each transitional zone), followed by targeted biopsies generally consisting of 2 or 3 cores from each target.
Histopathology analysis
A genitourinary pathologist with 20 years’ experience reviewed and described all biopsy cores. The specimens were stained with haematoxylin-eosin under a light microscope (Olympus BX51, Olympus Corporation, Tokyo 163-0914, Japan). The tumours from all patients were classified into Gleason score.
The biopsy data included the number of positive biopsy cores, Gleason score, and the maximal percentage of involvement for each positive biopsy core.
Statistical analysis
All statistical analyses were carried out using Windows for SPSS v. 22 (IBM Corporation, New York, USA). The mean sel-ADC and exp-ADC and ADCr values were compared between 2 groups. PSA and PSA density were assessed if there was a statistically significant difference between 2 groups. PSA and PSA density were assessed if there was a statistically significant difference between 2 groups.
Continuous variables were assessed using the Shapiro-Wilks test for normality of data and presented as mean ± SD or median (range). The Mann-Whitney U test or Student’s t-test were performed to compare non-parametric and parametric variables. Also, receiver operating characteristic (ROC) curve analysis and areas under the curve (AUCs) were performed for each statistically significant parameter to establish an optimal cut-off value and to assess the discrimination ability of each parameter for non-significant Pca versus clinically significant PCa. The best cut-off point was determined by using the Youden S index. Also, parameters were compared between the study and control groups with independent samples t-test.
Spearman’s rank correlation analysis was used to show the correlations of aggressiveness of prostate Ca with sel-ADC, exp-ADC, and ADCr values. P < 0.05 was considered statistically significant.
Results
A total of 69 patients were enrolled in this study. Forty- four patients with Pca formed the study group, and 25 patients were observed to have no Pca with mpMRI. The median patient age in the study group was 61.02 ± 6.08 years (range, 50 to 84 years). The mean PSA was 6.34 ± 2.56 ng/ml, and the median PSA Density was 0.16 ± 0.09. With respect to histopathological analysis, we identified 17 patients with a GS of 6; 20 patients with a GS of 7; 2 patients with a GS of 8; 4 patients with a GS of 9; and 1 patient with a GS of 10. Eleven patients had multifocal Pca in the study group. The GS of multifocal Pca group was 7 in 6 patients, and all of the patients with GS 8, 9, and 10 had multifocal Pca.
There was a nonsignificant correlation between PSA level and Gleason score (p = 0.6), but there was a significant difference between the 2 groups in terms of PSA density (p = 0.015). The ADCr was not significant between 2 groups, while sel-ADC and exp-ADC were statistically significant (p = 0.09, 0.014, 0.012, respectively) (Table 1).
Table 1
Relationship between parameters and Gleason scores
The mean exp-ADC and sel-ADC values were significantly lower in high-grade Pca than in low-grade Pca (p = 0.012 and 0.014, respectively). However, the mean ADCr value difference between nsPca and sPca was not significant (p = 0.09).
ROC analysis was performed to obtain an optimal cut-off value for the sel-ADC and exp-ADC value to differentiate 2 groups (area under the curve = 0.719 and 0.726, respectively) (Figure 1). A sel-ADC value ≤ 684 mm2/s has a sensitivity, specificity, positive predictive value, negative predictive value, of 79.31, 62.50, 79.3, and 62.5 respectively, to differentiate nsPca from sPca. An exp-ADC value ≤ 731 mm2/s has a sensitivity, specificity, positive predictive value, and negative predictive value of 55.17, 87.50, 69, and 56.3, respectively, to differentiate nsPca from sPca.
Figure 1
Area under the curve (AUC) of exp-ADC was 0.726, AUCs of sel-ADC were 0.719, and ADCr was 0.702
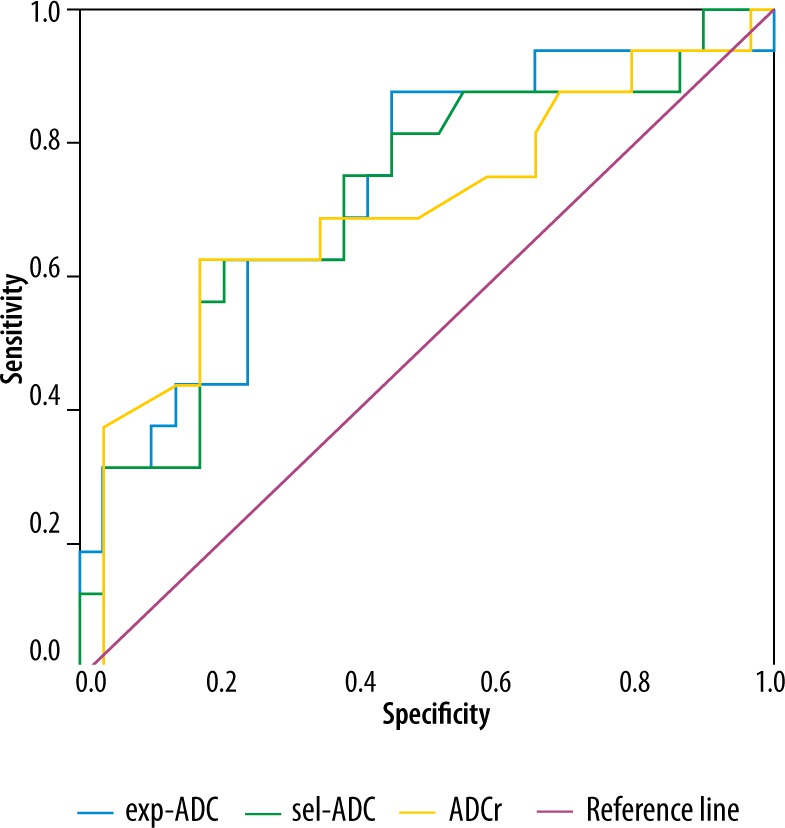
The AUC of exp-ADC was 0.726, AUCs of sel-ADC were 0.719 and ADCr was 0.702, respectively (Figure 1). The exp-ADC values were thus strongly associated with higher tumour aggressiveness in this study.
The sel-ADC value was 0.718 ± 0.161 × 10⁻³ mm2/s for Group I; 0.596 ± 0.148 × 10⁻³ mm2/s for Group II; the exp-ADC was 0.862 ± 0.188 × 10⁻³ mm2/s for Group I; and 0.723 ± 0.157 × 10⁻³ mm2/s for Group II, the ADCr was 0.64 ± 0.2 for Group I and 0.54 ± 0.15 for Group II. Representative cases with a GS of 3 + 4 and 4 + 4 prostate cancers in the right and left peripheral zones are shown in Figures 2-4 and Figures 5-8, respectively. The differences between the ADC values obtained for 2 groups were analysed in pairs, and there were significant differences between GS 6 groups with the exception of GS ≥ 3 + 4. Furthermore, the sel-ADC, exp-ADC, and ADCr values of tumours with GS ≥ 3 + 4 were significantly lower than that of tumours with GS = 6 (p < 0.001) (Table 1).
Figure 2
A 67-year-old patient with Gleason Score 3 + 4 prostate adenocarcinoma in the left peripheral zone, exp-ADC value is measured
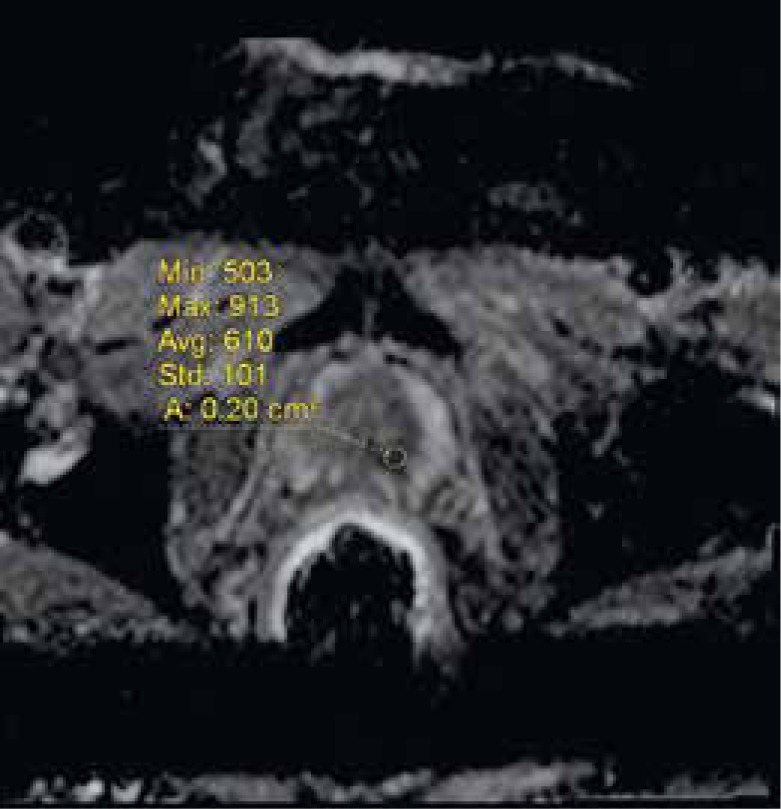
Figure 3
A 67-year-old patient with Gleason Score 3 + 4 prostate adenocarcinoma in the left peripheral zone, sel-ADC value is measured
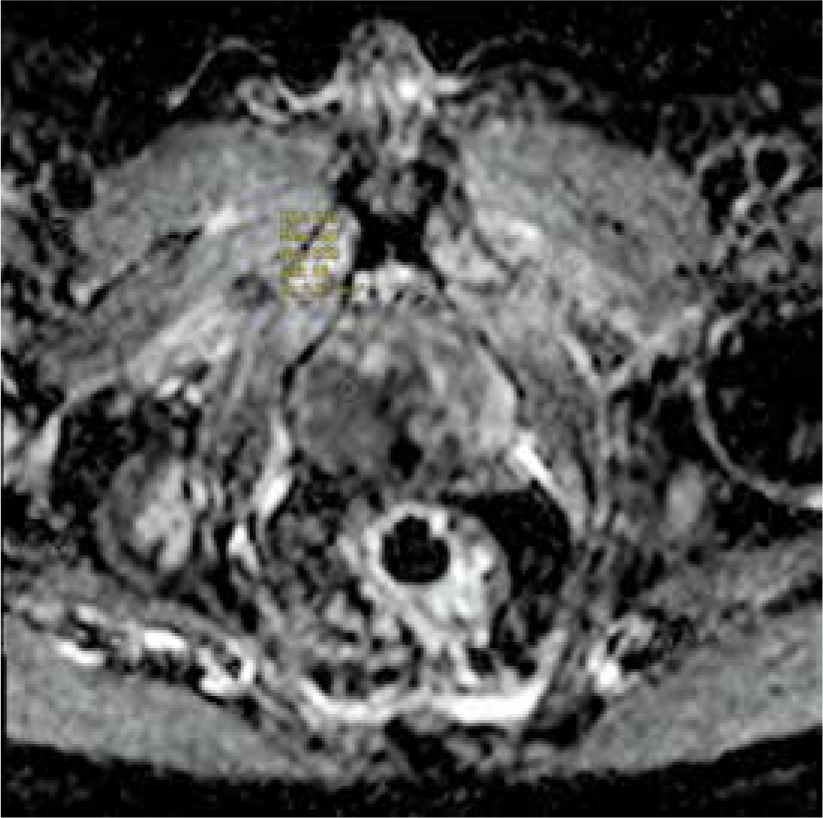
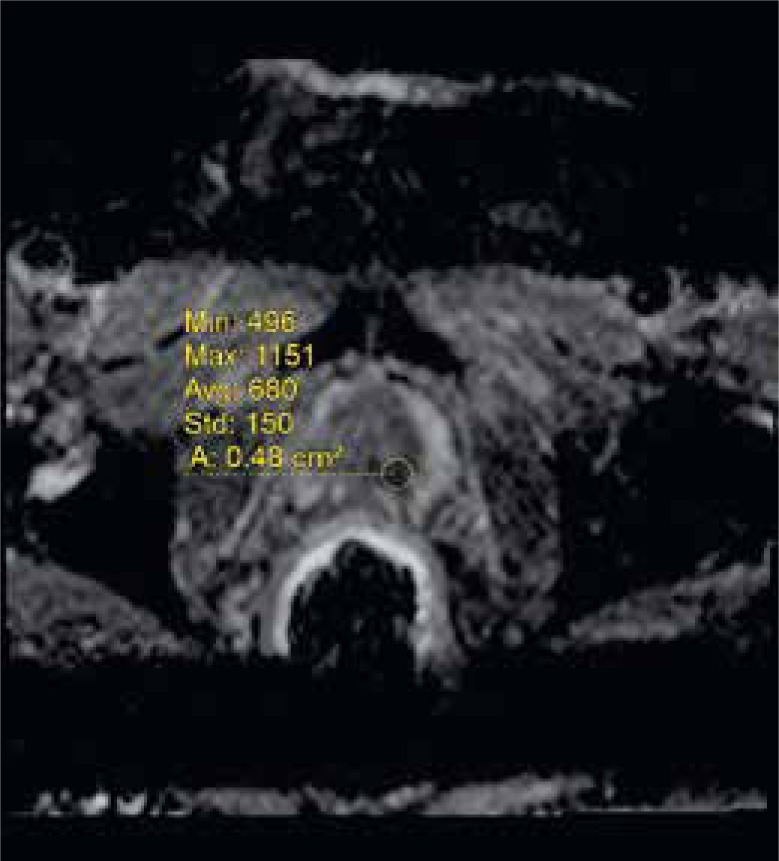
Figure 5
A 62-year-old patient with Gleason score 4 + 4 in the right peripheral zone on diffusion-weighted imaging, sel-ADC value is measured
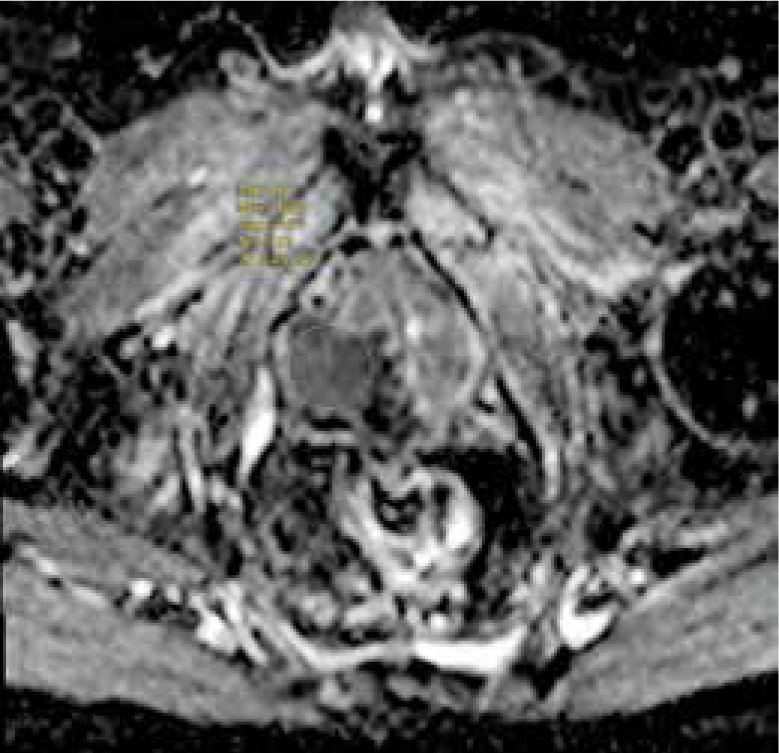
Figure 6
Exp-ADC value of a patient with right peripheral Gleason score 4 + 4 prostate adenocarcinoma
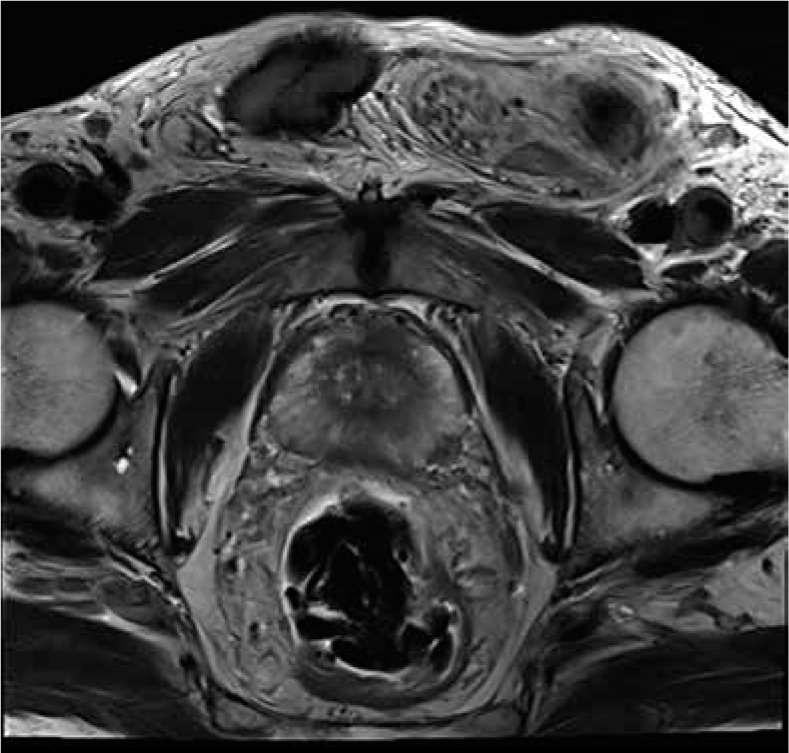
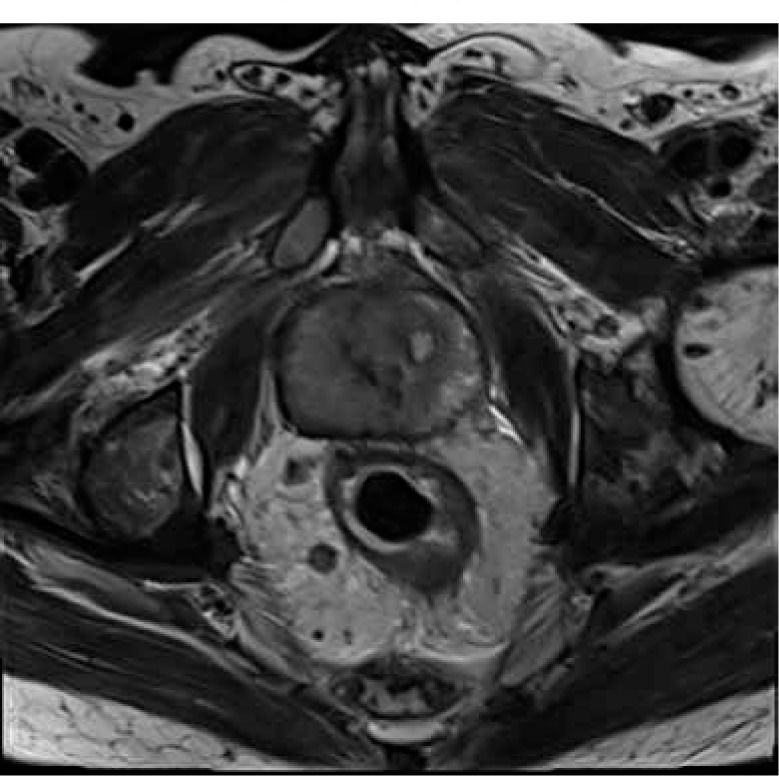
Figure 7
T2-weighted image of a patient with right peripheral Gleason score 4 + 4 prostate adenocarcinoma

The relation between age, PSA, PSA density, exp-ADC, sel-ADC, prostate MR volume, and prostate adenocarcinoma is shown in Table 2. ADCr could not be studied in the control group because there was no tumoural prostatic tissue in the control group.
Table 2
Relation between parameters and prostate adenocarcinoma
The age, PSA, PSA density, and prostate MR volume were at statistically significantly higher levels in patients with Pca than in the patients without pCa (p < 0.01). Exp-ADC and sel-ADC values were at statistically significantly lower levels in patients with Pca than in the cases without Pca (p < 0.01).
Discussion
MRI can delineate the structure of prostate and anatomical details of the prostatic tissue. DWI, a major component of mpMRI, has been the main sequence for detecting and staging prostate cancer in PZ, and it additionally provides information about tumour cellularity. In particular, DWI and ADC values are regarded as reliable non-invasive tools for assessing tumour aggressiveness in prostate cancer [18]. MRI can be a guide for prostate biopsies or demonstrates the anatomic location of the tumour and is a follow-up method for active surveillance of patients. Many studies have been performed on the discrimination between normal and malignant prostate tissue using the DWI technique. Because absolute ADC values depend on the selected b-value, the most accurate method of measuring the ADC value is still being discussed. Cellularity, tumour type, or nuclear grade can affect the ADC values of tumoural tissue.
Therefore, different options are under investigation beyond ADC tumour mean value, such as the sel-ADC value, exp-ADC, and ADCr (expressed as the ratio between tumour and non-tumour ADC values) in prostate cancer aggressiveness.
Hambrock et al. [19] showed that a significant inverse correlation between ADC values and Gleason score was well-illustrated. Some studies have reported that ADC values have demonstrated significant overlaps within the same GS groups [10,11]. MRI acquisition parameters, selected b values, patient properties, and prostate gland structure cause differences in the obtained ADC values. To eliminate the effect of these parameters, this study assessed the role of sel-ADC, exp-ADC, and the ADCr in distinguishing Gleason score 6 and Gleason Score ≥ 3 + 4. Our study demonstrated that exp-ADC values had highest specificity with 87.5% inversely correlated with GS in prostate cancer, and that it was feasible to discriminate between pathologic GS 6 diseases according to ADC values.
In our study there were significant differences in sel-ADC and exp-ADC when comparing 2 groups.
Wu et al. [20] showed that higher ADC values (0.830 × 10⁻³ mm2/s) were significantly associated with low-risk prostate cancer (GS 6 disease).
In our study, the cut-off values for sel-ADC and exp-ADC were 0.684 × 10⁻³ mm2/s and 0.731 × 10⁻³ mm2/s, respectively, for differentiating low-risk prostate cancer from high-risk prostate cancer.
The decrease in ADC in high GS disease can be explained by the high tumour cellularity representing tumour aggressiveness.
Many authors affirm that the ADC ratio seems to be a more useful and reproducible method because it is independent of the diffusion parameters as selected b values and vector strength [21-24]. Nevertheless, a number of factors still limit ADCr’s efficacy. In our opinion, prostate tissue without tumour involvement used to measure ADCr appears norma, but it contains benign conditions like prostatitis, hyperplasia, or fibrosis.
When all these factors are taken into consideration, in our opinion sel-ADC and exp-ADC measurements are safe methods for prostate cancer aggressiveness assessment.
One limitation of this study might be the limited number of patients. Secondly, we compared our MRI parameters with GS. Sometimes GS on a biopsy does not reflect the cancer’s true grade. Additionally, recent modifications have improved the Gleason grading system, but it is still much more complex and can be confusing for patients and clinicians. For example, Gleason score 7 includes both Gleason score 3 + 4 and 4 + 3. Many recent studies have shown that Gleason score 4 + 3 = 7 demonstrates worse pathological stage than 3 + 4 = 7, although many clinicians consider Gleason score 7 on biopsy to be intermediate risk [25-27].
Conclusions
Sel-ADC and exp-ADC are more useful diffusion parameters than ADCr for proving prostate cancer aggressiveness. Exp-ADC and sel-ADC measurements in diffusion imaging improved specificity, accuracy, and AUC for detecting clinically relevant prostate carcinoma.
Our study results show that they are promising parameters to identify clinically significant prostate adenocarcinoma.