


Introduction
Crohn’s disease (CD) is one of the 2 main types of inflammatory bowel disease (IBD), along with ulcerative colitis (UC). The IBD group comprises chronic intestine disorders with not entirely confirmed aetiopathology, involving an autoimmune system impairment [1], a genetic predisposition [2], and an environmental component. The diagnosis of either CD or CU is established based on the clinical manifestation, laboratory tests, imaging techniques, endoscopy, and histopathology results [3]. Thus, patients presenting IBD-related symptoms are subjected to a number of invasive, not well-tolerated diagnostic procedures, such as colonoscopy with histopathologic sample collection. Moreover, a differential diagnosis between the IBD types can be challenging when the histopathological results are inconclusive [4,5]. In addition to this, IBD diagnosis, treatment, and follow-up, considering the chronic remitting-relapsing character and the prevalence in the young population, are related to an increased risk of ionizing radiation exposure [6,7]. Depending on the clinical situation, patients with IBD or suspected IBD undergo a variety of ionizing radiological procedures, including plain radiography and computed tomography (CT), as well as non-ionizing procedures, such as ultrasonography (US) and magnetic resonance imaging (MRI). Magnetic resonance enterography (MRE) is especially useful in patients with CD because it shows small bowel involvement and transmural inflammation, the 2 main characteristics reserved for this IBD type, which are difficult to evaluate in other radiological and endoscopic exams. The technique of MRE consists of a special imaging protocol with intravenous contrast administration and oral contrast for bowel distension, as opposed to magnetic resonance enteroclysis, which involves a contrast agent administered via nasojejunal tube [8].
The aim of this study is to detect – based on data collected from patients with CD, UC, as well as IBD suspicion and other diseases – the most characteristic MRE findings for CD, and evaluate the diagnostic potency of magnetic resonance enterography in patients with clinical image of IBD and no histopathological confirmation. The results would help to distinguish, using MRE, among patients with suspected IBD, a group with a higher risk of final CD diagnosis. MRE could be a diagnostic tool to indicate which patient should undergo further studies and be subjected to more invasive diagnostic procedures – colonoscopy or double balloon enteroscopy.
Material and methods
Patients’ characteristics
A total of 131 MREs were performed in 70 female and 61 male patients (67 adults and 64 children), with mean age 25 years, between 2012 and 2018. Among patients submitted to MRE: 60 were previously diagnosed with CD and 17 with ulcerative colitis. The diagnosis was established based on histopathologic samples, obtained during a colonoscopy. Twenty-six patients included in the study were classified as suspected IBD because they were presenting clinical symptoms as well as, in most of the cases, endoscopic findings consistent with IBD, without a definitive histopathological diagnosis. The next, heterogeneous group of 18 cases, listed as other diseases, consisted of the following: other gastrointestinal disorders (familial adenomatous polyposis, diverticulosis, Yersinia enterocolitica infection, and small intestinal bacterial overgrowth syndrome) as well as non-gastroenterological diseases (endometriosis, female infertility unspecified, anorexia nervosa). Finally, the last group of 10 patients, defined as unknown pathologies, presented non-specific symptoms (diarrhoea, abdominal pain, cramping, fatigue, presence of blood in stools, weight loss) and had not been subjected to colonoscopy before MRE.
Magnetic resonance enterography details
Only exams with a complete, institutionally approved MRE protocol, defined in Tables 1 and 2, were included in the study. A cleansing preparation of the small bowel consisted of a low-residue diet starting 3 days prior to the examination. To avoid artefacts, due to bowel peristalsis, buscolysine (20 mg/ml) in 1-ml bolus, was administered twice during MRE: the first infusion immediately before the survey scan and the second one directly before diffusion-weighted imaging (DWI), the most sensitive to motion artefacts. Sorbitol and Ispaghula husk solutions were used interchangeably as oral contrast agents. Patients were fasted 6 hours prior to drinking 1.5 l of oral contrast solution over a period of 45 minutes up to 1 hour before the examination. In 9 patients, a Gastrografin or Gadolinium-based MRI contrast agent solution was administered rectally for a better visualisation of distal intestine loops. Two patients, with a history of previous bowel surgeries, had an additional dose of Gastrografin solution injected into the distal loop of ileostomy. MRE was performed in the prone position with feet first on a 1.5-T MR system (Ingenia Omega HP, Philips Healthcare Nederland) equipped with a dedicated multi-channel body array coil (dStream Torso, 32 channels, Philips Healthcare Nederland). Tables 1 and 2 contain a detailed description of the MRE protocol. A Gadolinium-based agent (Gadovist, Prohansen, or Dotarem) at a dose of 0.1 mmol/kg was administered intravenously. A contrast sequence was preceded by a DWI scan with double b-values: 100 and 800 s/mm2. All sequences were covering the abdomen and pelvis, from the lung bases to the pubic symphysis. All MR scans used breath hold, except for the balanced turbo field echo (BTFE), where a triggering breath hold function was used. Thus, all sequences used a parallel imaging (sensitivity encoding – SENSE) factor for scan time reduction.
Table 1
Magnetic resonance enterography protocol parameters of 1.5-Tesla magnetic field I-VI
Table 2
Magnetic resonance enterography protocol parameters of 1.5-Tesla magnetic field VII-XIII
Statistical analysis
Radiological reports of 131 MREs, assembled in the following groups: 17 with diagnosed UC, 60 with CD, 26 with IBD suspicion, named as IBD unsure, 18 with other diseases, and 10 with unknown pathologies, were retrospectively inspected considering typical CD enterography features. 126 of all the 131 MREs were evaluated by the same radiologist with 20 years’ experience, specialized in MRI assessment of digestive tract diseases. Only 5 exams were interpreted by different diagnostic imaging specialists, but they were supervised by the mentioned-above radiologist as a consultant. All the radiologists used the same notions to describe MRE findings, as shown in Table 3. Additionally, MRE reports were analysed regarding the extent of the disease, as the following parts of intestine affected by inflammatory process, were identified: jejunum, ileum, cecum, ascending colon, transverse colon, descending colon, sigmoid colon, rectum, anal canal, as well as appendix and ileocecal valve. The specialists were not blinded to the previous CD or UC diagnosis. The statistical analysis was performed using Statistica 13.3 (StatSoft, Cracow, Poland).
Table 3
Inflammatory bowel disease features in magnetic resonance enterography (MRE)
| Radiological feature in MRE | Description and criteria |
|---|---|
| Mural thickening | Bowel wall greater than 3 mm [9] |
| Mural enhancement | Increased signal intensity in a bowel wall after a contrast application (in post-gadolinium T2 images) when compared to |
| the adjacent bowel loops [10,11] | |
| Intraperitoneal free fluid | Presence of free fluid in the peritoneal cavity, including a subtle pelvic fluid collection in the pouch of Douglas |
| Fibro-fatty proliferation | Pseudo-mass adjacent to the bowel loop involved in inflammatory process, with signal characteristics consistent with |
| fibrous or/and fatty tissue [9] | |
| Increased vascularity | Prominent pericolic or perienteric vasculature |
| Comb sign | Engorgement: dilated, tortuous, and elongated appearance of vasa recta [9,12] |
| Hyperaemia | Increased blood flow in intestinal wall and adjacent tissues demonstrated as hyperenhancement |
| Stricture | Narrowing of the bowel lumen when compared to adjacent segments |
| Obstruction | Complete luminal obstruction of the bowel |
| Mesenteric adenopathy | Presence of mesenteric lymph nodes exceeding 5 mm in transverse diameter [13] |
| Abscess | Well-defined fluid collection with an air-fluid level (Figure 1) |
| Fluid collection | Fluid collection with a thin, smooth capsule, without a rim enhancement or an air-fluid level |
| Fistula | Fluid containing enhancing tracts communicating with adjacent structures or a star-sign presentation (Figure 2) |
| Inflammatory | Coexistence of at least 3 of the listed features: mural enhancement, mural thickening, intraperitoneal free fluid, increased |
| infiltration | vascularity, comb sign, hyperaemia, fluid collection, abnormal diffusion restriction |
| Colonic haustral loss | Disappearance of colonic haustral folds |
| Bauhin valve | Thickened lips – valve lips exceeding 5 mm [14] |
| abnormalities | Dilatation and valve’s insufficiency – defective valve’s opening, resulting in widened valve’s lumen Fibrosis – stricture with the signal characteristics consistent with fibrous tissue and no enhancement Valve resection |
| Stricture – narrowed valve lumen | |
| Inflammatory infiltrate – enhanced and thickened valve lips with adjacent mesenteric enhancement and hyperaemia Atypical shape – loss of normal ileocecal valve morphology | |
| Abnormal diffusion | Hyperintensity on DWI images corresponding with low ADC (apparent diffusion coefficient) values – comparing to adjacent |
| restriction | loops [15,16] |
A Kohonen neural network was applied to organize all the features described in MRE reports (Table 3). Kohonen maps are based on natural neural networks, which enable grouping data from different sources. The network, provided with input data, representing raw, unprocessed information (in this case MRE features), recognizes relationships occurring in clusters and categorizes them in a self-learning process. The benefit of the data sample is enhanced if the compounds are diverse, because the network is able to group and distinguish inputs more efficiently. Thus, the data collected from all the groups of patients: diagnosed with CD and UC, with suspected IBD, as well as the patients with other diseases and unknown pathologies, were included in input data. Due to the ability to self-organize and adapt to formerly unknown information [17], as a result of processing all the input data, the Kohonen map enabled to determine 1 × 3 = 3 classes of data (3 neurons), representing 3 groups of patients, categorized based on MRE features. A c2 test and a Fisher’s exact test were used to compare the distribution of predictions between neurons. Based on the conducted tests, one neuron (Neuron 3) was selected as the one that most closely corresponded with the sample input, incorporating the most patients with CD diagnosis. Univariate analysis was used to examine the relationship between the Neuron 3 and radiological features of CD, defined in Table 3. Furthermore, the association between the neuronal model and abnormal diffusion restriction was analysed, as well as the presence of MRE features in each of the defined and described above digestive tract locations. Parameters proven to be significant on the univariate analysis, with p-values inferior to 0.10, were afterwards tested on multivariate model. The high threshold p-level was established to reduce the risk of failing to acknowledge a relationship in the data and to reject the variables with a weak association when assessed alone, which could demonstrate significance, when combined with other variables. The actual p-values for all the selected variables were inferior to 0.05.
For the multivariate model, a forward selection procedure, considering the parameter of area under curve (AUC), was used to obtain significant independent factors of CD diagnosis. In all other analyses, p < 0.05 was considered as significant.
Results
Among 38 cases incorporated in the Neuron 3, 23 were represented by patients with CD, 9 cases by unsure IBD, 2 by patients with UC, a single person with unknown pathology, and 3 cases of other diseases. Univariate analysis of MRE features associated with Neuron 3, considering the parameters of the odds ratio (OR) and p-values, included the following: bowel wall thickening (OR = 15.19, p < 0.001), presented in Figure 3, bowel wall enhancement (OR = 12.00, p < 0.001), comb sign (OR = 7.00, p = 0.020), stricture (OR = 10.12, p < 0.001), enlarged mesenteric nodes (OR = 6.09, p < 0.001), inflammatory infiltration (OR = 29.74, p = 0.002), and Bauhin’s valve thickened lips (OR = 0.18, p = 0.010). Other factors, subjected to analysis with 95% confidential index (CI), were: free fluid, fibrofatty proliferation, increased vascularity, hyperaemia, abscess, fluid collection, fistula, and colonic haustral loss. For these characteristics, the type 1 error was greater than 5%. A multivariate analysis selected using the forward selection procedure (AUC = 0.919, p = 0.031) identified bowel wall thickening, intestinal stricture, and lymphadenopathy as the 3 MRE features the most associated with Neuron 3.
Figure 1
Magnetic resonance enterography mDIXON coronal scan of a Crohn’s disease patient, showing an inflammatory infiltrate of sigmoid wall, sigmoid mesocolon, and surrounding adipose tissue with an abscess
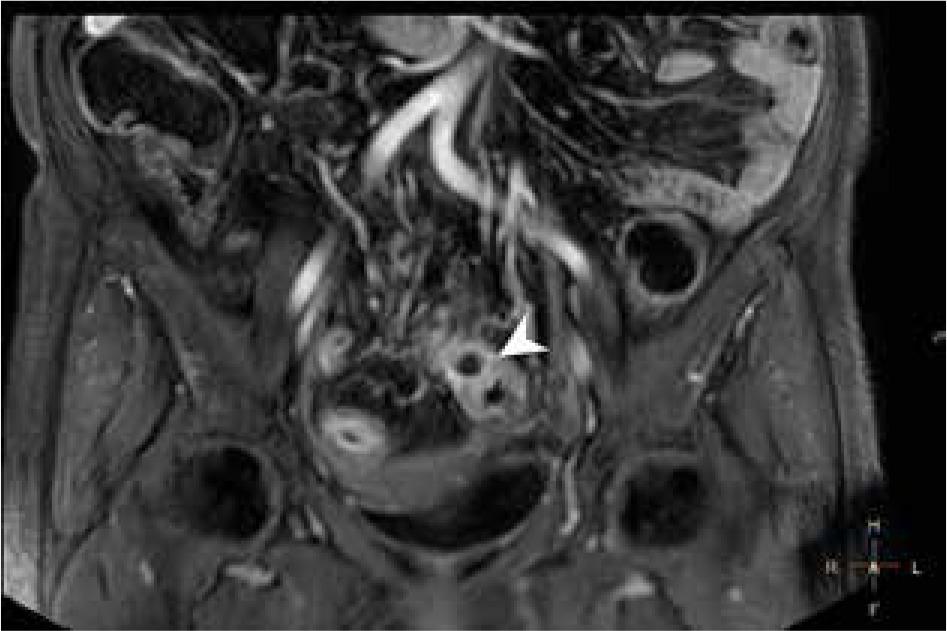
Figure 2
Magnetic resonance enterography mDIXON coronal scan of a Crohn’s disease patient presenting a fistula between adjacent intestinal loops manifested as a star-sign

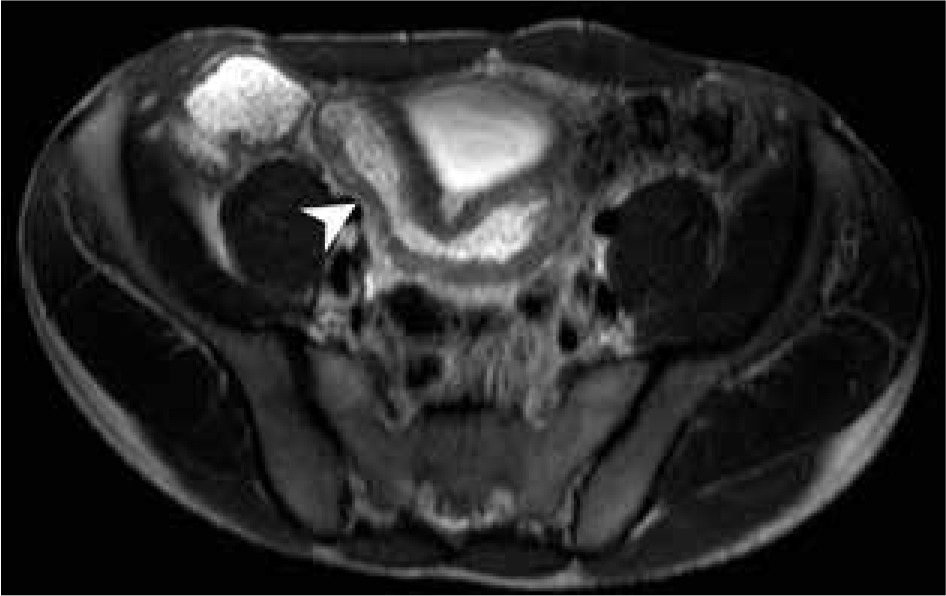
Figure 3
Magnetic resonance enterography axial scan in T2W of a patient with suspected inflammatory bowel diseases, demonstrating ileum wall thickening
The statistical analysis did not indicate any bowel part as associated with Neuron 3. Seemingly abnormal diffusion restriction was not proven to be related with Neuron 3: OR = 2.57 and p = 0.110 (CI = 95%).
Discussion
Principal outcomes of the study
Given the considerable number of patients with CD, incorporated in the Neuron 3 (23 cases), we came to the conclusion that the chosen neuron was the most CD-specific. Thus, bowel wall thickening, intestinal stricture, and lymphadenopathy, which most associated with the Neuron 3, were interpreted as the most significant predictive factors for CD diagnosis. Conversely, neither abnormal diffusion restriction, nor localisation of MRE changes in any part of the bowel, were proven to be predictive factors of Crohn’s disease.
Bowel wall thickening and intestinal stricture, detected by the statistical analysis as the most associated with CD diagnosis, are indisputably common findings in CD patients [18,19], due to the inflammatory cell infiltration, fibrosis, and the transmural character of the disease. Thus, our study results were along expected lines, but none of these findings is specific for active disease. The statistical analysis did not prove DWI restriction (Figure 4), considered as an active disease finding [16,20], to be a predictive factor for CD diagnosis. Multiple studies evaluated the use of MRE in the differentiation between active and inactive CD [8,13]. Athanasakos et al. suggested that chronic disease lesions are represented by thickened bowel wall with homogenous and slow enhancement on delayed post-contrast injection T1W images, together with a low intensity on T2W fat saturation images. Whereas, as proposed in their study, acute active CD demonstrates with an intense and early mucosal enhancement and a following transmural enhancement on post-gadolinium T1W scans. According to Albert et al. bowel wall enhancement should be considered as an active small bowel CD feature only if coexisting with a thickening of the bowel wall, otherwise it must be interpreted as non-specific [21]. In our study, mural enhancement was defined as an increased signal intensity in a bowel wall, in post-gadolinium T2 images, when compared to the adjacent bowel loops. The pattern and the evolution of the enhancement were not described in the radiological reports. What is more, the radiological findings, separately classified as follows: mural enhancement, increased vascularity, comb sign, and hyperaemia, are morphological presentations of the same CD characteristic. Thus, the analysis of MRE reports demonstrates a need for standardization of MRE description to avoid redundancy and to provide information concerning the pattern and evolution of the enhancement for a better distinction between active and fibrotic lesions. Another issue crucial for the CD diagnosis concerns the interpretation of intestinal stricture. In multiple studies [10,22,23] an upstream dilation coexisting with a luminal narrowing is obligatory for recognition of the stricture. The above-mentioned recommendations [23] pointed out a possibility of misinterpretation of a bowel spasm as a stricture. However, research by Lunder et al. defined intestinal stricture as a reduction of at least 80% in the bowel lumen compared with an adjacent loop [24]. Albert et al. described a significant intestinal stricture as a narrowing of the small bowel lumen to less than 12 mm [21]. In both of the above-cited studies, detection of an upstream dilation was not mandatory for stricture recognition. In our study, a proximal dilation was not included in the stricture definition; thus, the outcome of MRE evaluation was subject to the bias of false positive findings.
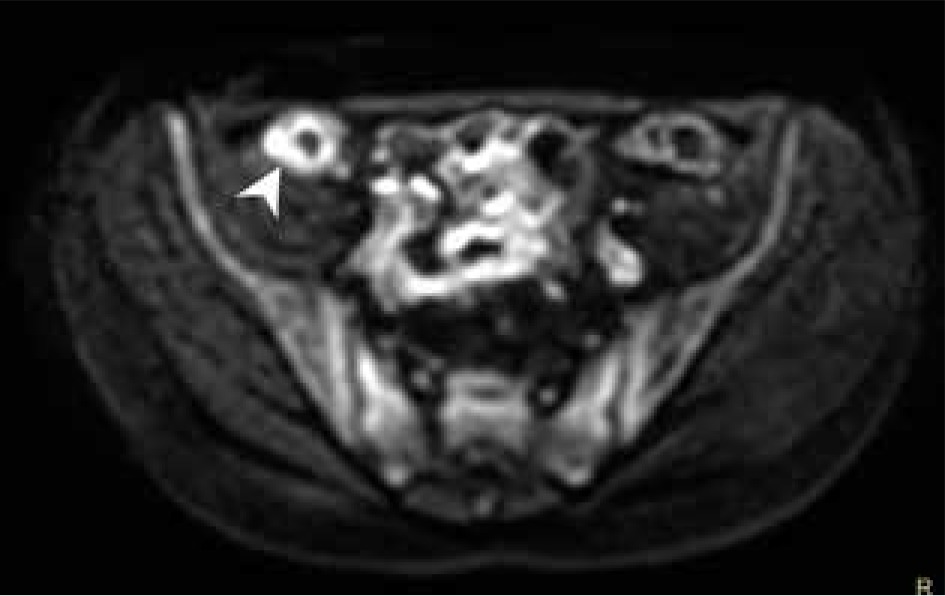
Figure 4
Magnetic resonance enterography axial scan, b-value 800, showing abnormal diffusion restriction in Crohn’s disease involved ileum
Additionally, the results of our study did not distinguish a localisation of inflammatory changes in any of the above-defined bowel parts, as associated with CD diagnosis. The ileocecal region (Figure 5), with the distal segment of the small bowel, is known to be the most frequent Crohn’s disease extent [22,25,26]. The lack of confirmation of terminal ileum changes as the predictive factor for CD may result from a large group of patients with other or non-defined pathologies (28 cases), a potentially great number of patients with no IBD, which would bias the results.
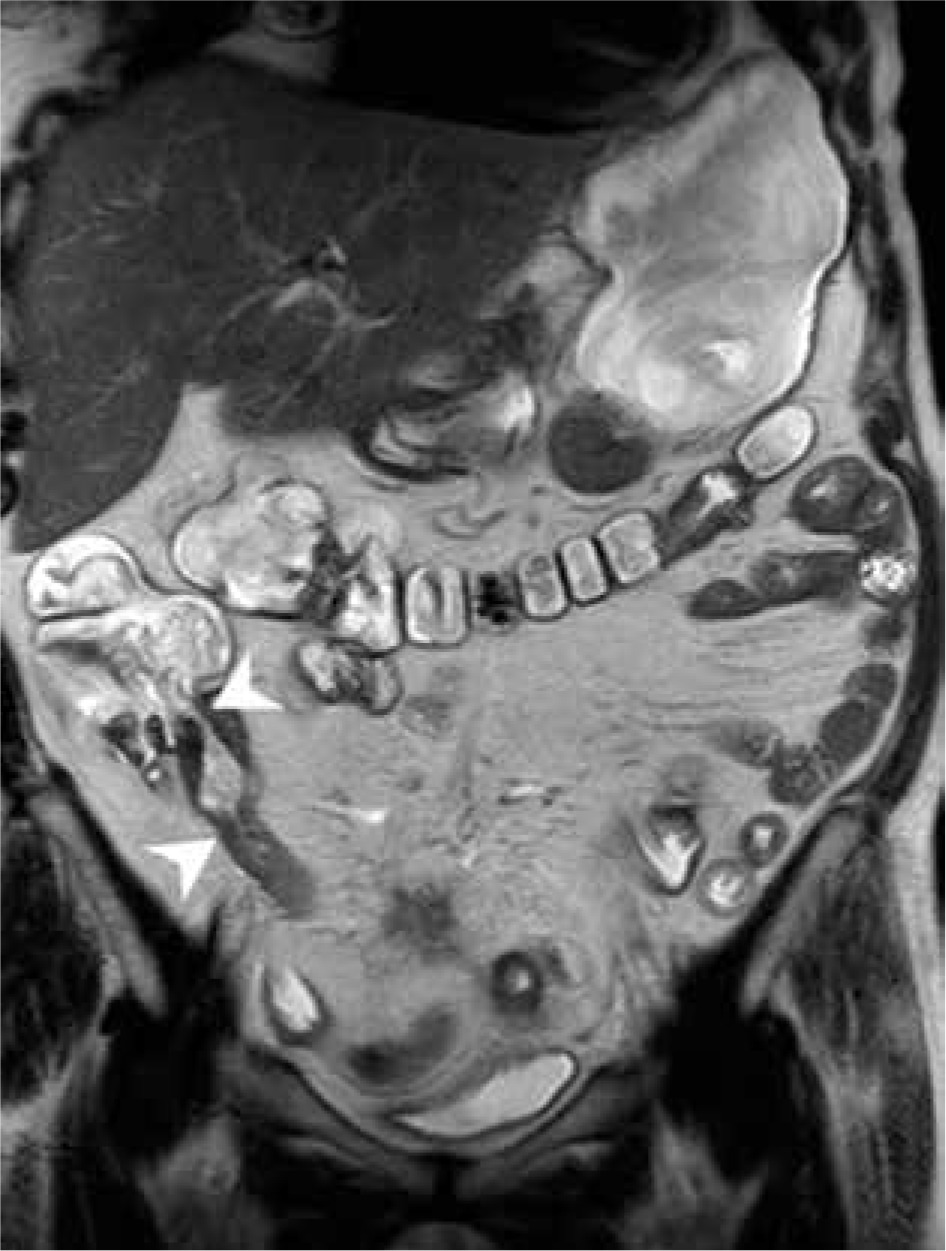
Figure 5
Magnetic resonance enterography scan in T2W TSE coronal BH sequence of a patient with Crohn’s disease, showing thickened lips and Bauhin valve stricture as well as thickened wall and stricture of terminal ileum
An interdisciplinary study conducted by Bruining et al. [23] led to the formulation of guidelines for CT and MRE in patients with small bowel CD. A proper establishment of cut-off values constitutes a difficulty related to bowel wall thickening assessment. The consensus [23] defined the abnormal thickness of bowel wall as 3 mm and more, which corresponds with our definition (bowel wall greater than 3 mm considered as thickened), as well as the one formulated in the study by Athanasakos et al. [13]. The estimation of the cut-off point is also challenging regarding dimensions of mesenteric nodes. In the reported recommendations, lymphadenopathy is defined as the presence of lymph nodes greater than 1.5 cm in the short axis. In our analysis, mesenteric lymph nodes were considered enlarged when exceeding 0.5 cm in the short axis, which is identical to the lymphadenopathy definition used by other researchers [13]. The divergence of measurement method may result in large differences in the interpretation of CD findings. Thus, a significant advantage of our study is that a great majority of MREs were evaluated, and all of them were verified by the same experienced radiologist. Moreover, the specialists were using the same nomenclature to describe the IBD-related MRE findings. Therefore, the conclusion can be drawn that the magnetic resonance characteristics of IBD found and named by the radiology specialist were unequivocal.
Research limitations
Some limitations of the study should be noted. Firstly, the radiologists, while creating the MRE reports, were not blinded to the histopathology results, confirming CD diagnosis. Hence, for the group of patients with diagnosed Crohn’s disease, there is a risk of bias because the specialists could be more inclined to find CD-related MRE features in these patients. However, the radiologists did use the same system of notions and criteria, regardless of the given diagnosis. Secondly, given the small group of patients, data used to create the neuronal model was reduced. A substantial number of patients were diagnosed with other diseases [18], which do not exclude a coexisting, undiagnosed IBD. Furthermore, the group of UC patients was limited. This is due to the fact that ulcerative colitis affects only the large bowel, which can be fully examined in colonoscopy. Thus, among the MRE indications, the cases of UC are significantly less often presented than Crohn’s disease. The self-organizing map, in order to develop meaningful clusters, requires correct and sufficient information. Incomplete or non-representative input data may result in an inaccurate outcome. Moreover, given the retrospective character, additional patients’ information, including detailed clinical presentation and laboratory test results if performed in other medical establishments, are not available. Consequently, the comparison of MRE results and the Mayo Clinic Score for UC or Crohn’s Disease Activity Index (CDAI) [22] was impossible. Another constraint concerns the lack of endoscopic and histopathological studies performed within a few weeks before or after MRE for a large number of patients. The time interval between colonoscopy with sample collection and MRE was often too long to consider the 2 modalities as performed in the same clinical situation. A comparative analysis of the 2 diagnostic techniques performed within the maximal interval of 4 weeks would be of a great value, as demonstrated by the researchers from Clermont Auvergne University [27]. According to the results of their study, a deep MRI remission defined using the Barcelona as well as Clermont criteria correlates with mucosal healing in endoscopy with specificity, respectively, of 85.3% and 88.2%, as well as negative predictive values of, respectively, 85.3% and 85.7%.
Conclusions
Magnetic resonance enterography constitutes a valuable diagnostic tool in patients with suspected IBD without a confirmed diagnosis. Bowel wall thickening, intestinal stricture, and lymphadenopathy are observed in patients more inclined toward CD diagnosis, who should undergo further, more invasive diagnostic procedures. Distinguishing between active and chronic disease remains a challenge. There is a need to search for the best MRE finding to differentiate between fibrostenotic and active lesions in Crohn’s disease. MRE confirms its utility in differential diagnosis between CD and UC, demonstrating small bowel involvement, transmural character, and extraintestinal complications of Crohn’s disease. The MRE evaluation should be improved and standardized to create a consistent and explicit reporting system for enterography findings in order to estimate disease severity and facilitate therapeutic decisions.