


Introduction
Hepatocellular carcinoma (HCC) is the most common primary hepatic malignancy and the second leading cause of cancer-related mortality in the world; thus, early diagnosis of HCC is vital for proper management [1-4]. Recently, contrast-enhanced computed tomography (CT) or magnetic resonance imaging (MRI) has become routinely performed for the diagnosis of HCC and has replaced biopsy preceding treatment for most of the patients [1,2]. Also, contrast-enhanced CT and/or MRI plays a critical role in the differentiation between HCC and other hepatic malignancies [5-7]. The Liver Imaging Reporting and Data System (LI-RADS) is a radiology-driven and multidisciplinary cooperative categorization system planned for standardizing liver imaging in patients at increased risk for HCC [8-12]. LI-RADS was originally released by the American College of Radiology (ACR) in 2011, and was then updated 4 times in 2013, 2014, 2017, and 2018. According to the previously released LI-RADS versions, established HCC imaging features include arterial phase hyperenhancement, washout appearance, and capsule appearance; also, the combination of both size and growth rate with these features is essential for the imaging algorithm [13-15]. The LI-RADS system meets the necessity to perform an exact diagnosis of HCC; actually, it is clinically important to distinguish between HCC and other hepatic malignancies because the management changes substantially. There are multiple ancillary features favouring malignancy, which could be used to upgrade the LI-RADS categories such as mild to moderate hyperintensity on T2-weighted imaging and restricted diffusion [14-18].
Diffusion-weighted imaging (DWI) is a functional technique used to assess tissue cellularity based on the restriction of water molecule motion. The analysis of DW images can be done qualitatively and quantitatively, through the apparent diffusion coefficient (ADC) map [16-18]. The role of DWI has been established in diagnosis, prognosis, and follow-up after treatment of malignancy of the brain, breast, chest, and head and neck regions. Several studies have discussed the role of DWI in the detection of hepatic malignancies and the differentiation of HCC from dysplastic nodules [19-22]. Multiple studies have discussed the role of incorporation of the ADC value into the Prostate Imaging Reporting and Data System (PI-RADS) [23-26]. Few studies have discussed the value of DWI and ADC in the characterization of hepatic focal lesions in correlation to LI-RADS [27-30]. The uniqueness of this study is the trial to directly compare the diagnostic accuracy and inter-observer agreement between ADC values of variable hepatic observations according to the recently released LI-RADS-v2018 and to assess prospective inclusion of ADC with LI-RADS-v2018 for the prediction of HCC.
The aim of the study was to assess the value of inclusion of the ADC value in LI-RADS-v2018 for better differentiation variable LI-RADS and prediction of HCC.
Material and methods
Patients
This study was approved by the institutional review board, and informed consent was waived because this is a retrospective study. The inclusion criteria were untreated patients at risk for HCC with hepatic focal lesion, including patients with cirrhosis (92 patients), patients with chronic hepatitis B infection (14 patients), and patients with prior HCC (2 patients). We excluded 5 patients from the study due to diffusion image quality degradation caused by respiratory motion artifacts. Finally, 137 hepatic focal lesions in 108 patients (75 male and 33 female, age range 40-66 years) were included in the study. All patients underwent contrast-enhanced dynamic MR examination and DWI of the liver in the period between February 2019 and March 2020.
Magnetic resonance imaging technique
All patients included in this study underwent MR imaging using a 1.5-T MR imaging scanner (Philips Ingenia). Patients fasted for 4-6 hours and were instructed to avoid deep breathing during the examination. Precontrast T1-weighted imaging and T2-weighted imaging were acquired. Multiphasic post-contrast T1-weighted GRE sequence after injection of contrast medium (gadolinium chelate) (Gd-DTPA) at a dose of 0.1 mmol/kg was done with the following acquisition parameters: TR/TE 3.3-4.5/1.4-1.9 ms, flip angle 10°, number of excitations (NEX) 2, matrix size 172 × 135, field of view 300-400 mm, and slice thickness of 3-5 mm. DWI was performed before contrast study using fat-suppressed single-shot echo-planar sequence with b values (b = 0, 100, 600, and 1000 s/mm2). Diffusion imaging acquisition parameters were as follows: TR/TE = 1900-70 ms, NEX = 3, matrix = 124 × 120, slice thickness = 5 mm, slice gap = 1-2 mm, and scan time = 70 sec.
Image analysis
Using a workstation (Phillips Advantage windows workstation) all MR images were interpreted by 2 independent radiologists (AA and AG) with 25 and 10 years of experience in liver imaging, respectively. Both reviewers independently reviewed the major imaging features on CE-MRI images, DWIs, and liver segments for each lesion, then the final diagnosis was arrived at for each observation according to LI-RADS-v2018 four major imaging features counting non-rim arterial phase hyperenhancement (APHE), non-peripheral washout appearance, capsule appearance, and focal lesion size. Finally, focal lesions were classified into 7 groups: LR-1 (definitively benign), LR-2 (probably benign), LR-3 (indeterminate), LR-4 (probably HCC), and LR-5 (definitively HCC), LR-M (probably or definitely malignant but not necessarily HCC), and LR-TIV (tumour in vein) [31]. We considered LI-RADS-v2018 major imaging features on dynamic MRI as the standard of reference for 106 (77%) typical hepatic observations (26 LR-1, 21 LR-2, 5 LR-3, 8 LR-4, 25 LR-5, 16 LR-M, and 5 LR-TIV). While the residual 31 (23%) atypical hepatic observations the following approaches were considered for proper diagnosis; for 3 cases LR-3, dynamic MRI with diffusion was repeated within 3-6 months, 6 cases of LR-4 underwent biopsy before locoregional treatment and liver transplantation, 7 cases of LR-5 also underwent biopsy before liver transplantation, for 11 cases of LR-M 3 of them underwent segmentectomy and 8 cases underwent biopsy, and finally 4 cases of LR-TIV underwent biopsy.
Restricted diffusion was considered as hyperintensity signal on DWI at high b values of 600 and 1000 mm2/s and iso- or hypointensity signal on the corresponding ADC map relative to neighbouring liver parenchyma. Both reviewers measured ADC values separately by manually applying the region of interest (ROI) encompassing the homogenous solid part of the hepatic focal lesion and did not include adjacent hepatic parenchyma. The ADC values were measured 3 times, and the measurements were averaged. In 13 patients with multiple observations, after exclusion of observations less than 10 mm (7 hepatic observations), each one was determined by its location in the liver (according to the hepatic segment) and was allocated an identifying number (e.g. Observation #1) to avoid overlap between the 2 observers. They were then analysed separately, the average ADC value was calculated for each observation, and finally the patient was classified according to the highest LI-RADS category.
Statistical analysis
The statistical analysis of data was done using the SPSS software (Statistical Package for the Social Sciences version 22). The mean and standard deviation of the ADC value was calculated. Two-tailed Student’s test was used for comparison of parametric data of ADC values. The κ values were interpreted as follows: κ values between 0.61 and 0.80 represented good; and κ values between 0.81 and 1.00 represented excellent. A p-value of less than 0.05 indicated a statistically significant difference. The receiver operating characteristic curves of the ADC of different categories of LI-RADS with a calculation of the area under the curve (AUC) was done. The weighted kappa test (κ) was done to estimate the level of agreement for ADC value by both reviewers. Pearson’s correlation test was done to correlate ADC values with LI-RADS-v2018.
Results
Table 1 shows the number of hepatic observations within each LI-RADS category. However, in this study we focused on evaluation of both DWI and ADC measurements in the assessment of different LI-RADs categories. Table 2 shows the mean and standard deviations of ADC of LI-RADS-v2018 subtypes. The mean ADC of both reviewers (b value 600 mm2/s) of LR-1 and LR-2 were 2.11 ± 0.47 and 2.08 ± 0.47 × 10⁻³ mm2/s, LR-3 (Figures 1-3) were 1.28 ± 0.12 and 1.36 ± 0.16 × 10⁻³ mm2/s, LR-4, LR-5 (Figures 4-6) and LR-TIV were 1.07 ± 0.08 and 1.08 ± 0.12 × 10⁻³ mm2/s and LR-M (Figures 7-9) were 1.02 ± 0.09 and 1.00 ± 0.09 × 10⁻³ mm2/s. The ADC of LR-1, LR-2 was significantly different than that of LR-3, LR-4, LR-5 with a p-value of 0.001 for both reviewers.
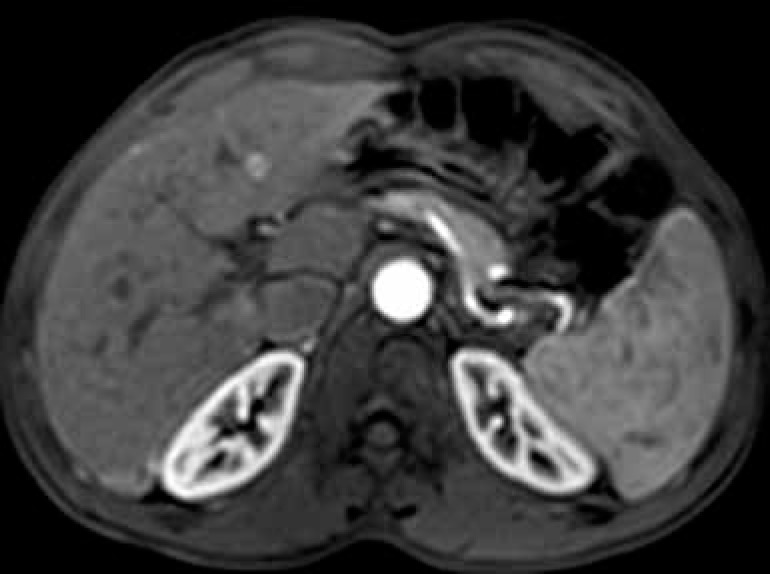
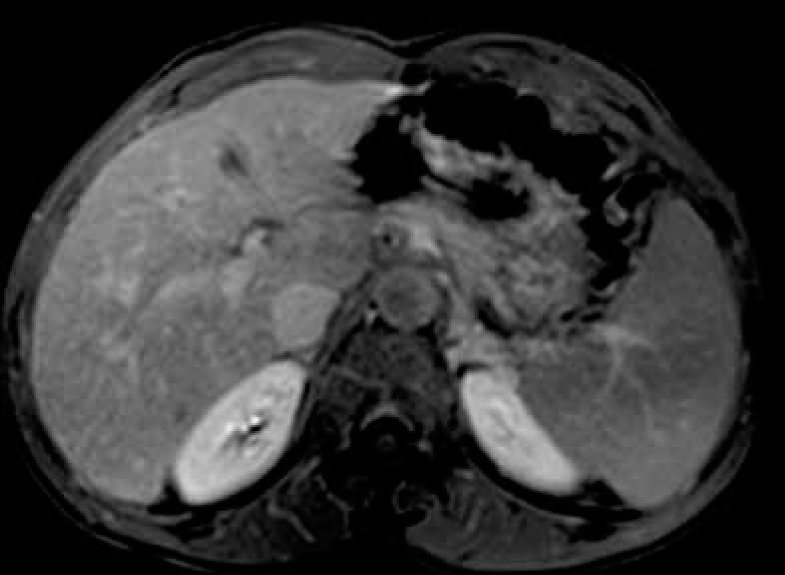
Figure 3
DWI (b value = 600 mm2/s) and ADC map shows restricted diffusion with ADC value of hepatic focal lesion (1.31 and 1.38 × 10⁻³ mm2/s) by both reviewers, respectively

Figure 4
Axial arterial phase image shows a large focal lesion in segment IV and another smaller lesion in segment III with similar arterial phase hyperenhancement
Figure 6
DWI (b value = 600 mm2/s) and ADC map show diffusion restriction of both lesions with ADC values of the large lesion (0.98 and 1.06 x 10⁻³ mm2/s) and for the smaller lesion (1.11 and 1.04 x 10⁻³ mm2/s) by both reviewers, respectively
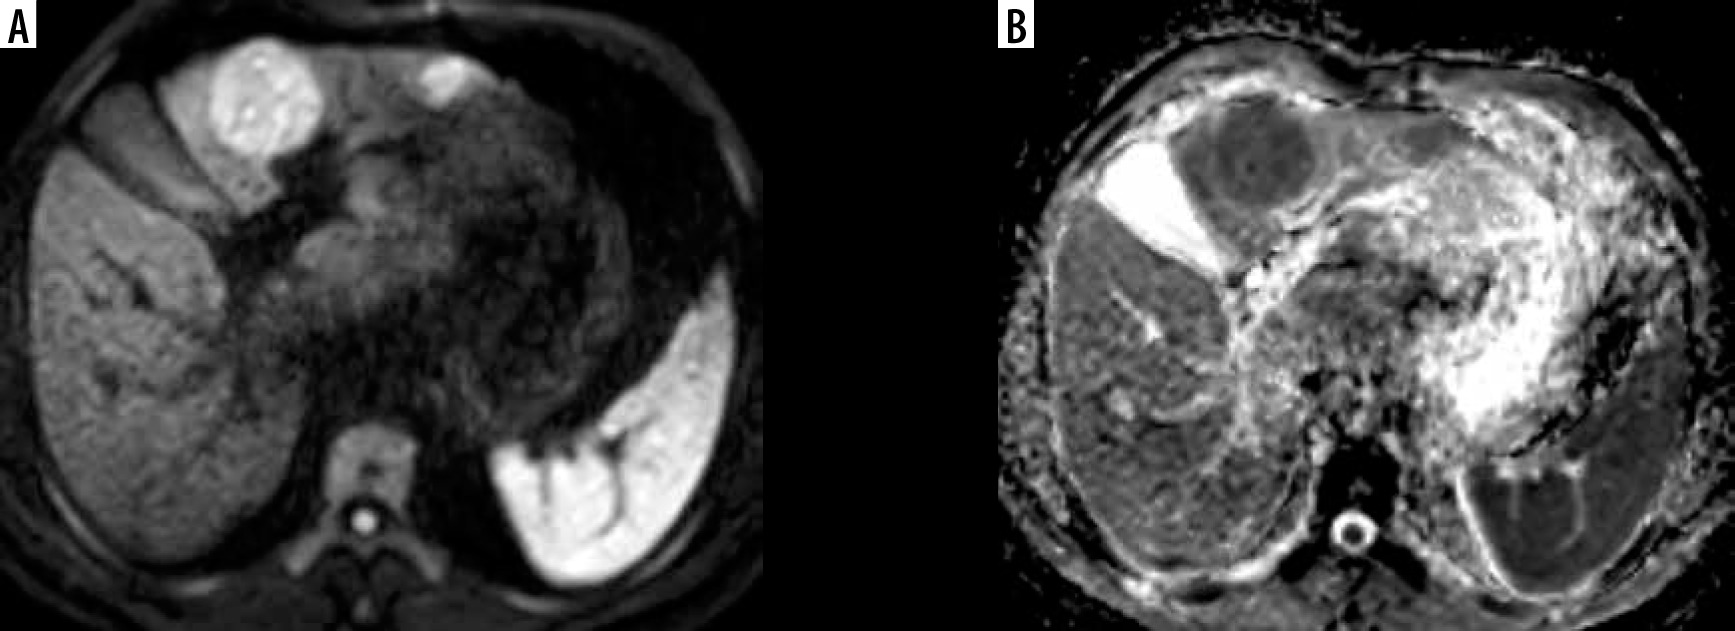

Figure 9
DWI (b value = 600 mm2/s) and ADC map show diffusion restriction with ADC values (0.95 and 0.97 × 10⁻³ mm2/s) by both reviewers, respectively
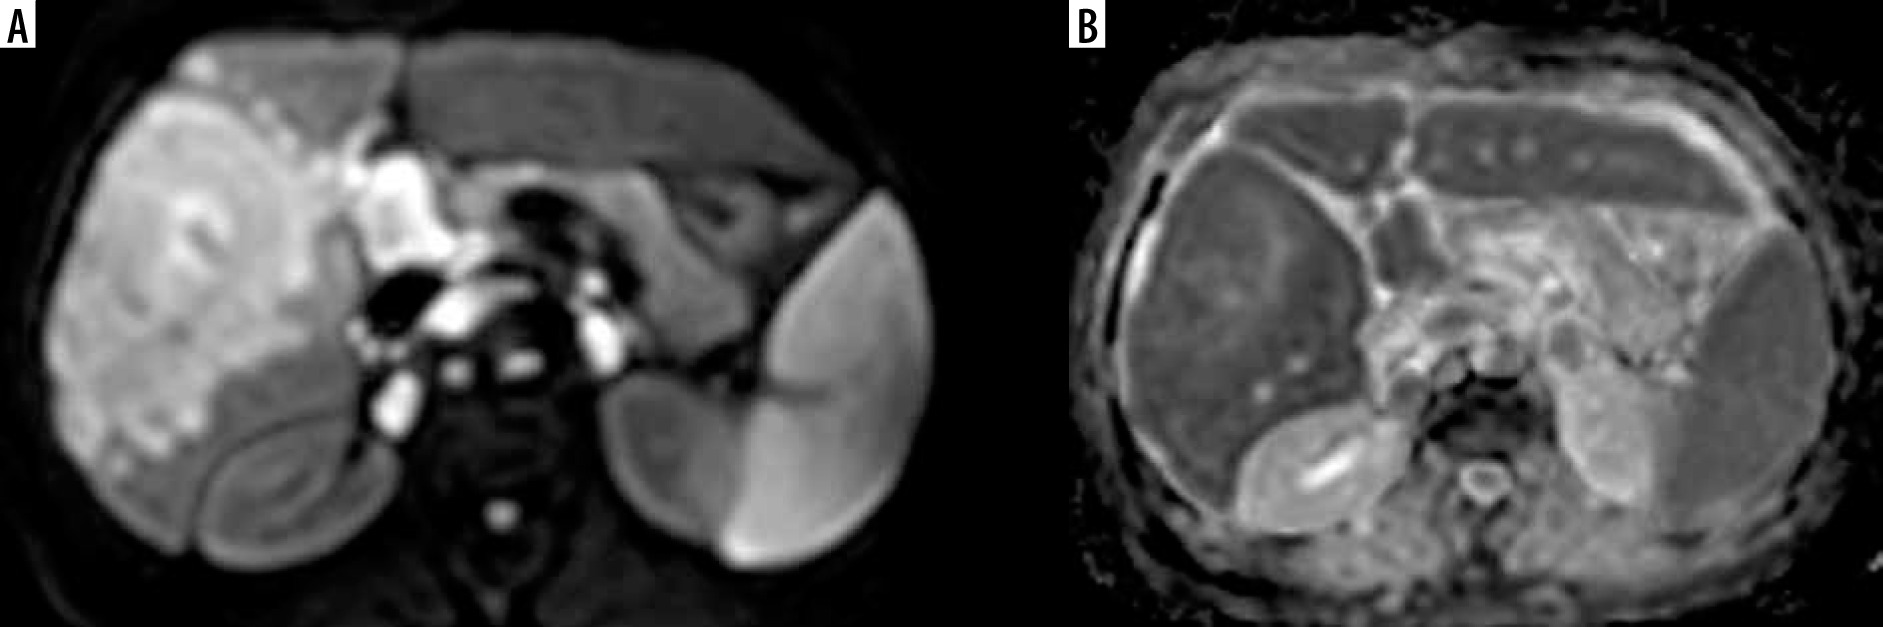
Table 1
Number of observations within each LI-RADS category by both observers
| Observer 1 | Observer 2 | |
|---|---|---|
| LR-1 | 26 | 26 |
| LR-2 | 21 | 21 |
| LR-3 | 8 | 6 |
| LR-4 | 14 | 18 |
| LR-5 | 33 | 32 |
| LR-M | 27 | 26 |
| LR-TIV | 8 | 8 |
Table 2
ADC (x 10-3 mm2/s) of LI-RADS v2018 of both reviewers with inter-observer agreement
Table 3 shows the ROC results of both readings of ADC values used for differentiation of LI-RADS subtypes. The cut-off ADC values used to differentiate LR-1, LR-2 from LR-3 by both observers were ≤ 1.442 and ≤ 1.498 × 10⁻³ mm2/s with AUCs of 0.97 and 0.92, respectively (Figure 10). The cut-off ADC values used to differentiate LR-3 from LR-4, LR-5, and LR-TIV by both observers were ≤ 1.214 and ≤ 1.238 × 10⁻³ mm2/s with AUCs of 0.948 and 0.926, respectively (Figure 11). The cut-off ADC values used to differentiate LR-M from LR-4, LR-5, and LR-TIV by both observers were ≤ 1.026 and ≤ 1.001 × 10⁻³ mm2/s with AUCs of 0.694 and 0.732, respectively (Figure 12).
Figure 10
Cut-off ADC values used to differentiate LR-1, LR-2 from LR-3 by both observers were ≤ 1.442 and ≤ 1.498 x 10⁻³ mm2/s with AUCs of 0.97 and 0.92, respectively
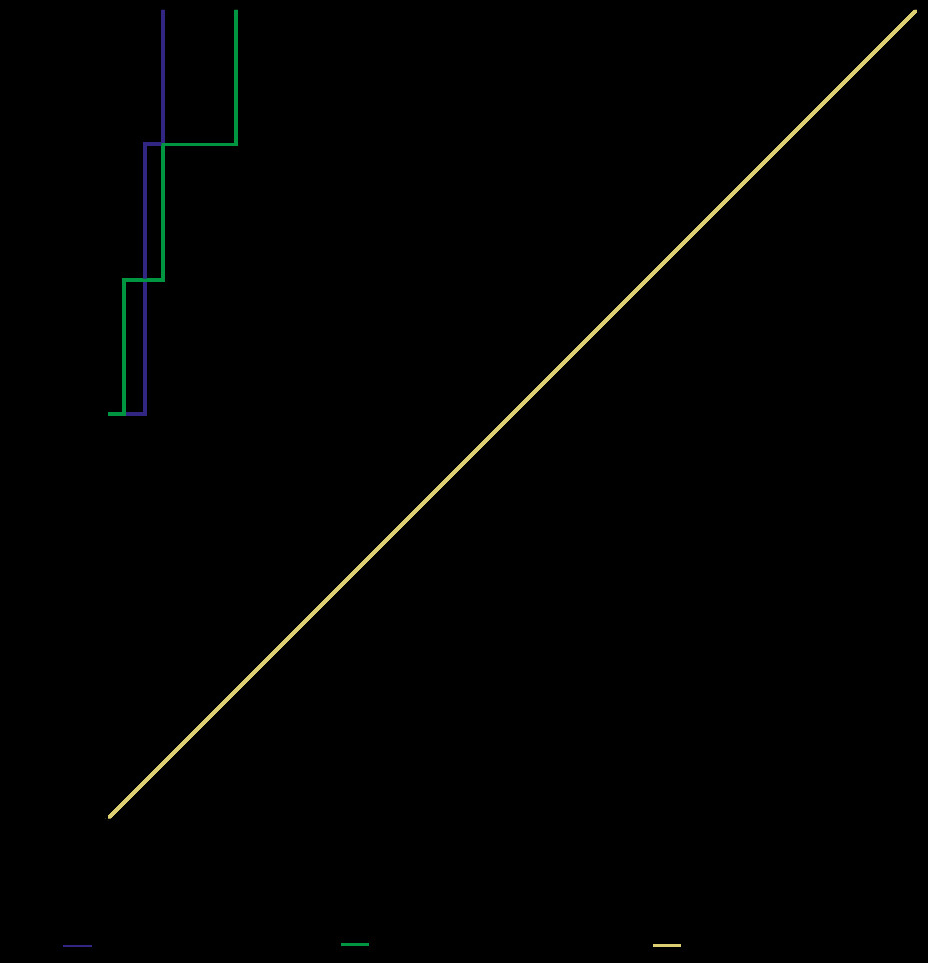
Figure 11
Cut-off ADC value used to differentiate LR-3 from LR-4, LR-5, and LR-TIV by both observers were ≤ 1.214 and ≤ 1.238 x 10⁻³ mm2/s with AUCs of 0.948 and 0.926 x 10⁻³ mm2/s, respectively
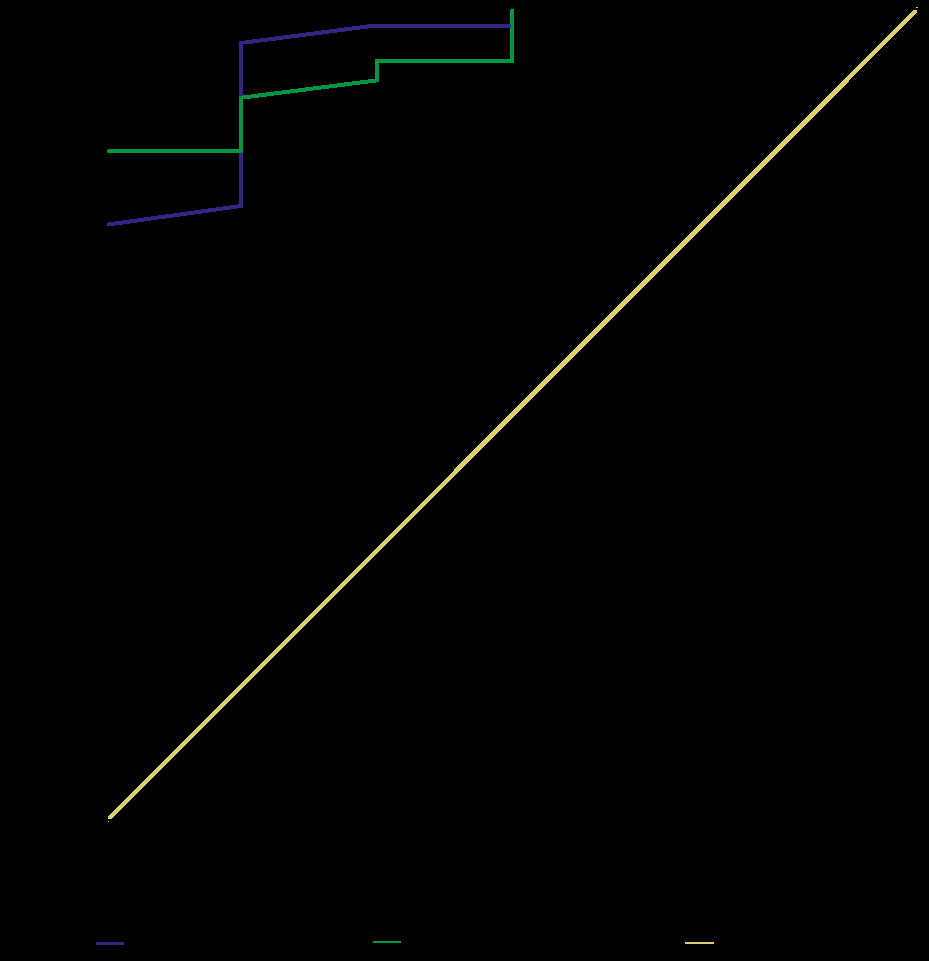
Figure 12
Cut-off ADC value used to differentiate LR-M from LR-4, LR-5, and LR-TIV by both observers were ≤ 1.026 and ≤ 1.001 with AUCs of 0.694 and 0.732, respectively
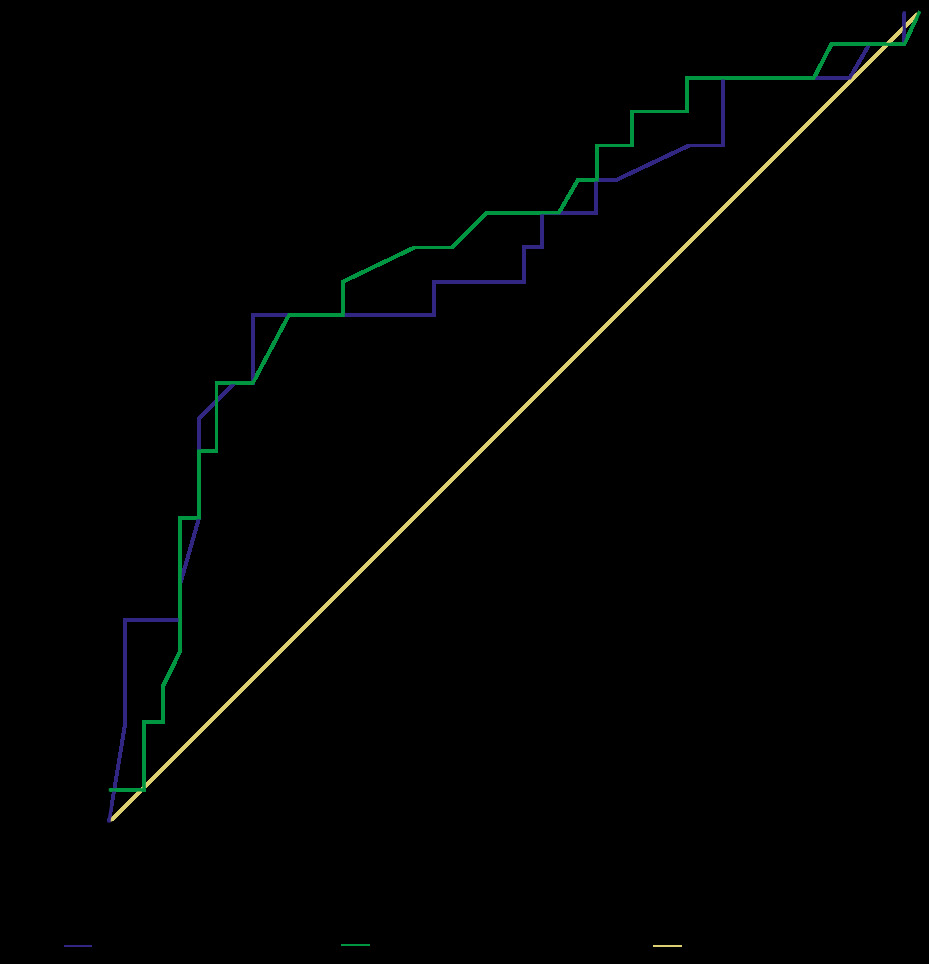
Table 3
ROC of ADC of LI-RADS-v2018 categories with AUC, accuracy, sensitivity, and specificity of both reviewers
There was statistically significant excellent agreement between both readings of ADC values for LR-1 and LR-2 (κ = 0.988 , p = 0.001), LR-4, LR-5 and LR-TIV (κ = 0.889, p = 0.001), and LR-M (κ = 0.883, p = 0.001). There was statistically significant excellent negative correlation of ADC and LI-RADS-v2018 (r = –0.849 and –0.84, p = 0.001) by both observers, respectively.
Discussion
In the current study, the ADC of LR-1,2 was significantly higher (p = 0.001) than that of LR-3, LR-4, LR-5 for both reviewers. There is a significant excellent agreement of ADC values for the evaluation of LI-RADS-v2018 by both reviewers, and there was a significant-excellent correlation between both readings of ADC and LI-RADS-v2018.
Precise differentiation between HCC and other malignant hepatic focal lesions is crucial because the treatment and prognosis differ significantly. Multiple previous updates and studies have been made to improve the LI-RADS classification system since its development, for a confident diagnosis of HCC [13-15]. In this study, not only dynamic contrast-enhanced MRI but also DWI and quantitative ADC analysis were used to differentiate between different hepatic focal lesions according to the recently released LI-RADS-v2018.
We performed a recent study concerned with LI-RADS-v2018 major imaging features and revealed excellent inter-observer agreement for LR-1, LR- 2, LR-5, LR-M, and LR-TIV with good agreement for LR-3 and LR-4 and excellent inter-observer agreement for the major imaging features [31]. So, in the current study we focused on both DWI and ADC analysis, the ADC value used to differentiate LR-3 from LR-1, LR-2 with AUC of 0.97 and 0.92, respectively, and from LR-4, LR-5, and LR-TIV with 0.948 and 0.926 by both observers, respectively.
A recent study showed that for prostate lesions with a PI-RADS score ≥ 3, ADC values calculated prospectively can help discriminate clinically insignificant from clinically significant prostate cancer, allowing pre-biopsy and pretreatment risk stratification [23]. A retrospective study was performed to define the diagnostic accuracy of ADC values in association with PI-RADS-v2 for the diagnosis of clinically significant prostate cancer in comparison to PI-RADS-v2 alone; the results revealed that the maximum benefit of incorporating absolute ADC values was in lesions with a PI-RADS-v2 score of 4 [24].
Prior studies were designed to assess the value of DWI and measured ADC values in a selected group of hepatic focal lesions, mainly concerned with differentiating between benign and malignant lesions. A prospective recent study evaluated the value of DWI in improving the sensitivity of LI-RADS classification of small hepatic lesions (≤ 20 mm), which were formerly characterized as LI-RADS grade 3-5 on dynamic contrast-enhanced CT [28], unlike our study, in which we included all variable LI-RADS v2018 categories. One retrospective study evaluated the performance DWI and T2-weighted imaging in the detection of HCC in reference to the LI-RADS version 2014 with only LI-RADS grade 3-5 lesions [29], while in our study we included all LI-RADS categories and LI-RADS major imaging features as the reference standard. A recent study used ADC values to differentiate between haemangioma and HCC, where ADC values of haemangiomas were significantly higher than those of HCC [30]. Another recent study stated that quantitative ADC histogram analysis increase the accuracy for the diagnosis of HCC compared to the other primary liver cancers, and the combination of quantitative ADC measurement and LI-RADS improve this distinction [27].
In this study, the inter-observer agreement of the ADC value of different categories of LI-RADS-v2018 is excellent. One study reported that the inter-reader agreement of the LI-RADS scores between combined technique and dynamic contrast MR imaging is good (κ = 0.765) [28]. Another study added that there is an excellent inter-observer agreement of both reviewers for LI-RADS-v2018 (κ = 0.887, p = 0.001) with 90.76% agreement [31].
In our study, there is a statistically significant-excellent negative correlation between ADC and LI-ARDS classification for both reviewers. One study reported that ADC and normalized ADC inversely correlates with PI-RADSv2 and International Society of Urological Pathology Systems categories [26]. Another study added that ADC values and categories help to diagnose clinically significant prostate cancer when lesions are assigned a PI-RADS v2 score of 4 [24].
There were a few limitations to our study. First, this is a retrospective design of the study with a small number of patients. Further prospective studies of a large number of patients are recommended. Second, this study included untreated hepatic focal lesions; further studies including hepatic focal lesions undergoing loco-regional treatment [32] are recommended. Third, this study used only DWI and ADC values for evaluating hepatic focal lesions; further studies using advanced MR techniques such as diffusion tensor imaging, arterial spin labelling, perfusion MR imaging, and MR spectroscopy with a higher 3-Tesla scanner [33-49] with LI-RADS-v2018 are recommended. Fourth, image analysis was performed by ROI localization; further studies with applied advanced post-processing such as machine learning and histogram analysis are advised for standard ROI size [50,51].
Conclusions
The inclusion of ADC values of hepatic focal lesions to the standard interpretation of LI-RADS-v2018 can improve accuracy, sensitivity, and specificity. Also, it may help in the early prediction of HCC. ADC measurement is a promising ancillary feature, which should be routinely performed for better clarification of different LI-RADS categories.