


Introduction
Exophthalmos, also referred to as proptosis, is defined as a forward displacement of the globe and is determined by the relationship between the volume of the orbital contents and the bony limitation by the orbital walls. It is one of the most common signs of many eye diseases including endocrine disorders, infections, inflammations, tumours, trauma, metastases, vascular diseases, and extra-orbital lesions.
Proptosis is a particularly critical sign for grading the severity and assessing the course of thyroid-associated orbitopathy (TAO), which is mostly associated with Graves’ disease. This condition is characterized by an auto-immune infiltration and increased mucopolysaccharide deposition within extraocular muscles and retrobulbar fat, which leads to an abnormal protrusion of the globe [1].
There is no gold standard for measuring the axial globe position (AGP). In clinical practice, the most widely applied instrument for proptosis assessment is the Hertel exophthalmometer (HE), which measures the distance from lateral orbital rims to the apex of the cornea. This technique is simple, rapid, and easy to perform; however, this method is researcher dependent [2,3]. More objective and reproducible methods for exophthalmos assessment include computed tomography (CT) and magnetic resonance imaging (MRI) [2-4].
MRI is particularly valuable in patients with Graves’ orbitopathy (GO) to evaluate muscle thickness, fat tissue volume, and compression of the optic nerve. Due to better tissue resolution and the lack of ionizing radiation, this method has an advantage over CT in assessing patients with GO and can also be used concurrently to assess the degree of proptosis [1,5].
There are 2 approaches for measuring exophthalmos, both related to the interzygomatic line. The first method measures the distance between the interzygomatic line and the anterior surface of the globe (corneal apex) [6,7] while the other uses the distance from the interzygomatic line to the posterior sclera [8]. The degree of proptosis is measured at the level of the lens.
Although assessment of the orbital structures using MRI is well described in the literature, there is no consensus as to which measurement method is the most reliable in exophthalmos assessment.
The aim of the study is to correlate the 2 MRI methods of exophthalmos measurement with exophthalmometry results and to identify a proper technique of exophthalmos measurement.
Material and methods
Patients and examinations
This retrospective study was approved by the Institutional Review Board, who waived the need for individual patient consent. All patients provided written informed consent before the examinations.
Fifty-four patients (108 orbits) with exophthalmos in the course of Graves’ orbitopathy were enrolled in the study. The mean age of the patients at the time of the exa-mination was 52.2 years (20-74 range). There was a major female predominance: the female/male ratio was 46 to 8. The patients with orbital surgical decompression were excluded from the study.
All patients underwent MR imaging study using a 1.5 T scanner (Siemens Magnetom Avanto SQ Engine TIM [76 × 32], Erlangen, Germany). The examination was carried out in a supine position, the patient was asked to keep their eyes fixed looking straight ahead, and a standard matrix coil was used.
The MRI orbit protocol parameters are presented in Table 1. The slice thickness for all sequences was 2 mm with a 0.3 mm intersection gap.
Table 1
Detailed magnetic resonance imaging sequence parameters of the orbital imaging protocol
All measurements were performed independently by 2 radiologists with 7 and 20 years of experience, respectively, on T2-weighted axial images at the level of the lens. In this sequence it is easier to delineate a corneal apex from closed eyelids.
In order to determine the globe position, a line between lateral orbital rims, i.e. the interzygomatic line (IZL), was drawn. In the next steps, 2 measurements were performed independently for the right and left orbit.
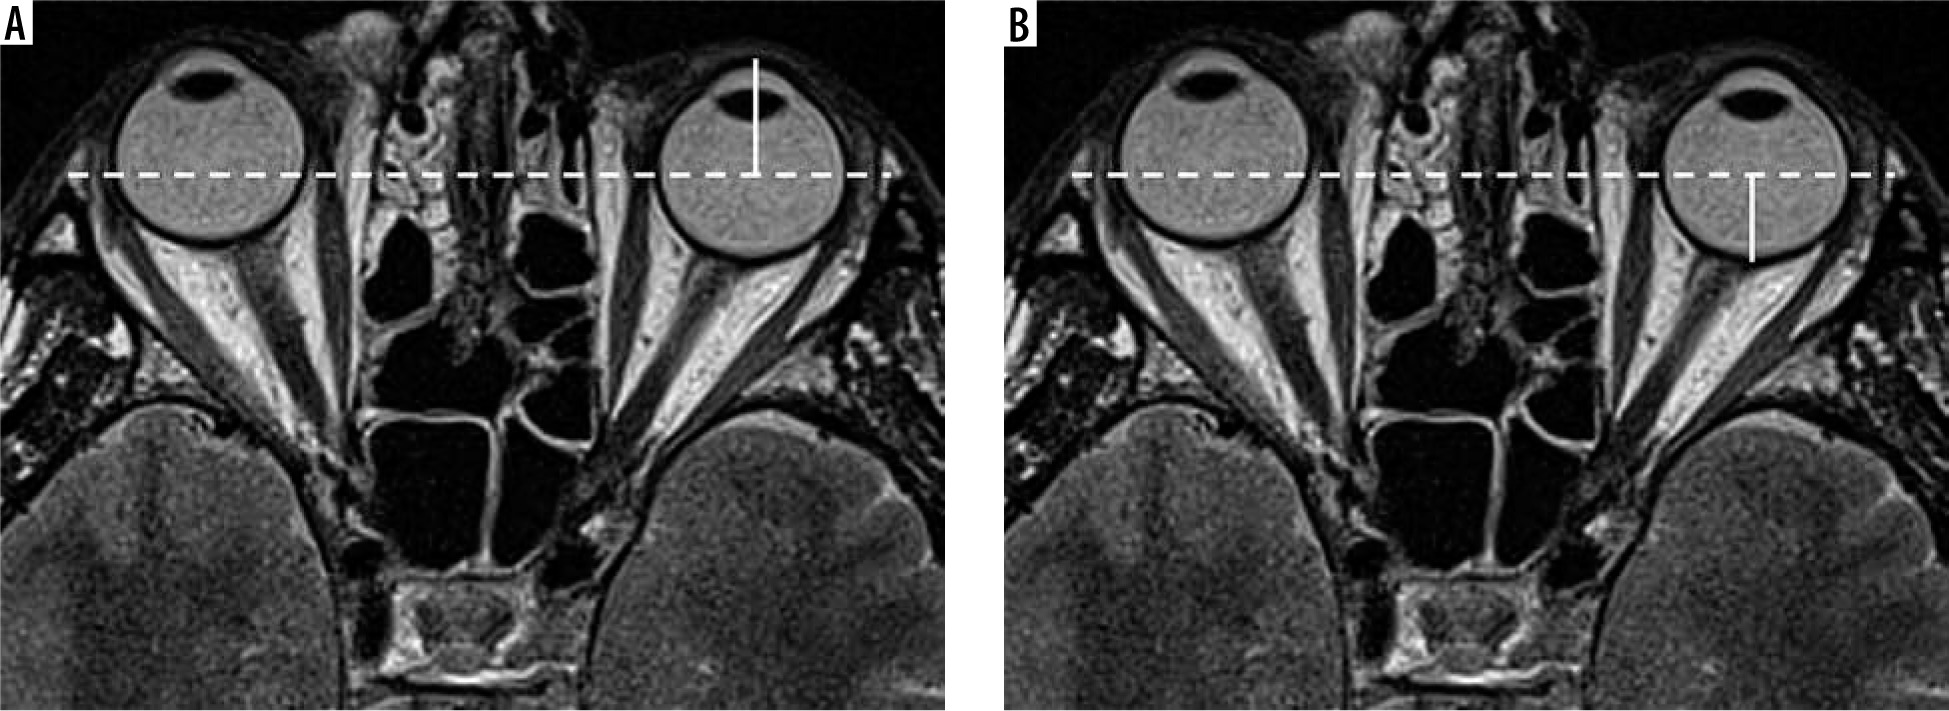
First, a perpendicular line from the IZL to the anterior margin of the globe was drawn (to the corneal apex) to provide the anterior diameter (AD) (shown in Figure 1A). Next, the distance from the IZL to the posterior margin of the globe was taken, to generate the posterior diameter (PD) (shown in Figure 1B).
Figure 1
A). An axial T2-weighted sequence at the level of the lens and optic nerve. Techniques of proptosis measurement on imaging. Anterior distance (AD) between the interzygomatic line and the anterior surface of the globe. B) An axial T2-weighted sequence at the level of the lens and optic nerve. Techniques of proptosis measurement on imaging. Posterior distance (PD) from the interzygomatic line to the posterior sclera
All measurements were performed using universal imaging software (Syngo.via – Siemens, Erlangen, Germany).
Within 4 weeks of the MR study, each patient underwent exophthalmometry using the Hertel exophthalmometer (Oculus Inc., Wetzlar, Germany), and no medical treatment was used between MRI and exophthalmometry. All examinations were performed by the same ophthalmologist using the same device to exclude inter-observer and inter-instrument variability.
Hertel exophthalmometer measurements were taken with the patient’s head in the upright position. The exo-phthalmometer was placed against the lateral rims of the orbits. The distance from the apex of the corneas to the late-ral orbital rims was viewed using mirrors from the sides, with the ophthalmologist’s and the patient’s eyes being at the same level.
The ophthalmologist (AJP) was blinded to the MRI results.
Statistical analysis
Statistical analysis was performed using SPSS 13.0 (SPSS Inc., Chicago, IL, USA). The inter-observer variation was assessed using the Pearson correlation coefficient, and the unpaired t-student test was used for comparison between the 2 modalities. Values were presented as mean and standard deviation, and the difference in values were explored with Student’s t-test. Statistical significance was defined as p < 0.05.
Results
The mean AD for both eyes measured by the first observer was 20.6 ± 3 mm (in the range from 14 mm to 29 mm), and the median was 20.2 mm. For the right eye, the mean AD was 20.6 ± 3 mm (from 14 mm to 28.3 mm), and the median was 20.3 mm; for the left eye, the mean AD was 20.6 ± 3 mm (from 15.2 mm to 29.0 mm), and the median was 19.8 mm.
The same measurements performed by the second observer were as follows: the mean AD for both eyes was 20.7 ± 2.9 mm (from 14 mm to 28.4 mm), and the median was 20.2 mm; for the right eye the mean AD was 20.9 ± 2.9 mm (14 mm to 28.4 mm), and the median was 20.6 mm; and for the left eye the mean AD was 20.5 ± 2.9 mm (15.1 mm to 27.9 mm), and the median was 20.1 mm.
Inter-observer variation for AD measurements was near perfect: the r-Pearson correlation coefficient was 0.98 for the right eye and r = 0.96 for the left eye; for both eyes it was r = 0.98. All correlations were statistically significant at p = 0.01.
The PD measurement estimated by the first observer ranged from –5.4 mm to 9 mm (mean 2.9 ± 2.9 mm; median 2.9 mm). For the right eye from –5.3 mm to 7.5 mm (mean 2.8 ± 2.9 mm, median 3 mm), and for the left eye from –5.4 mm to 9 mm (mean 3.1 ± 2.9 mm, median 2.8 mm).
The PD measurements performed by the second observer ranged from –4.4 mm to 9.2 mm (mean 3.4 ± 2.8 mm, median 3.7 mm). For the right eye from –4.4 mm to 9.2 mm (mean 3.2 ± 2.8 mm, median 3.6 mm), and for the left eye from –3.6 mm to 9.7 mm (mean 3.5 ± 2.9 mm, median 3.7 mm).
The correlation between observers for PD measurements was r = 0.96 for the right eye, r = 0.94 for the left eye, and r = 0.95 for both eyes. All correlations were statistically significant (p = 0.01).
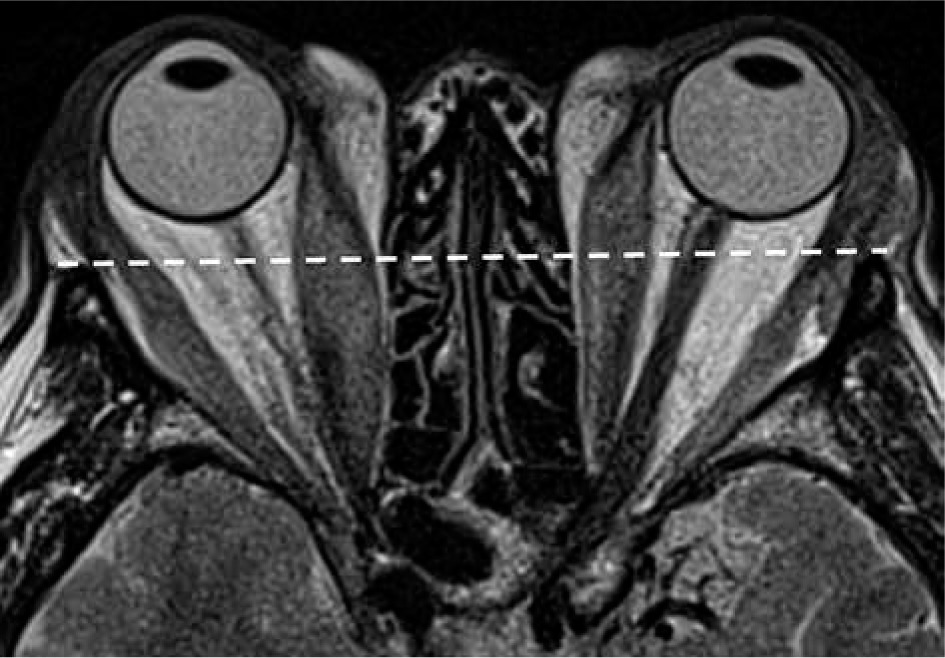
In 6 patients with severe exophthalmos 11 globes were located anteriorly to the IZL, in which case the posterior distance values were below zero (shown in Figure 2).
Figure 2
An axial T2-weighted sequence at the level of the lens and optic nerve. In severe exophthalmos, the globe is located anteriorly to the interzygomatic line, in which case the posterior distance values are below zero
MRI results are shown in Table 2.
Table 2
Anterior and posterior distance measurements performed by 2 radiologists in magnetic resonance imaging (mm)
The mean AD measured using the Hertel exophthalmometer was 21 ± 3.4 mm (range between 15 mm and 30 mm, median 21 mm). For the right eye: 21.2 ± 3.2 mm (between 16 mm and 29 mm, median 21 mm), and for the left eye: 20.9 ± 3.5 mm (15-30 mm, median 21 mm), respectively.
The exophthalmometry results are presented in Table 3.
Table 3
Hertel exophthalmometry results (mm)
| Both eyes | Right eye | Left eye | |
|---|---|---|---|
| Range | 15-30 | 16-29 | 15-30 |
| Mean ± SD | 21 ± 3.4 | 21.2 ± 3.2 | 20.9 ± 3.5 |
| Median | 21 | 21 | 21 |
The AD measurements in MRI were strongly correlated with exophthalmometry results for both observers (r = 0.87-0.9, p = 0.01).
Correlation between the MRI results and exophthalmometry results are shown in Table 4.
Discussion
Position measurements of the eyeballs in patients with TAO is an important diagnostic factor, which plays a crucial role in evaluating treatment effects.
There are various techniques of globe position assessment such as CT, MRI, and exophthalmometry. Although there are multiple studies describing typical imaging findings of TAO, there is still a need for publications comparing different techniques (especially MRI). Moreover, there is no consensus as to which imaging modality and which measurement method should be the gold standard.
Nowadays, due to development and better availability of MRI, many authors agree that MRI should be the method of choice for patients with TAO, because it enables visualization of not only structural changes, but also of the activity of inflammatory processes within orbital muscles and retrobulbar fat. This technique can also be used concurrently to assess the degree of proptosis, especially because there is no radiation exposure, which is very important when it is necessary to repeat examinations to evaluate treatment effects [1,5,9].
Furthermore, confusingly, there are 2 exophthalmos measurement methods coexisting in the literature. Both measurements use the IZL, which connects lateral orbital rims on axial images at the level of the lens. The anterior diameter (AD), the so-called Hertel index, is the perpendicular distance from the IZL to the corneal apex, while the posterior diameter (PD) is the distance from the IZL to the posterior margin of the globe.
According to some sources, proptosis can be diagnosed if the AD exceeds 21 mm [5-7]. Others focused on PD: Nugent et al. diagnosed proptosis when the PD value is below 9.9 ± 1.7 mm [8], whereas Ozgen et al. defined the position of the eyeball as normal if the PD value was 8.9 ± 1.2 mm on MRI [10] and 9.4 ± 1.0 mm on CT [11] .
The criteria listed above do not correspond with results. There was a discrepancy in exophthalmos diagnosis between AD and PD measurements. All patients in our group had PD results below 9.7 mm (both in the assessment of the first and of the second observer), while the AD results ranged from 14 mm to 29 mm. Based on the PD results, all patients met the exophthalmos criteria, which is the case of only some of them if AD results are taken as the reference.
In our study, we compared 2 measurement methods to find that the correlation between observers was slightly higher for AD vs. PD results (r = 0.98 vs. r = 0.95 for both eyes), which suggests better reproducibility of the AD measurement.
What is more, we observed that in the group of patients with severe exophthalmos, the globes were located anterior to interzygomatic line, so the PD value is below zero. And, finally, only the AD measurements can be directly correlated with the reference clinical method, namely exophthalmometry.
In our study, the correlation coefficient (r-Pearson) between MRI and exophthalmometry was very high (r = 0.87-0.9, p = 0.01), even though the MR examination was performed with the patient in the supine position and the exophthalmometry with the patient in the seated position.
For comparison, other authors who compared CT proptosis versus those obtained with a clinical exophthalmometer using a Hertel or a Krahn instrument observed a correlation coefficient between CT and Hertel readings of 0.91 [12] and CT and Krahn readings of 0.73 [13].
In a study by the international Thyroid Eye Disease Society, the correlation between CT and exophthalmometry ranged from 0.855 to 0.916 [14]. Segni et al. found that proptosis readings from CT scans tended to be lower than the clinical exophthalmometer readings, presumably because they measured the inner corneal surface (the corneal thickness is approximately 0.5 mm) [15].
In our research, the discrepancy between MR results and exophthalmometer measurements was much smaller, at approximately 0.1 mm, which was probably due to a more accurate visualization of the cornea in MRI than in CT, and perhaps because of lower mobility of the eyeballs in patients with GO.
The advantage of MRI over CT is that MRI provides the possibility to easily differentiate the cornea from closed eyelids, which is a problem on CT scans. To address this problem, some authors who used CT suggested conducting the examination with open eyelids [6,14], while others measured the posterior surface of the cornea, which is easier to determine [15].
Surprisingly, we found only 2 articles describing MRI as a method of assessing of AGP: Ozgen et al. and Ayiekomogbon et al. defined the normal globe position in healthy individuals [10,16]. Ozgen measured PD, whereas Ayiekomogbon measured both AD and PD. In the first study, the position of the eyeball was defined as normal if the PD value was 8.9 ± 1.2 mm in MRI [10]. In the second study, the PD of the right globe was 6.34 ± 0.99 mm from the IZL (ranging from 5.40 to 7.33 mm), while that of the left globe was 6.56 ± 0.93 mm (ranging from 5.63 to 7.50 mm); the AD was 17.11 ± 1.66 mm and 16.81 ± 1.35 mm for the right eye for males and females, respectively, while that of the left was 16.84 ± 1.54 mm and 16.46 ± 1.15 mm for male and female participants, respectively. The Ayiekomogbon results differ from those of Ozgen [10] and those of Nugent et al. [8], who found that normal PD was 9.9 ± 1.7 mm, probably due to ethnic differences, which were also described in other studies [17-19].
Interestingly, in both MRI studies AGP was assessed on T1-weighted images. When it comes to PD measurement, it is easy to delineate the posterior sclera both on T1- and T2-weighted images, but in our opinion it is easier to differentiate the corneal apex from closed eyelids on T2-weighted images.
The main limitation of our study was the lack of refe-rence clinical method for PD; however, as previously noted, it simply does not exist. Additionally, we did not compare AD and PD and exophthalmometry results in healthy individuals. Evidently, it would be interesting to check to what degree postural proptosis affects the AD and PD values.
Many years ago, Gibson defined the CT parameters for proptosis measurement and found that repetitive measurements on the same slice produced a total measurement error of 0.08 mm. Nowadays, in the MRI era, precision criteria for examinations and measurements are needed to guarantee the results’ accuracy and reproduci-bility.
Conclusions
The results of our study show that MRI may be used in clinical practice to assess exophthalmos. Moreover, we recommend measuring the anterior distance (AD) on T2-weighted axial images because it has better reproducibility and is directly correlated with Hertel exophthalmometry results. This method is sufficient in routine practice for exophthalmos diagnosis and treatment monitoring.