


Introduction
It is known that 80% of adults experience low back pain (LBP) at least once during their lifetime, which is linked to different causes. Due to frequent incidence and causing morbidity in the short and long term, it is a health problem with high socioeconomic costs to society [1,2]. If we examine the causes of LBP, a broad framework, from traumatic events to working conditions, of demographic characteristics to congenital malformations, is observed. Lumbar disk herniation (LDH) is one of the processes causing a significant degree of low back pain [3].
LBP is defined as “disc material, localised or focally, found outside the boundaries of the intervertebral disc interval” [4]. It occurs with a variety of degrees and may or may not cause spinal channel and neural foramen narrowing, leading to a variety of degrees of nerve compression. These cases have symptoms from pain to sensory defects or neurological deficits.
Paravertebral muscles, playing a large role in ensuring the balance of the vertebral column (Figure 1), are the basic supporter of the vertebral column and the most important factor ensuring stabilisation of the vertebral column in situations such as load carrying [5]. Due to increased immobilisation linked to age or as a result of denervation forming with a variety of causes, these muscles may undergo fatty degeneration. As a result, the status of the paravertebral muscles is important for the assessment and management of LBP and pathologies causing LBP.
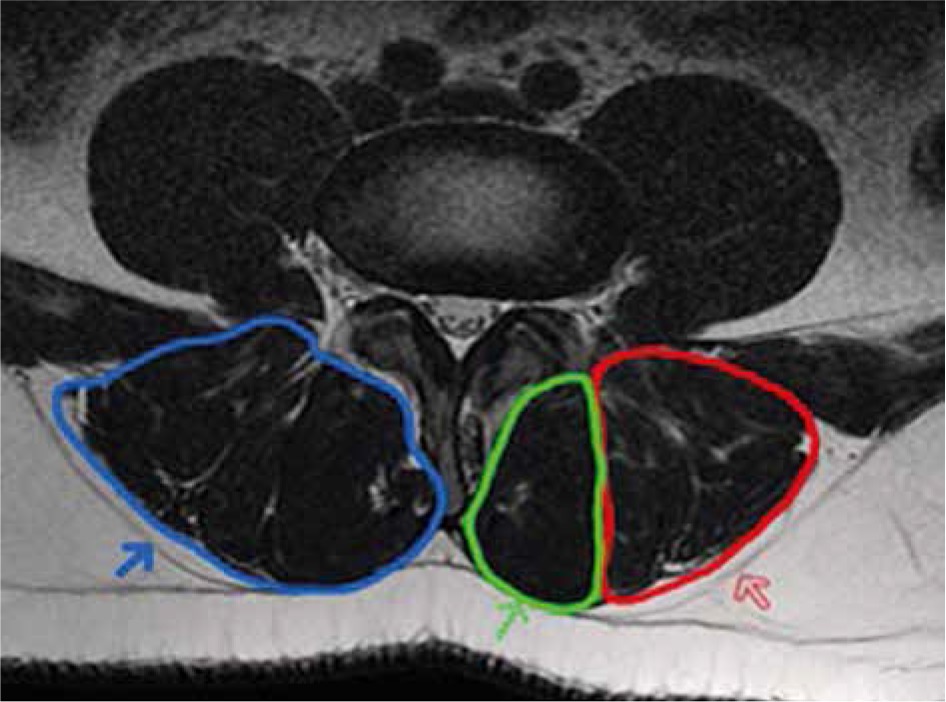
Figure 1
Axial T2-weighted magnetic resonance image of posterior paravertebral muscles showing the paravertebral muscle group (blue arrow), multifidus muscle (green arrow), and erector spinae muscle (red arrow)
The aim of our study is to evaluate the relationship between erector spinae and multifidus, which are posterior paravertebral muscles, with lumbar disc hernias and fatty degeneration.
Material and methods
Selection of case and control groups
Permission was granted by the clinical research Ethics Committee of Çanakkale Onsekiz Mart University before the study. For this study we scanned patients with lumbar magnetic resonance imaging (MRI) between April 2015 to April 2016. Patients aged 18-64 years, from neurosurgery, neurology, orthopaedic, and physical therapy and rehabilitation clinics, with initial diagnosis of LBP, radicular pain, or LDH were included in this study. Patients with vertebral fracture, spondylitis-spondylodiscitis, tumour, structural anomalies (spondylolisthesis, scoliosis, vertebra segmentation anomalies, etc.), and patients with previous surgery in the lumbar region were excluded. Also, patients with intervertebral disc bulging were excluded, because disc bulging is not accepted as herniation but is a degenerative change [4].
The case group included 205 patients with LDH on MRI between levels L1 and S1 (apart from intravertebral disc hernia). In the control group there were 187 patients with disc hernia not identified on MRI. The case group included 105 males and 100 females, while the control group included 88 males and 99 females. In the case group 86 patients (54 males and 32 females) were under the age of 40 years, while 119 patients (51 males and 68 females) were 40 years of age or older. In the control group, a total of 90 patients (45 males and 45 females) were under the age of 40 years, while a total of 97 patients (43 males and 54 females) were 40 years of age or older.
Imaging and data analysis
Images were obtained with a 1.5 T MR device (Signa Excite; General Electric Medical systems, Milwaukee, WI, USA) with patients lying on the MR table in a supine position. Sequences investigated were T2 fast spin-echo (FSE) (time to repetition [TR]/time to echo [TE] 3300 ms/91 ms), and scans were 4 mm slice thickness parallel to discs from L1 to S1 vertebrae in the axial plane. In the sagittal plane, 4 mm thickness slices with T1 FSE (TR/TE 440 ms/15 ms) and T2 FSE (TR/TE 3600 ms/105 ms) images were obtained.
Magnetic resonance images were evaluated with PACS (picture archiving and communication system) on the hospital automation system. The presence of LDH from L1-S1 levels was separately assessed for each disc level, especially on T2-weighted axial and sagittal images. Hernia types were evaluated as protrusion, extrusion, or sequestration within different locations such as median-paramedian-foraminal-extraforaminal from vertebral corpus posterior margin, as in MSUC classification [6]. Degeneration of paravertebral muscles was separately assessed for erector spinae and multifidus muscle groups at the level where the volume of muscles was the thickest; in other words, at L1-2 for erector spinae and at L4-5 and L5-S1 levels for multifidus muscles, not just at the level of LDH.
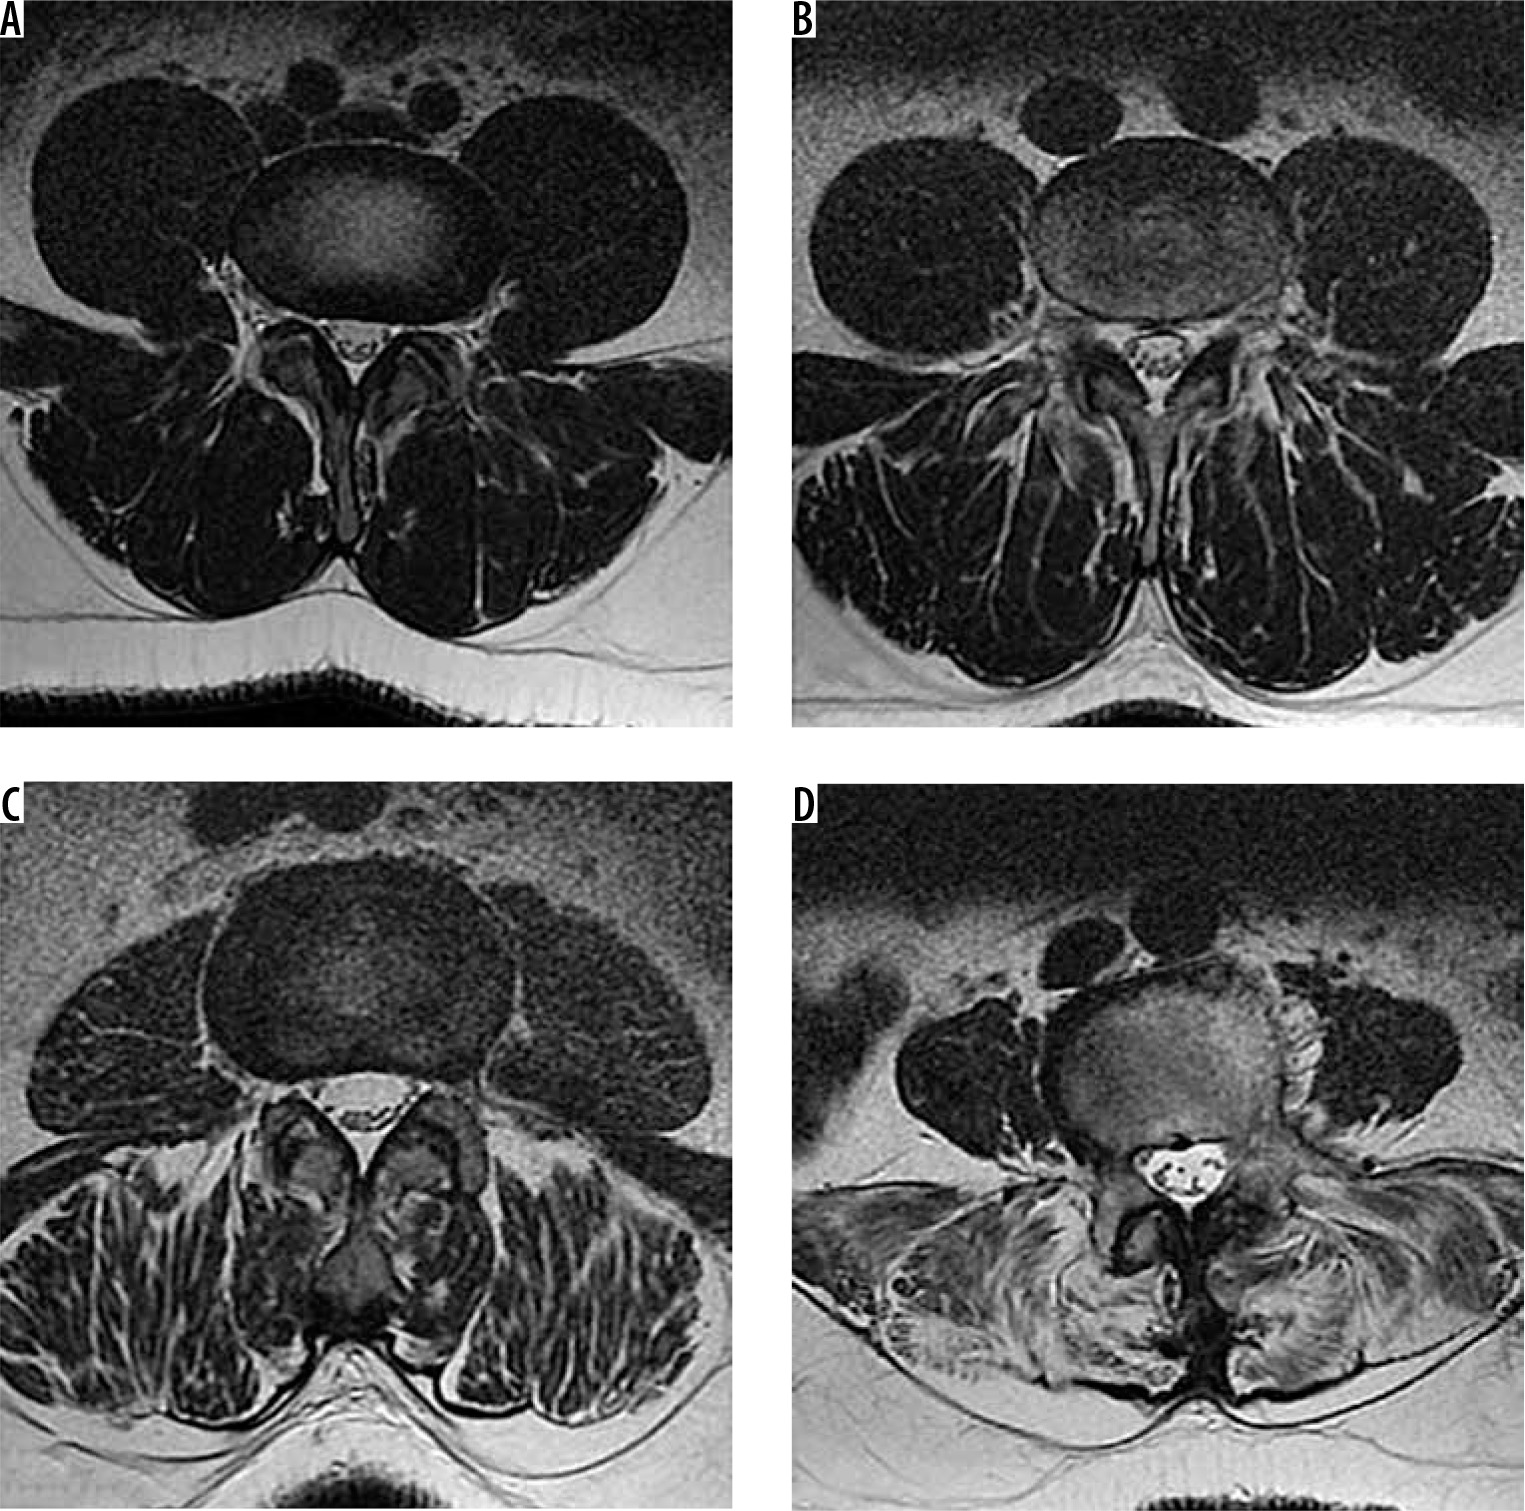
Fatty degeneration of paravertebral muscles was assessed with a four-point visual scale as used by Kader et al. [7]. On the four-point scale, based on the amount of fat deposition within and around muscles, stage A was normal muscle tissue without fat deposition, stage B was mild fatty striations in muscle, stage C was moderate, and stage D was advanced fat deposition. In stage B there is < 10% fatty component. In stage C fat deposition is more prominent but lower than 50%, and in the last stage, D, fatty tissue is more than muscle component, at > 50% (Figure 2). If there is asymmetrical fatty degeneration in one level, we made the staging according to the side with more fat.
Statistical analysis
Analysis of data was evaluated with SPSS (statistical package for the social sciences) version 19.0 for Windows operating systems. Normal distribution of variables was investigated with the Kolmogorov-Smirnov test. Descriptive data are presented as mean, standard deviation, frequency, and percentage values. The Mann-Whitney U test was used for comparison of variables without normal distribution between the groups. The c2 test was used for comparison of dependent and independent groups. Correlation between two measurements was investigated with Kendall’s correlation test. P values below 0.05 were accepted as statistically significant.
Results
Lumbar MRI of 205 individuals (100 females, 105 males) in the case group and 187 (99 females, 88 males) in the control group were examined. The mean ages in case and control groups were 42 ± 12.4 and 41.3 ± 12.4 years, respectively. When case and control groups are assessed in terms of age and gender distribution, there were no statistically significant differences identified between them (p = 0.465 and p = 0.411, respectively) (Table 1).
Table 1
Demographic data and lumbar disc herniation in the study groups
In the case group, 43 patients were identified as having herniation at more than one level and 5 patients had herniation at 3 levels simultaneously. Among male patients, 15 had upper lumbar level (first three lumbar discs) herniation identified, with eight of these having hernia at more than one level. Among females, 15 patients had upper level (first three lumbar discs) hernia identified, with five of these having more than one herniation.
Distribution of hernia level according to patient age was 85 patients < 40 years had lower lumbar level (last two levels) hernias, while two patients had both upper and lower level hernias in the case group. In the group of patients > 40 years, 17 patients had upper, 90 patients had lower level, and 11 patients had hernia at both levels.
In male patients of the case group, 24 did not have fat deposition in the erector spinae; however, 37 patients had mild and 50 patients had moderate fat deposition. For the multifidus muscle, 24 patients had no fattening, while 52 patients had mild, 28 patients had moderate, and one patient had advanced fat deposition. For erector spinae muscle in females, three patients had none, while 26 patients had mild, 60 patients had moderate, and one patient had advanced fat deposition. For the multifidus muscle, five patients had none, 43 patients had mild, 50 patients had moderate, and two patients had advanced fat deposition identified (Table 2).
Table 2
Degree of fatty degeneration of the muscles in the study group
In the control group of male patients, for the erector spinae, 18 had none, 37 had mild, and 33 had moderate degree of fat deposition. For the multifidus, 16 males had none, 43 patients had mild, and 29 patients had moderate fat deposition. For females, in the erector spinae muscle 18 patients had no fat, while 23 patients had mild, 56 patients had moderate, and two patients had advanced fat deposition. For the multifidus muscle, 15 patients had none, while 31 patients had mild, 52 patients had moderate, and two patients had advanced fat deposition (Table 2).
Patients in the case group aged > 40 years had more fat in both erector spinae and multifidus (p < 0.001 and p < 0.001, respectively). Similarly, females in the case group had more fat in the erector spinae and multifidus muscles compared to males (p < 0.001 and p < 0.001, respectively). Similar to the case group, in the control group more fat deposition was identified for both erector spinae and multifidus for females (p = 0.014 and p = 0.024, respectively) and in patients > 40 years of age (p < 0.001 and p < 0.001, respectively) (Table 2).
When case and control groups are compared (Figures 3 and 4), there were no significant differences between fat deposition in both erector spinae and multifidus muscles (p = 0.140 for erector spinae and p = 0.556 for multifidus) (Table 3). Patients with upper lumbar level hernia were observed to have moderate fat for both multifidus and erector spinae (58.8% and 82.4%, respectively). However, patients with lower lumbar level hernia had mild and moderate degrees of fat in these muscles (48% and 55.4%, respectively). Patients with hernia at all levels were identified to have mild degree of fat deposition in multifidus and moderate degree in the erector spinae, like patients with lower level hernia (46.2% and 69.2%, respectively). The p values for these were identified to be < 0.001 for both muscle groups (Table 2).
Figure 3
Axial magnetic resonance images showing different degrees of fatty degeneration in the paravertebral muscles of the control group. A) Stage 0 (normal), B) stage 1, C) stage 2, and D) stage 3 fattening
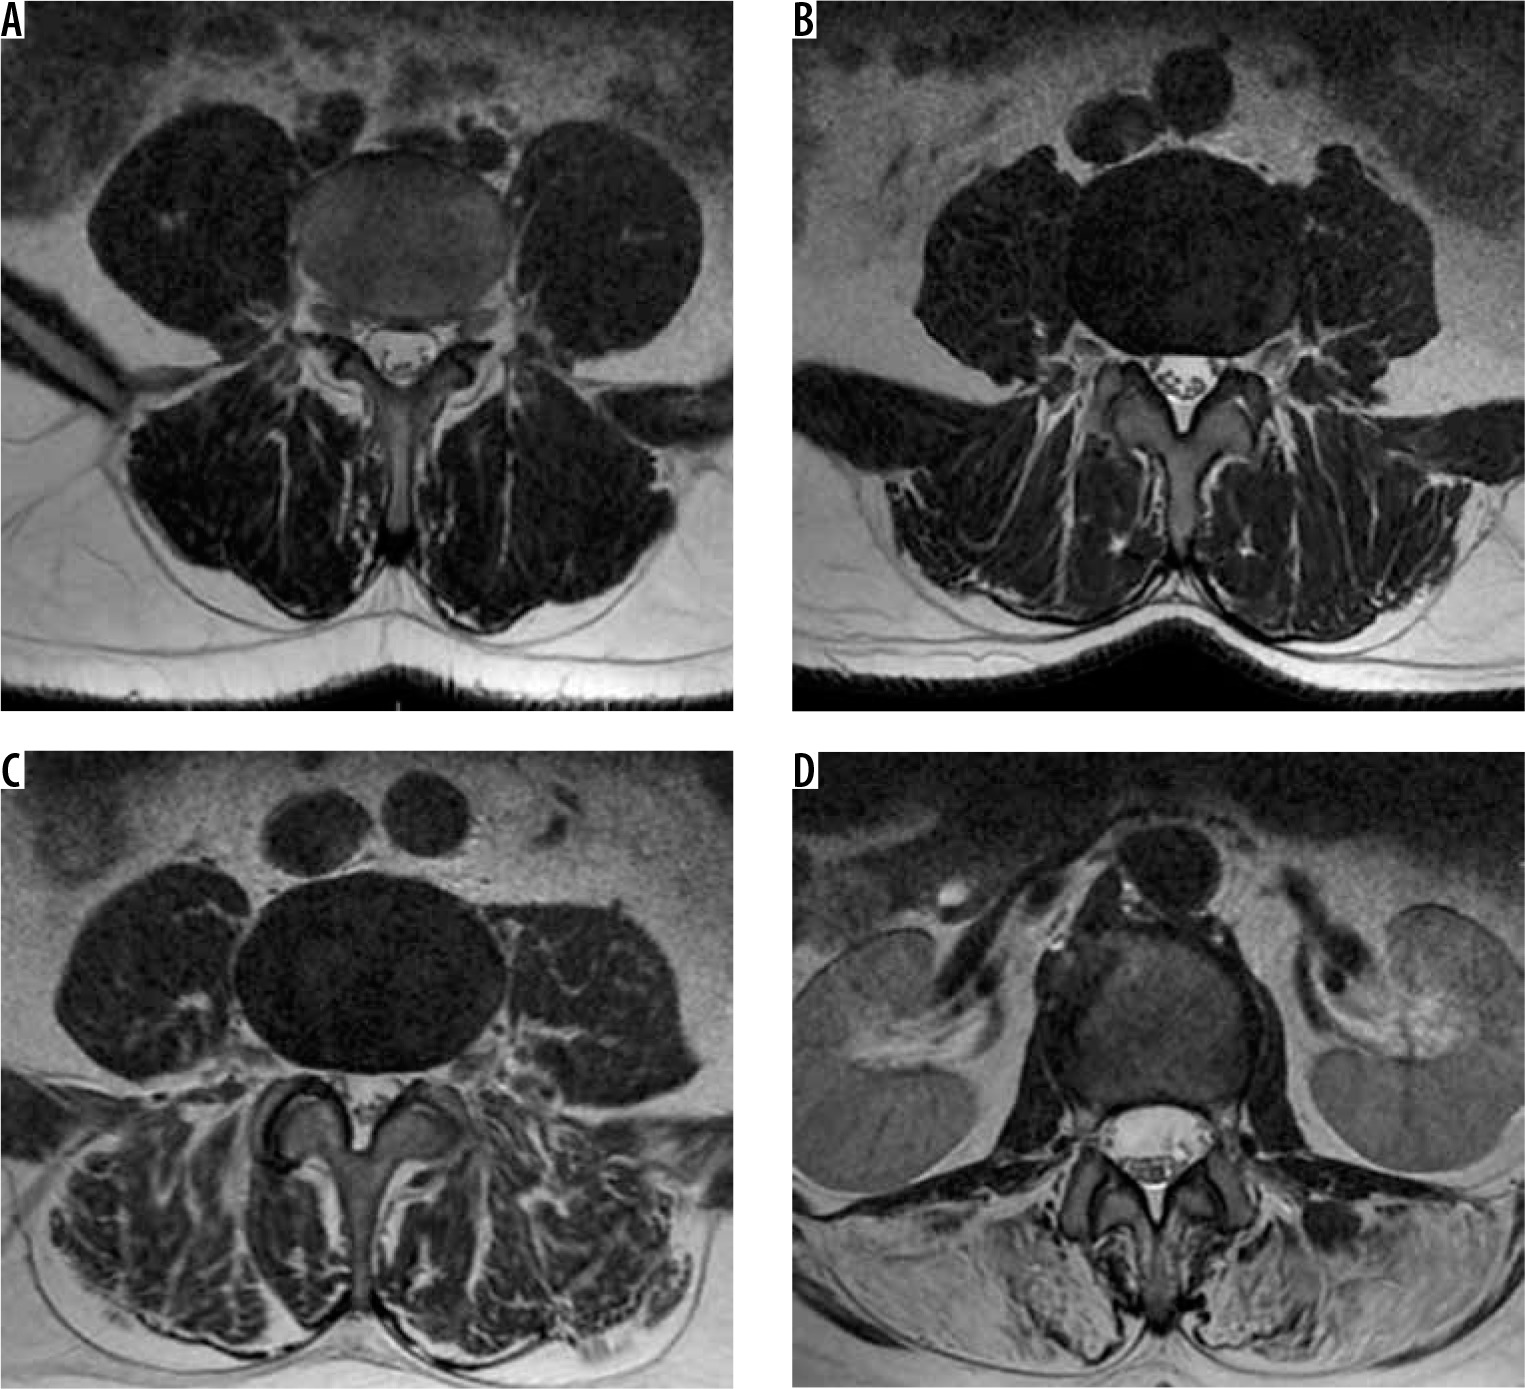
Figure 4
Axial magnetic resonance images show different degrees of fatty degeneration in the paravertebral muscles of the case group. A) stage 0 (normal), B) stage 1, C) stage 2, and D) stage 3 fattening
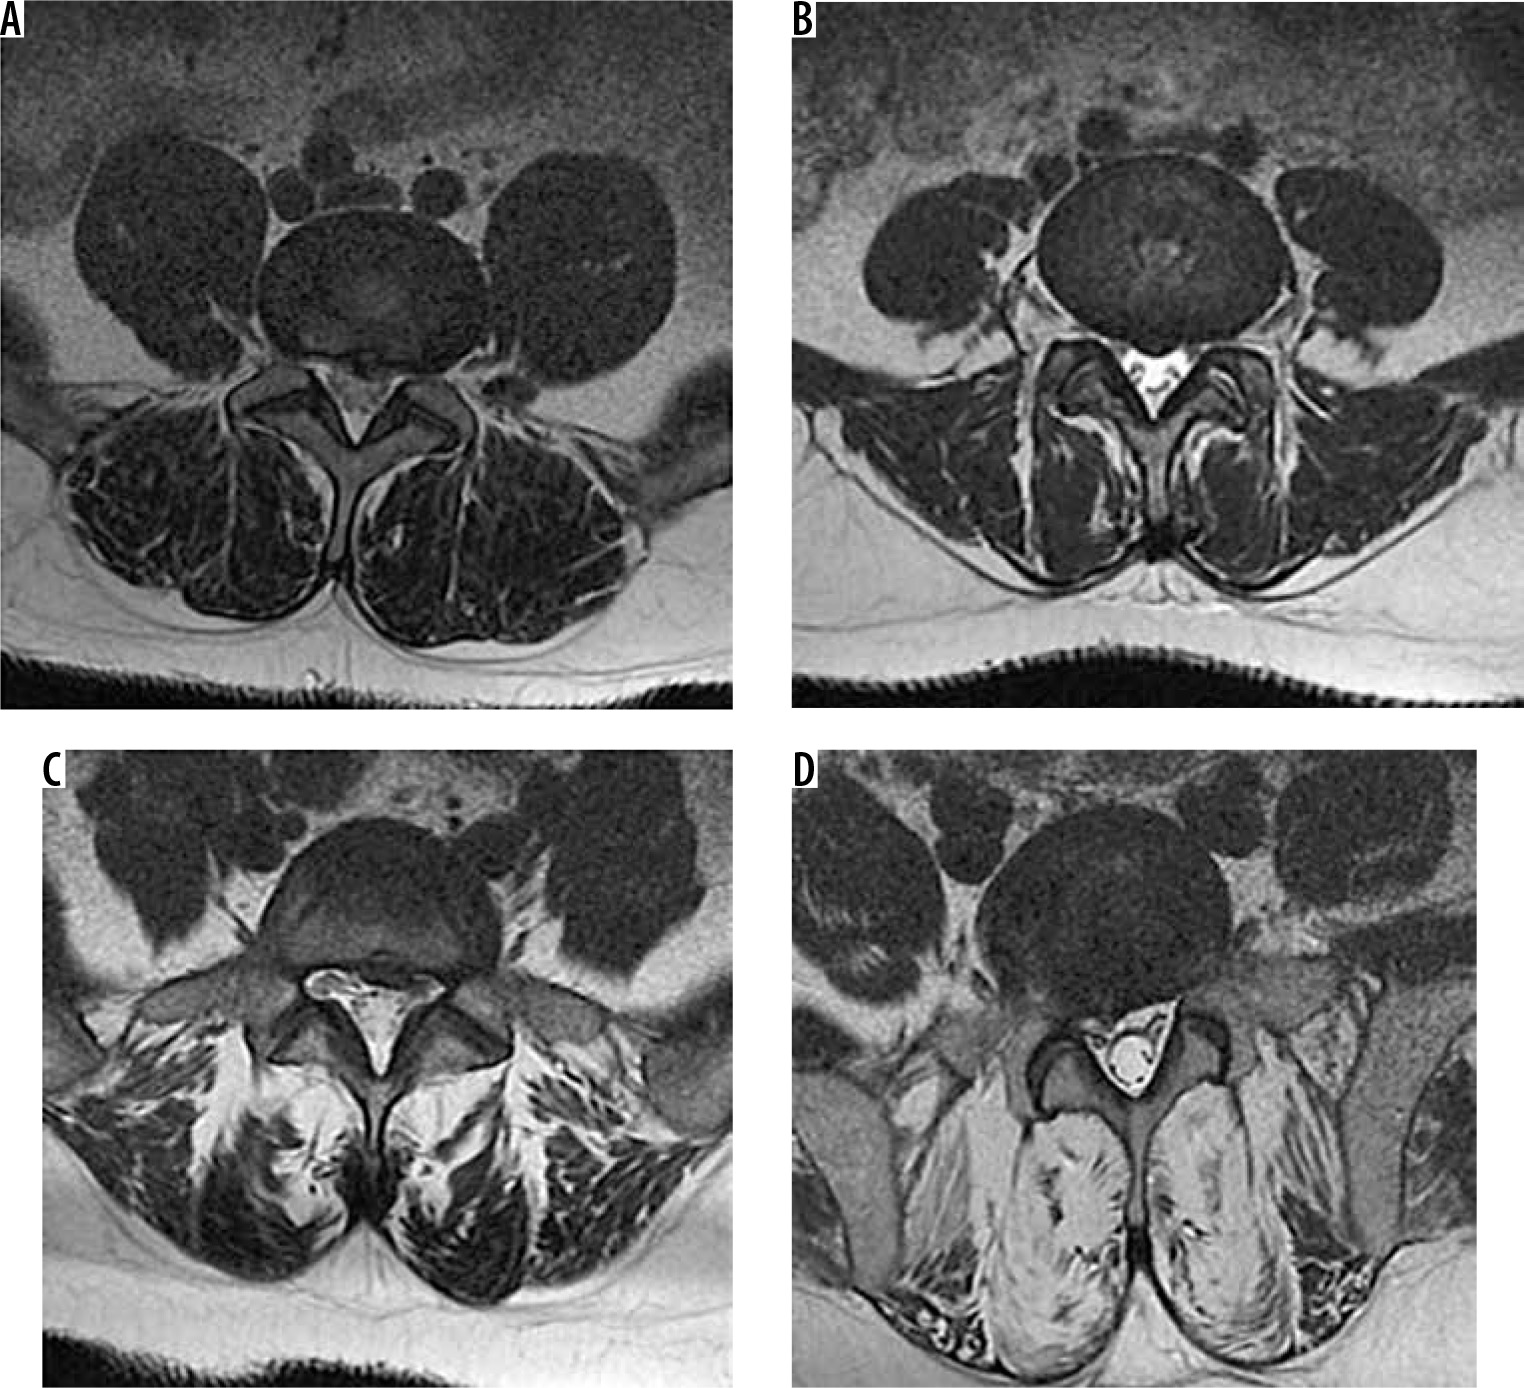
Table 3
Erector spinae and multifidus muscle fatty degeneration in the study group
Erector spinae and multifidus fat deposition was correlated in 155 patients in the case group. Of these, 79 were identified to be normal or have mild fat in both muscle groups. For 76 patients, both muscle groups were identified to have moderate-advanced fat. However, 45 patients with normal or mild fat deposition in the multifidus muscle were identified to have moderate-advanced fat deposition in the erector spinae (p < 0.001) (Table 4). In the control group, fat deposition in the erector spinae and multifidus were correlated in 176 patients. However, 10 patients with moderate-advanced fat deposition in the erector spinae muscle were found to have normal or mild fat deposition in the multifidus muscle (p < 0.001).
Table 4
Fatty degeneration correlation between erector spinae and multifidus muscles in the study group
Discussion
Most adults have LBP in their lifetime. Among the causes of LBP, a broad framework from traumatic events to working conditions, from demographic characteristics to congenital malformations, are observed. LDH is a significant cause of LBP and presents at different levels and morphologies.
In the literature, there are many studies comparing fat deposition in the paravertebral muscles – especially the multifidus – with a variety of pathologic situations such as lumbar lordosis flattening [8-12], LBP [13-17], pain spreading to the leg [18], and disc degeneration [16]. However, it is still not fully clear whether fat deposition in the paravertebral muscles is a result or a cause of these pathologies.
Some studies assessed LBP with fatty degeneration of the multifidus or both the multifidus and erector spinae, and some of them support the association of LBP with fatty degeneration [13-15,19-21]. In our study, we also found that muscle fatty degeneration increased with LBP. A variety of studies have used different methods to assess fat deposition. Methods include MRI spectroscopy (MRS) [15], visual scales on MRI [9,14,16,18,20-22], and MRI histogram [9,19], while for assessment of cross-sectional area, CT [8,23-25], MRI [8-10,16,20,26-31], and US [26,32] are methods used.
Some studies have shown that fat deposition in paravertebral muscles increases with the aging process [14,18,22,24]. In our study, similarly, in both case and control groups patients aged > 40 years were observed to have more fat deposition compared to patients aged < 40 years. Another finding that correlated with the literature [22] is that females were identified to have proportionally more fat deposition compared to males.
As correlated with the literature, in our study, 85% of patients were identified to have hernia at L4-5 and L5-S1 levels, the most mobile segments of the lumbar vertebral column. Additionally, in our study, only 8.3% of patients had hernia in the first three levels, with all these cases being > 40 years of age. The remaining patients had hernia identified at both the first three levels and the last two levels.
The degree of fat deposition in erector spinae and multifidus muscle groups in our study was observed to be similar when case and control groups were compared. This result leads to the consideration that in case and control groups chosen from among patients with LBP, the process causing paravertebral fatty degeneration may not be fully associated with LDH but might be related with LBP.
In our study, we compared LDH patients in the first three levels with the last two levels and found correlation between fat deposition in erector spinae and multifidus. There was no clear correlation between degree of fat deposition in muscles with hernia level. Fat deposition in the erector spinae and multifidus was correlated in the control group. Correlation was also identified between a large proportion of fat deposition in muscles in the case group, while 45 patients (22%) were identified to have more fat in the erector spinae compared to the multifidus. This increase was present for all hernia levels, but it was more pronounced for patients with one or more hernia between L1 and L4. The erector spinae muscle plays an important role in balancing the vertebral column. Atrophy of the paravertebral muscles means reducing support of the basic force-countering loads from outside the vertebral column, produced by the erector spinae muscle group [5] and resulting in increased compression of the passive system [6]. Thus, more fatty deposition in the erector spinae muscle compared to the multifidus leads to the consideration that the erector spinae muscle is more affected by the process related to LDH compared to the multifidus, and that this may cause fat deposition rather than be a result of it.
In the literature we did not come across with any study researching the correlation between erector spinae or longissimus muscles in LDH patients with multifidus. Boyacı et al. [20] assessed two groups of patients with discopathy and non-discopathy LBP in a study and found the fat deposition in the multifidus, paravertebral muscle group (multifidus and erector spinae), quadratus lumborum, and psoas muscles was significantly greater in those with discopathy. However, this study did not separately deal with the erector spinae muscle group. In a study evaluating LBP patients, Ekin et al. [22] identified more hernias at L4-5 and L5-S1 levels in patients with multifidus fatty degeneration compared to patients with none identified. However, this study did not examine erector spinae fat degeneration or whether hernia occurred in patients with and without fat deposition, only that fatty degeneration occurred in hernia patients. Mengiardi et al., in a study assessing fat deposition in the multifidus and longissimus muscles in patients with LBP and those who were asymptomatic [15], found more fat deposition in the multifidus in patients with LBP. However, there was no clear difference identified for the longissimus muscle group. Ploumis et al. [30] compared erector spinae, multifidus, quadratus lumborum, and psoas muscles on symptomatic and asymptomatic sides in patients with disc pathology accompanied by unilateral LBP. They reported that muscles on the symptomatic side had smaller area compared to those on the asymptomatic side. Another similar study by Hyun et al. [31] showed that the multifidus muscle had smaller area on the symptomatic side of patients with unilateral radiculopathy symptoms and accompanying disc hernia. However, this study did not assess the erector spinae.
In the literature there are also studies about patients with LBP and paravertebral muscle fattening being treated with exercise plans. These studies showed that patients with exercise programs for the paravertebral muscles had reduced pain severity and incidence [19,33-36], reduced fat deposition [19], and increased functional capacity [19,35,36]. A similar study [37] identified increased muscle strength after an exercise program for patients with chronic LBP. Another study of patients with LDH [34] reported that exercise treatment caused a reduction in the dimensions of the herniated disc. Considering studies about the importance of exercise and LBP, inclusion of patients in strengthening exercise programs for the multifidus and erector spinae will clearly reduce pressure on the vertebral column and hence trauma. Application of exercises programs for LDH patients will prevent progression of hernia and symptoms and may even ensure amelioration.
There are some limitations in this study. First, we do not know patient BMI values because of the retrospective scanning. However, we think that apart from body fat composition, factors like hypokinesia due to hospitalisation, etc. or psychologic factors like depression could play a role in muscle fat replacement. Also, we do not have enough data about patients’ detailed clinical findings, only what was included in records on the hospital automation system, so we could not compare them with our results. Therefore, we have no data about reflection of this fatty degeneration, separate from the muscle groups, in clinical findings. We think further research will be more useful to evaluate the clinical findings comparing fatty degeneration changes in erector spinae and multifidus with prospective studies.
Conclusions
In our study we investigated fat deposition in erector spinae and multifidus muscles on MR images, in patients with LBP, comprising a case group with LDH and a control group without. The case group was identified to have more fat deposition in the erector spinae compared to the multifidus, and this finding was more pronounced for patients with hernia in levels L1-4. We think it is necessary to support this result of fat deposition observed in the erector spinae group with other studies dealing with exercise programs. The other thing is that for the patient selection, it is known that paravertebral muscle atrophy is more common in women, and its prevalence increases with age, especially after 40 years. It would be better to evaluate the relationship between LDH and muscle atrophy with patients under the age of 40 years; hence, similar studies with patients younger than 40 years would be better to differentiate muscle atrophy priority.
Another conclusion we reached in our study is that the detailed description of muscle fatty degeneration and grading in radiology reports will benefit planning of physical therapy programs for LDH patients, which will then shorten the rehabilitation process. Additionally, this detail can be used in follow-up exams and MR scans to monitor treatment response.