


Introduction
Haemangiomas of the vertebra are the most common benign tumours of the vertebra bodies; they are usually asymptomatic lesions and are unintentionally diagnosed amid imaging performed for other purposes [1]. Haemangiomas can be diagnosed by various imaging modalities, including plain radiographs and computed tomography (CT) scans. Axial CT scans can show the characteristic polka-dotted appearance, which is a series of thickened vertebral trabeculae [2]. Another imaging modality used is magnetic resonance imaging. Haemangiomas are shown as hyper-intense lesions in T1 and T2 sequences [3]. This is because of the high fat and water content of haemangiomas. These characteristic findings in magnetic resonance (MR) imaging and CT scan help differentiate haemangiomas from malignant lesions, including primary malignant lesions arising in the vertebra, infiltrative malignant lesions such as multiple myeloma, and more commonly distant metastasis [4,5]. Atypical haemangiomas are a group of haemangiomas with atypical histological characteristics. These lesions do not contain the high fat content of normal haemangiomas, and they have a rich vascular structure [6]. Although atypical haemangiomas are usually symptom free and less common than the typical kind, they are of clinical importance because they can be mistaken for malignant lesions in imaging modalities – this is because they are hypo intense in T1 sequences and hyper intense in T2, resembling metastasis [7]. Histopathologically, atypical haemangiomas do not resemble metastases, which comprise dense bodies of tightly packed small malignant cells. Atypical haemangiomas are made up of vascular spaces, with great intercellular distances. Scholars have suggested that diffusion-weighted imaging (DWI) may be beneficial in differentiating these lesions [8]. DWI relies on the ability of water molecules to have random movement in an acellular structure, thus enabling it to detect limited or increased diffusion of water molecules [9]. Previous studies have been able to show that malignant lesions do in fact have characteristic diffusion profiles and significantly altered apparent diffusion coefficient (ADC) values compared to normal tissue and benign lesions [10]. However, there is little evidence available regarding the efficacy of DW-MRI in differentiating haemangiomas, especially atypical vertebral haemangiomas, from distant metastasis of the vertebra. In this study, we aim to compare ADC values of atypical haemangiomas and metastasis of the vertebra in specific β values, and to analyse whether there are significant differences between the two.
Material and methods
Patients
In the present cross-sectional study, subjects being referred to a tertiary medical educational centre between April 2016 and June 2019 were included. Subjects being included either had an atypical haemangioma or a metastasis in the vertebra, or any other malignant lesion in the vertebra. Inclusion criteria consisted of having an atypical haemangioma in the vertebra, diagnosed by documenting the polka-dot sign or corduroy sign in CT imaging; having a metastatic lesion in the vertebra, which was defined by either a biopsy, positive radio-nucleotide scan, or pet scan; having a hypointense or isointense lesion in T1 sequence; and being hyper intense in T2 sequences. Exclusion criteria consisted of patients having any sort of contraindication for MRI and lack of will to participate in the study.
Magnetic resonance imaging
All patients underwent imaging using a single machine (Avanto, 1.5 Tesla, Siemens-Erlangen, Germany). Imaging was done in supine position, with hands held still alongside the body. Imaging was performed in T1, T2, and DW sequences. Occasionally, other sequences were also investigated. T1 imaging was done according to the following specifications: sagittal plane, FOV = 315 mm, TR = 762 ms, TE = 11 ms, slice thickness = 4.5 mm, and T2 imaging was performed according to the following specifications: TR = 3723 ms, TE = 107 ms, FOV = 315 mm, slice thickness = 4.5 mm. DW imaging was performed in axial and sagittal planes, using the spin-echo single-shot echo-planar technique. Imaging was done in β values of 50 and 400, using fat-suppression. Imaging was done using the following specifications: TR = 25 ms, TE = 7 ms, FOV = 400 mm, slice thickness = 7 mm.
Image interpretation
The imaging was performed by a single team of radiologists using a single MRI machine. A single team of expert radiologists were responsible for reporting imaging findings. The radiologists were not aware of the pathology reports of lesions, or any link to the final diagnosis.
Regions of interest (ROIs) for quantification of the witnessed values were defined manually using T1WI in- and out-phase images, with and without fat suppression (once in T1) and DW images. A ROI in a non-pathologic vertebral bone marrow was also drawn manually, covering at least 50% of the area. Whole vertebral body was assessed in a similar manner. In pathologic lesions, All ROIs were selected from the central segments of lesions in the above sequence images (at least two thirds were covered). The size of the ROI changed based on lesion size, but most of the measurements were made by a region with a size of 0.5 cm2. To ensure the consistency, all measurements were performed three times with consistent size of ROI at different image levels, and average values were calculated.
Statistical analysis
Statistical analysis was done using SPSS version 24. Non-parametric tests, including Mann-Whitney test and two-sample Kolmogorov-Smirnov test, were used for comparing the mean ADC values between atypical haemangiomas and metastasis. Unpaired two-tailed Student’s t-test was also used in this regard. The sensitivities and specificities of the quantitative parameters for the detection of spinal metastases to be differentiated from haemangiomas was recorded and a receptor operative curve was drawn.
Results
In total, 23 patients were enrolled in the study, with 10 of them having atypical vertebral haemangiomas and 13 having vertebral metastasis or other malignant lesions. In total, 17 patients were male and six were female. The mean age of patients was 53.39 ± 3.17 years with a minimum of 27 and maximum of 78 years. The mean age of patients with atypical haemangiomas was 51.18 ± 4.16 years, and it was 54.62 ± 4.72 years for the metastasis group. The difference between the two groups was not significant. From the 13 patients with malignant metastasis, seven had multiple myeloma, two had lung cancer, one patient had renal carcinoma, one had lymphoma, one had prostate cancer, and one had a metastasis from a germ cell tumour. Figures 1-3 show imaging findings of some of the patients included in the study.
Figure 1
Atypical haemangioma in a 69-year-old woman. A) The characteristic polka-dot sign. B-C) The T1 and T2 sequences, respectively. The haemangioma is hypointense in T1- and hyperintense in T2-weighted images. D-F) Diffusion-weighted imaging in b values of 50, 400, and the apparent diffusion coefficient (ADC) map. The ADC of the lesion equals 1892 × 10-6 mm2/s

Figure 2
Focal multiple myeloma in a 47-year-old patient. A-C) Depict T1, T2, and TRIM sequences. D-F) Diffusion-weighted imaging in b values of 50, 400, and the apparent diffusion coefficient (ADC) map. The ADC value of the lesion equalled 1850 × 10-6 mm2/s

Figure 3
A metastasis, originating from renal cell carcinoma in a 46-year-old male. A-C) Show T1, T2, and TRIM sequences, respectively. D-E) Axial diffusion-weighted imaging cuts in b values of 50 and 400. F) The apparent diffusion coefficient (ADC) map of the lesion. The ADC value of the lesion equaled 900 × 10-6 mm2/s

The mean ± standard deviation ADC value for patients with atypical haemangioma was 1884 ± 74 × 10-6 mm2/s, and it was 1008 ± 81 × 10-6 mm2/s for the patients with malignant lesions. The difference between the two groups was statistically significant (p < 10-3). The maximum and minimum ADC values recorded in the atypical haemangioma group were 2280 and 1600 (× 10-6 mm2/s), respectively, while they were 1850 and 680 (× 10-6 mm2/s) for the group with malignant lesions, respectively. The highest ADC value recorded in the malignant group belonged to a focal multiple myeloma. Figure 4 depicts the plots and whisker diagram of the two groups. Receiver operating characteristic analysis was done to determine an ADC value cut-off to differentiate atypical haemangiomas from metastasis. Figure 5 depicts the ROS curve generated. The cut-off value was set at 958 × 10-6 mm2/s. Figure 6 is a schematic presentation of imaging findings, and Figure 7. is a presentation of how the ROI was applied in ADC maps.
Figure 4
Plots and Wiggers diagram of the mean apparent diffusion coefficient (ADC) values of atypical haemangiomas and malignant lesions


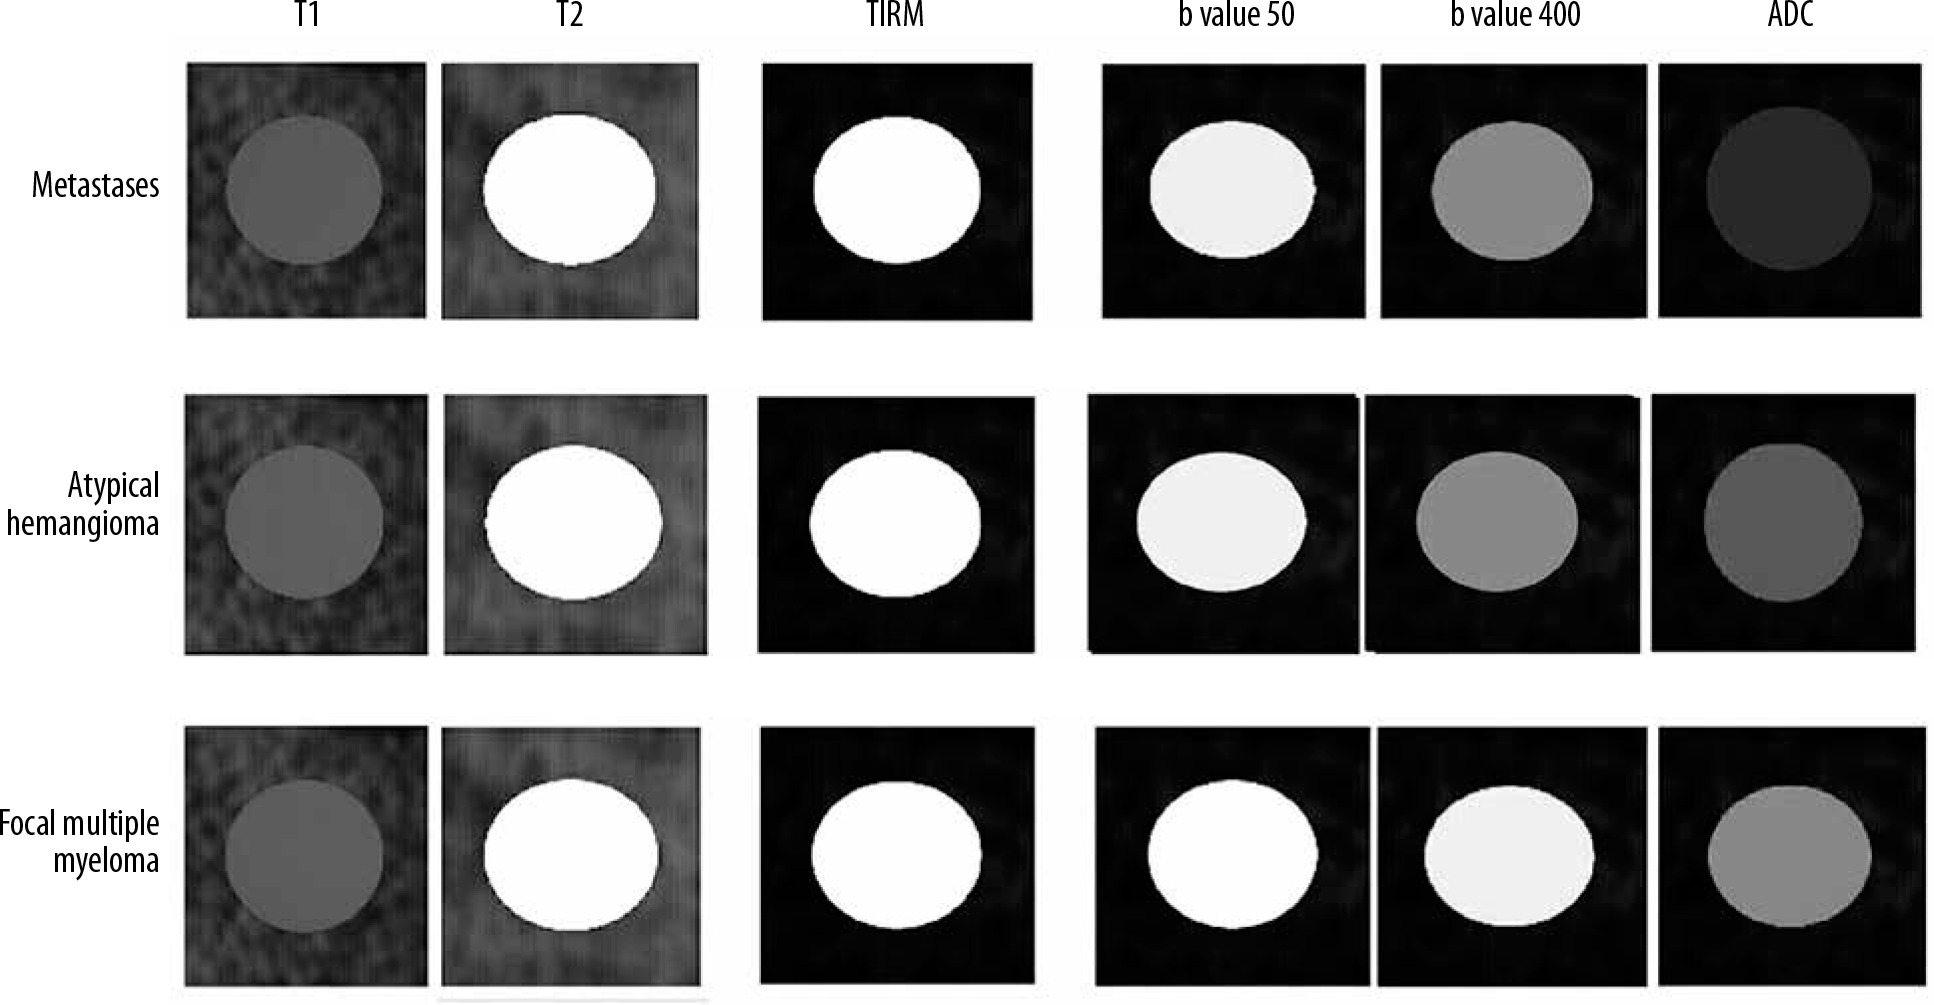
Figure 7
Apparent diffusion coefficient (ADC) map of various lesions showing how ADC values were defined for any given lesion. Measurements were made manually and for each lesion. Three separate measurements were made for each lesion, and the region of interest covered at least 50-75% of each lesion. Most measurements were made with an area of 0.5 cm2

Discussion
In the present study it was shown that atypical haemangiomas had a significantly higher mean ADC value compared to malignant metastatic lesions. The mean ± standard deviation of ADC values for atypical haemangiomas was 1888 ± 74 (× 10-6 mm2/s), while it was 1008 ± 81 (× 10-6 mm2/s) for metastatic lesions. Importantly, there was little overlap between ADC values, and the minimum ADC value of atypical haemangiomas was higher than that of almost all malignant lesions. ROC curve analysis determined 958 × 10-6 mm2/s as the cut-off value to differentiate malignant lesions from benign ones.
MRI has long been used in imaging of the central nervous system, especially the spine and its adjacent structures. Haemangiomas are common findings in autopsies (up to 10% of cases) and are easily detected using CT scans and MRIs. Atypical haemangiomas, however, are harder to diagnose because they resemble malignant lesions on conventional T1 and T2 sequences. Based on previous experience on differentiating benign from malignant lesions of the spine using DW-MRI, scholars have suggested that the same principles could be used to differentiate metastatic lesions from atypical haemangiomas. A systemic review performed by Luo et al. investigated whether vertebral fractures occurring due to malignant lesions had significantly different ADC values compared to those resulting because of benign lesions. They included 12 studies with a total of 350 malignant lesions and 312 benign lesions and found that the difference between the mean ADC value between the two groups was statistically significant. They also suggested that low β values (less than 500 s mm-2) were able to better differentiate these lesions from each other [11]. This article and similar ones were the reason for our choice of β values.
Koutoulidis et al. investigated whether DW imaging could be used in the detection of multiple myeloma, and whether it could be used to differentiate focal and diffuse multiple myeloma. They found that the mean ADC values of normal vertebra, and vertebrae effected by focal and diffuse multiple myeloma, were significantly different (0.360 × 10⁻³ mm2/s ± 0.110, 1.046 × 10⁻³ mm2/s ± 0.232, and 0.770 × 10⁻³ mm2/s ± 0.135, respectively) [12]. The findings of this study are in agreement with our observations, excluding the fact that the observed focal multiple myeloma in our study had a high ADC value compared to other malignant lesions, and even compared to the lesions studied by Koutoulidis et al.
Of note, usage of MRI may be indicated even more than previously expected in the diagnosis of atypical haemangiomas and their differentiation from multiple myelomas and metastasis, because studies have shown vertebral haemangiomas with positive PET scan results, making them a diagnostic challenge [13,14]. Interestingly, it seems that adverse clinical characteristics of haemangiomas may be related with their resemblance to malignant lesions in biomedical imaging, especially PET scans [15].
An early observation in this regard was made by Taşkin et al. They used DW-MRI to determine the ADC values of lesions found in 99 subjects. A total of 133 lesions were included, of which nine where atypical haemangiomas with a mean ADC value of 1.80 ± 0.37 (× 10–3 mm2/s), 57 were metastasis with a mean ADC value of 0.77 ± 0.30 (× 10–3 mm2/s), and 17 were malignant compression fractures with a mean ADC value of 0.94 ± 0.34 (× 10–3 mm2/s). The difference between the ADC values of malignant and benign lesions was statistically significant [16]. Similar results were also found by Shi et al., who compared the ADC values of atypical haemangiomas, typical haemangiomas, and metastasis [17].
Matrawy et al. studied the efficacy of DW-MRI in differentiating atypical haemangiomas from metastases, and also included typical haemangiomas in the study, as a separate group. A total of 24 patients were included: eight with metastasis, six with atypical haemangiomas, and 10 with typical haemangiomas. The mean ADC value for haemangiomas (including both kinds) was 1.54 × 10⁻³ mm2/s, and the mean ADC value of metastatic lesions was 0.83 × 10⁻³ mm2/s, with the difference being significant statistically. A threshold of 0.96 × 10⁻³ mm2/s was suggested as being able to differentiate haemangiomas from malignant lesions [18]. The results of this study were in concordance with ours – we also found an identical cut-off point for differentiating different lesions. They found that atypical haemangiomas had a significantly higher mean ADC values compared to metastasis and had relatively high values compared to typical haemangiomas, although the mean was not significantly different between the two groups. Of note, a considerable overlap existed between the ADC values recorded for metastasis and atypical haemangiomas – a finding which is in contrast to ours.
In all of the previously mentioned studies, the number of patients with atypical haemangiomas ranged between 20 and 50 – a relatively small number with which to draw generalisable conclusions. We also faced the same limitation. Also, a limited number of metastatic lesions from limited types of tumours were involved, so our results may not be generalisable for making judgments regarding differentiation of atypical haemangiomas from certain types of malignancy or metastasis. This limitation was also seen in previous studies. More comprehensive multi-centre studies are needed to understand the exact benefit of DW imaging in differentiating atypical haemangiomas.
Conclusions
In the present cross-sectional study, we aimed to compare the mean ADC values for atypical haemangiomas and metastatic lesion in the vertebra. These lesions are nearly identical in T1 and T2 sequences and, if applicable, DW imaging may be of great benefit in differentiating these lesions. The mean ADC value for atypical haemangiomas was 1888 ± 74 (× 10-6 mm2/s), and the mean for metastatic lesions was 1008 ± 81 (× 10-6 mm2/s), with the difference being statistically significant. ROC curve analysis revealed that an ADC value of 958 × 10-6 mm2/s could differentiate benign lesions from metastatic ones. Considering the limitations of this study, the findings show that DW imaging could be useful in differentiating atypical haemangiomas from metastatic lesions.