


Introduction
Pneumonia is a kind of respiratory infection caused by bacteria, viruses, or fungi in lungs, with symptoms ranging from mild to severe including fever, nausea, phlegm, cough, and chest pain [1]. Pneumonia is viewed as a se-rious illness, especially against children less than 5 years old. The World Health Organization (WHO) affirms that pneumonia caused the deaths of more than 800,000 children in 2017 and in 2018, a child’s death occurs every 39 seconds. It is estimated that 11 million children will die from pneumonia by 2030. South Asia has the highest number of deaths, where India recording more than 158,176 deaths in 2016 and 808,694 in 2018 [2]. For this reason, early diagnosis seems vital for ensuring effective care and increasing survival rates.
Bacterial pneumonia is a kind of pneumonia infection caused by various external factors such as inadequate nutrition, old age, excessive coldness, or complications of various other viruses such as seasonal influenza or COVID-19. First aid consists of antibiotics; however, supportive care is required for viral pneumonia [3,4].
Pneumonia is detected by a blood or sputum analysis, but in practice, tests based on imaging interpretation are the most requested [5]. They comprise computed tomography of the lungs (CT), ultrasound, magnetic resonance imaging (MRI), and X-ray of the chest (CXR). The CXR are images produced by X-ray beams after passing through the human body; the light areas within image show parts of dense tissue, while the dark areas denote regions with less compact tissue. Despite such interpretation, many factors influence the identification of an ano-maly in a given tissue, if one exists. Hence, misinterpretations occur in regions of superimposed structure when using inappropriate materiel or a bad viewing angle, or due to patient motion during exposure to X-rays. Furthermore, pneumonia symptoms share similar features with other chest diseases, leading to problems with image interpretation.
Given the significant differences in specialists’ opinions in image interpretation, which decreases its professional acceptability area limits, it seems essential to alternate toward automatic solutions avoiding human errors and helping radiologists to diagnose patients more accurately. Within this context, various studies have been carried out, including some that utilised deep learning models (DL) for pneumonia detection and classification, which is still the most effective and extensively used method for diagnosing diseases in general, and radiology specifically. DL often refers to Artificial Neural Networks (ANNs), which consist of a set of algorithms inspired by the human brain system. They are based on a learning concept that enriches a knowledge database with the environment experience acquired through execution. Among the best-known ANNs architectures are the Convolutional Neural Networks (CNN); they outperform human capabilities in some visual recognition tasks, and this potential is applied in medicine to detect and classify diseases. It leads to accurate interpretation of pathologies and enhances the quality of the healthcare system [6].
In this paper, we present a comparative study of detection and classification of pneumonia disease using CXR radiography. The image processing is performed by a CNN model for extracting X-ray image features and the XGboost tool for classification. The objective of the work is to emphasize the distinction between CXRs of healthy bodies and those with viral or bacterial pneumonia. The experimental process would ensure an effective diagnosis of patients and help doctors to proceed to the appropriate treatment.
The paper is organized as follows: after a brief introduction in section 1, an overview of related works is highlighted in section 2; the proposed approach is described in section 3; and section 4 comprises further details of the approach and a detailed experimental study. The conclusion of the work and future prospects are presented in section 4.
Related works
The use of CNN for pneumonia detection has been the subject of various studies in recent years, due to its ability to solve complicated problems. In [5] the authors developed a cheXNet model based on a pretrained CNN; this model was performed using CXR images extracted from a dataset of various lung pathologies [7]. The model achieved an acceptable performance of about 76.8% regarding the area under the receiver operating characteristic (AUCROC) for the case of pneumonia. Jiang et al. [8] used variants of pretrained CNNs for pneumonia detection; the trained process is accomplished by freezing the bottom layers and fine tuning the top layers. The accuracy reaches 94.2%. Also, in [9], Kermany et al. applied transfer learning to train a CNN model in order to differentiate between normal, viral, or bacterial pneumonia CXR images using a binary classification, and the experimental results reached an accuracy of 92.8%. An approximately similar result is obtained by a shallow CNN model proposed by [10]. In [11], the authors proposed a computer-aided diagnosis (CAD) system to detect pneumonia using 3 classification methodologies including a hybrid CNN (VGG-16 and VGG-19); the system offered an accuracy of 98%. In [12], the authors proposed a DL model to detect and localize abnormalities in the CXR images, the related algorithm is based on 3 classifier options and 4 model detectors using the VinDr-CXR dataset, which is augmented with Albumentations [13] in order to solve the class imbalance; the model’s performance measured approximately 29% in terms of mean average precision (MAP). Likewise, in [14] the authors proposed a set of 2 CNN models: Mask R-CNN and RetinaNet, for the prediction and localization of pneumonia in small areas of CXR images. The model was tested on a database from Kaggle pneumonia challenge [15], and it achieved a recall of 79.3%. In [16], the authors developed a deep learning model for classification of CXR images into consolidation (alveolar pneumonia) and non-consolidation. The system allows visualization of areas of interest (AOI), which is used to obtain the outcome, and it achieved a result of 92% in terms of AUC. In [17], the authors proposed an approach of CNN with 3 different optimizers (Adam, SGD, and RMSProp). Hidden layers from 1 to 5 were used in the design of the CNN models and trained without any transfer learning technique. As a result, they found that CNN with 4 hidden layers and SGD achieved the highest test accuracy of 91%. In [18], the authors proposed a fine-tuned pre-trained deep CNN to classify CXR images of various pneumonia diseases. The experimental results showed 93.3% overall performance in terms of accuracy.
In terms of analysis, the presented approaches showed an overall effective performance, whereas the majority have been addressed in the CXR images to only predict the presence of pneumonia without considering its nature (viral or bacterial). Also, these works used various databases such as ChexPert [19], Chest x-ray14 [7], RSNA [15], etc. which include samples with just ‘pneumonia’ and ‘normal’ labels, which cannot rend more details about the infection type. To the best of our knowledge, the only dataset with ‘normal’, ‘viral’, and ‘bacterial’ labels can be found at the Guangzhou Women and Children’s Medical Centre dataset [20], which is mostly considered for binary classification [21]. We notice also that fewer studies have addressed the multi-class classification of pneumonia disease; this is due to the complexity of the task in terms of processing time. In [5], the authors extended the cheXNet model for the detection of all diseases available in the related dataset. The model’s performance varies between 73% and 93% based on the F1-score metric, which depends on the disease. In [22], the authors used a customized VGG-16 and achieved an accuracy of 91.8%, and in [23], the authors applied a multi-classification to distinguish between ‘COVID-19’, ‘viral pneumonia’, and ‘normal’ using a wide number of samples in which the experiment results reached an accuracy of 98%. In [24], the authors trained a CNN and proved that the accuracy of the model is inversely proportional to the number of classes in the output layer.
Proposed model
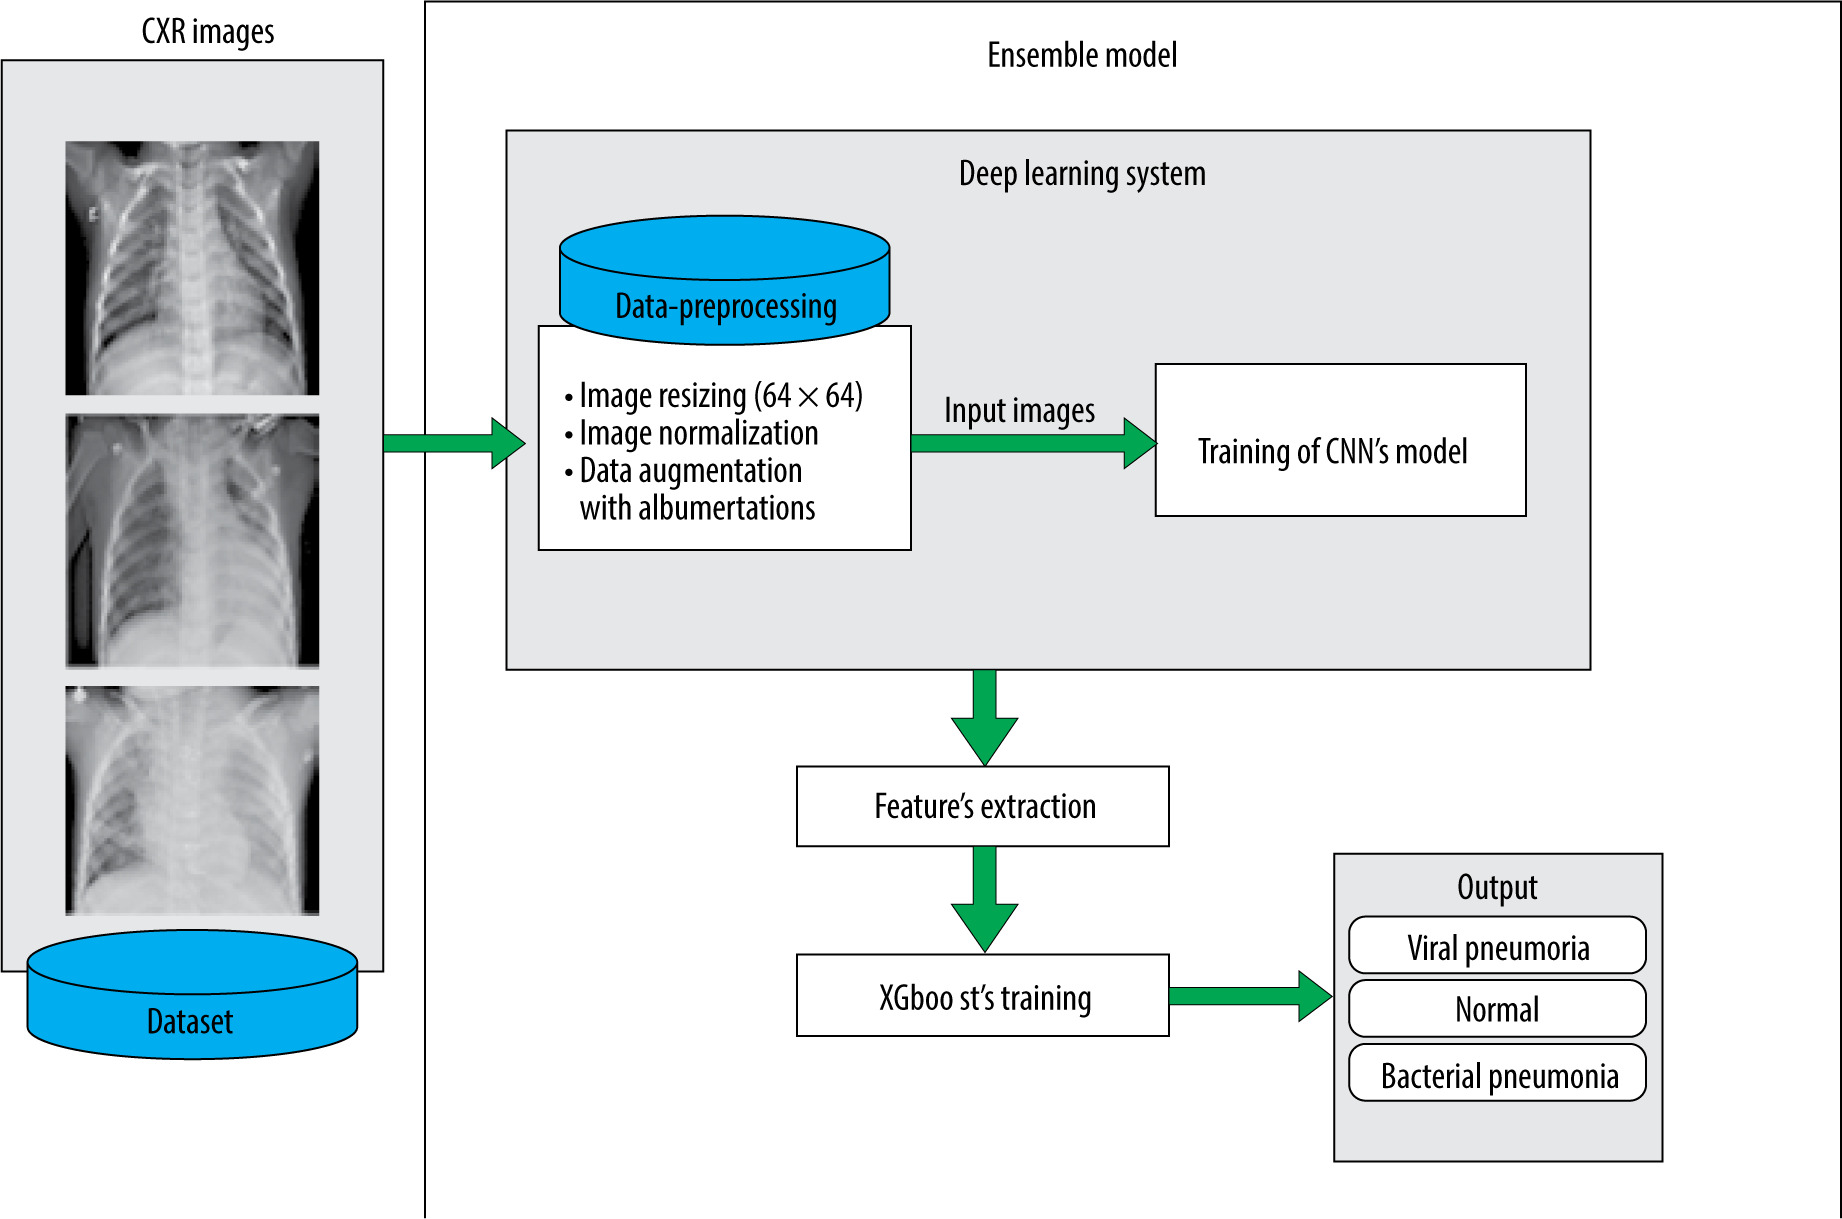
A CXR image of an infected person is characterized by the presence of white hazy patches. Significant fluid in the lungs denotes bacterial pneumonia. Such anomalies are, in both cases (bacterial and viral), observable as white spots, but without enough precision about the infection nature, which makes prediction more difficult. The proposed model allows us to deal with this issue. It consists of a diagnosis and classification of CXR images using the power of CNNs in feature extraction and the XGboost ability for classification. CNNs are renowned for their ability to handling unseen data based on their hierarchical feature extraction process. XGboost can improve the predictions given by CNN, and the model’s generalization abilities are improved by this combination.
Convolutional neural network
CNNs are a type of deep neural network that can be used in situations involving large numbers of unprocessed data. Based on its capability to extract features automatically, CNN is viewed as a powerful tool in the computer vision field. It uses images as input data and considers just local regions instead of the whole image area. This reduces widely the number of parameters and processing time. CNNs are built based on 3 types of layer: (a) convolutional layers, which allow extraction of the input image features (lines, edges, etc.), (b) the pooling layers, which decreases the input map’s dimensionality and retrains only important information, and (c) the fully connected layers that unroll all the values into a single vector in order, leading to the final classification decision.
XGboost
Extreme Gradient Boosting (XGboost) is a machine learning technique that can resolve problems involving classification or regression predictive modelling. It was developed by T. Chen and C. Guestrin [25] for accurate implementation of gradient boosting [26]. It also employs sequentially constructed shallow decision trees to provide reliable results and a scalable training strategy that prevents overfitting.
The idea of boosting consists of generating a strong model by combining a number of weak models. The success of boosting algorithms in general is due to their capacity to handle model and variable selection during the fitting process. When compared to other gradient boosting implementations, XGboost is typically faster [27], and it enables column parallelism at several levels leading the distribution of workload among various CPU cores or threads.
Dataset
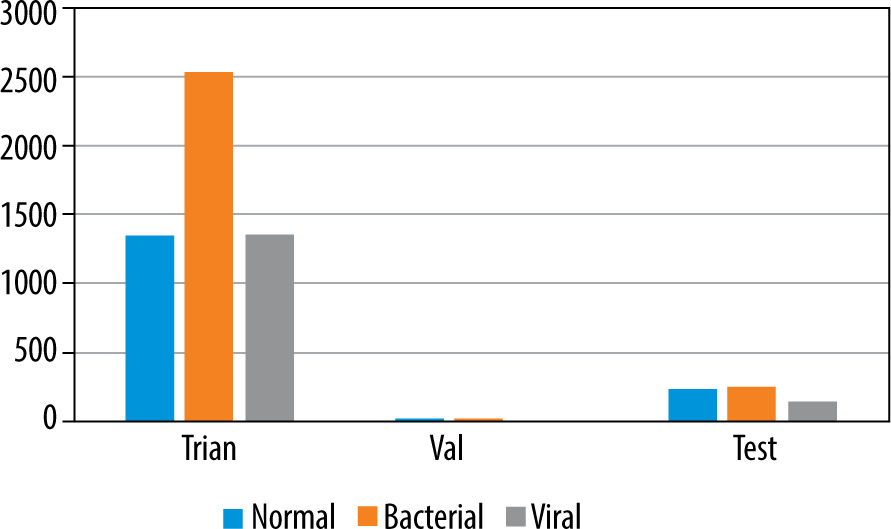
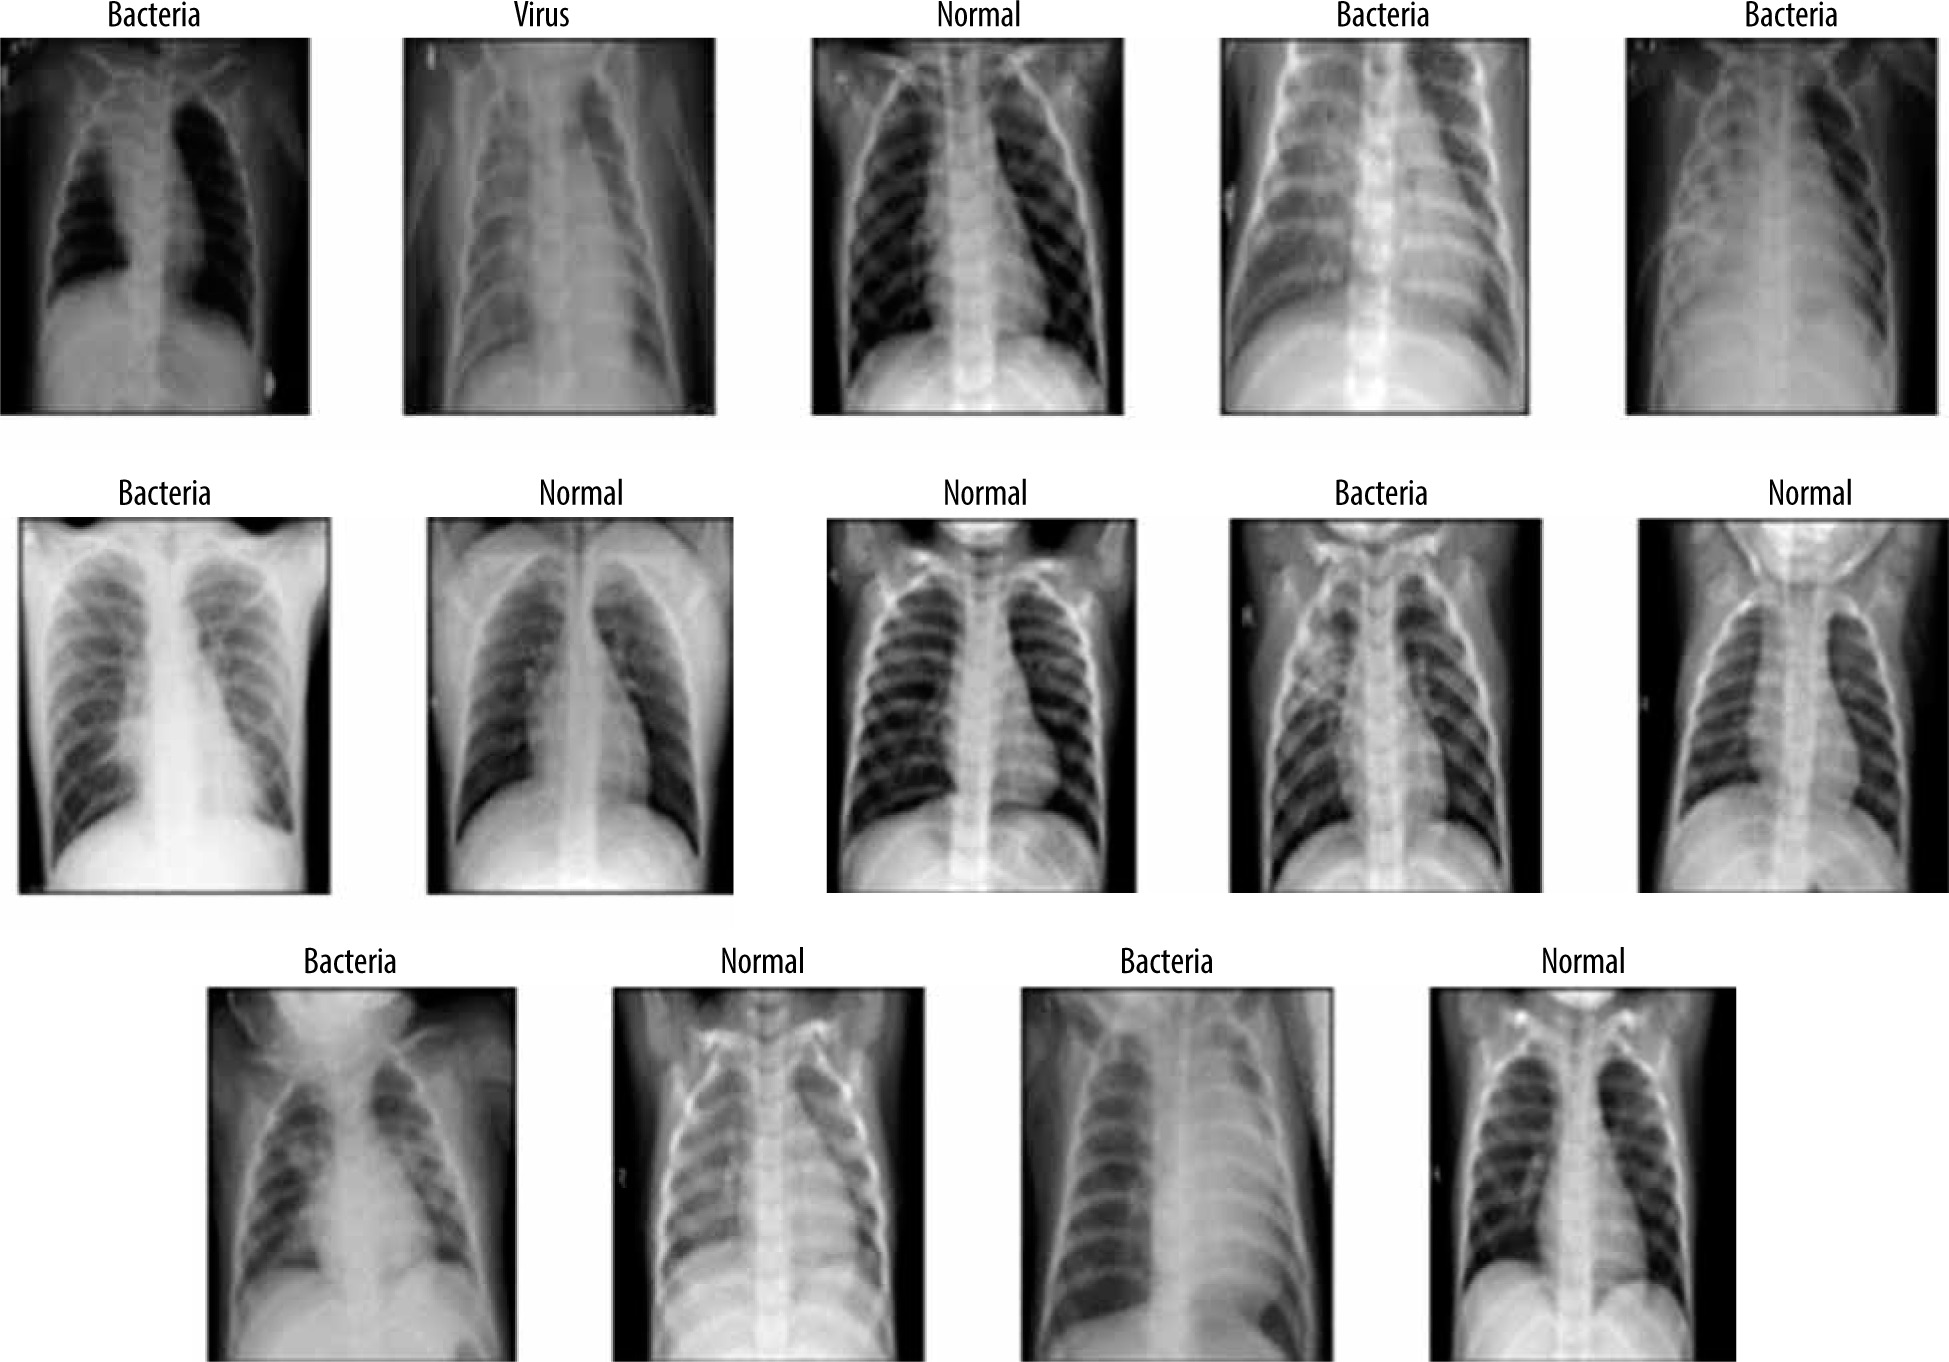
To deal with the classification, we used the dataset proposed by [9], available at [20]. It is built based on 3 folders (Train, Val, and Test); each one involves 2 subfolders (Pneumonia and Normal). The dataset encloses 5863 images of paediatric patients in the age range 1–5 years old, obtained from Guangzhou Women’s and Children’s Medical Centre. The distribution of images is shown in Figure 1. Initially, all CXR images were pretreated by removing low quality or unreadable scans to ensure a suitable control quality. Then, they were arranged and labelled for training process (Figure 2) by 2 expert physicians before being used to train the AI system.
Data preprocessing and augmentation
It is evident that the power of CNN depends on the data-set size and its content quality. In another way, it seems difficult to acquire or to share an appropriate dataset in the medical field regarding ownership rights of such resources. For this reason, the proposed model makes use of data augmentation techniques to increase the volume of data. This is accomplished by managing the imbalance of data, hence reducing the overfitting. Unlike classic augmentation approaches, which are limited to simple geometric transformations, we used the Albumentations tool, which allows image transformation operations [28].
Using this tool, a operations transform pipeline was applied: horizontal flip, random degree rotation, and random Gaussian noise (Figure 3). The first and second ope-rations introduce a major transformation while keeping the underlying data that does not impair the diagnosis and ana-lysis, allowing the model to generalize to unseen data more effectively, whereas the Gaussian noise helps the model to be more robust to noise and artifacts that might be present in the data by focusing on the under-lying features rather than memorizing specific pixel values [29].
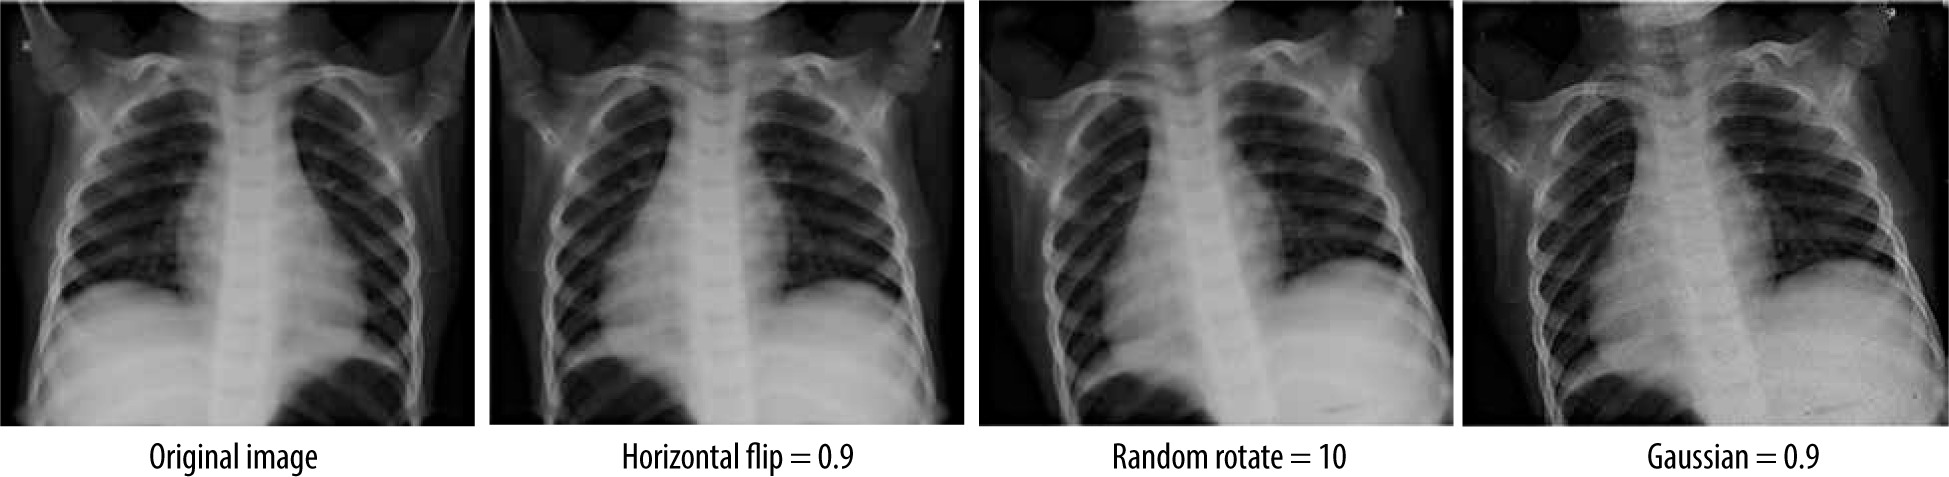
Table 1 shows the parameters used in these operations. This augmentation was applied after resizing all the images to 64×64 pixels and converting them from BGR format to RGB format, followed by a normalization that consists of collapsing the inputs to the range 0 and 1 in order to enhance the performance of the model.
The model architecture
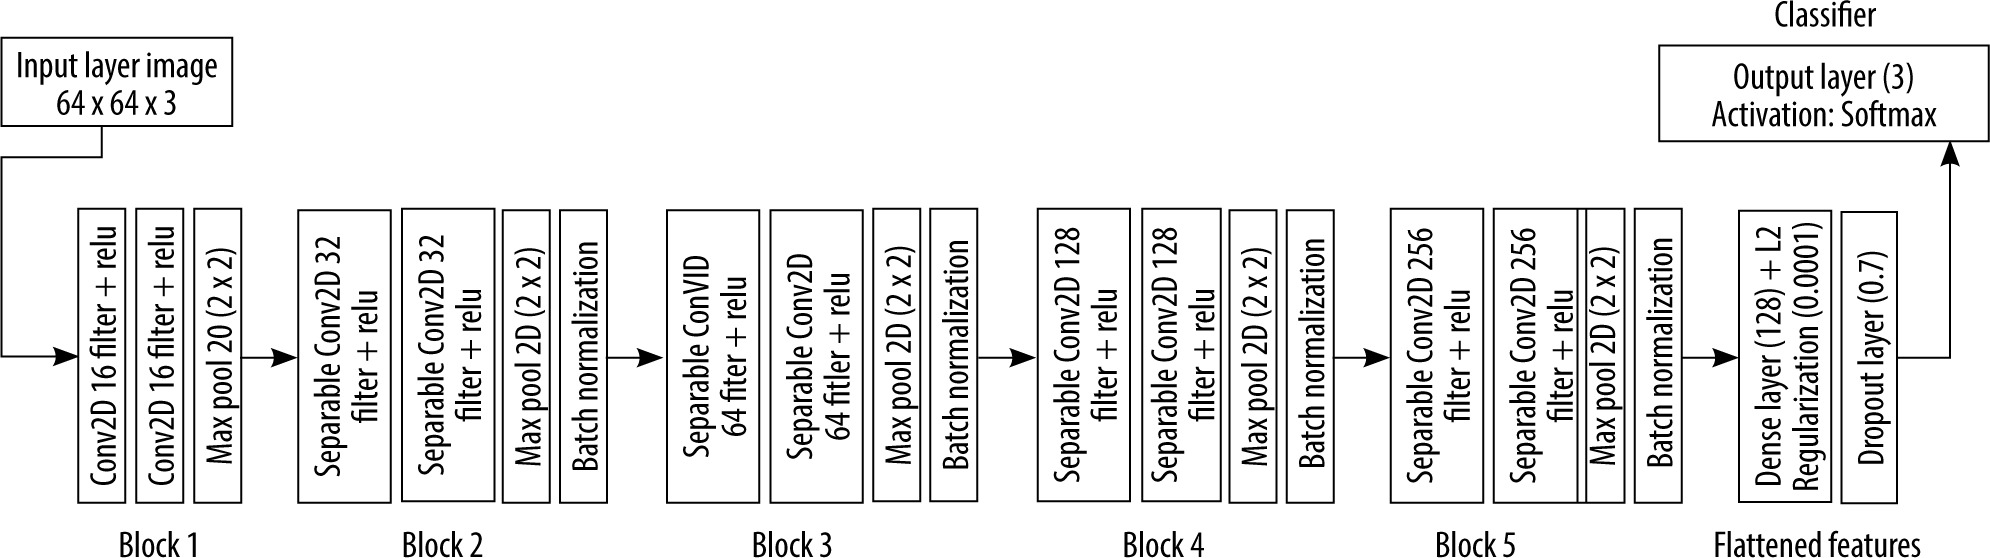
The proposed architecture is built upon a shallow CNN of 5 blocks of convolutional layers, followed by a fully connected layer with 128 neurons. The output is gene-rated using another fully connected layer of 3 neurons representing normal, viral, and bacterial pneumonia. To prevent the overfitting problem during the training, a normalization process is performed after each convolutional block. In addition, a dropout layer was inserted in the model to prevent the memorizing of training data (Figure 4). The features extracted from the training of the CNN are fed to the XGboost classifier, which is evaluated using the test data (Figure 5).
Experimental study
Model training
The training experiments were processed using various hyper-parameters. We trained the CNN model firstly to fix initial values that lead to better results. Different epoch sizes were considered. Experiments showed that a set of 40 epochs returns an optimal result (Table 2). Beyond that, the algorithm’s performance seems to be flat, and the model loss stopped decreasing. Hence, an early stopping process was added to prevent the overfitting. For training, the Adam optimizer algorithm was used with a learning rate value of 0.0001. The loss function was handled by a categorical-cross-entropy, and for the classification we used the softmax activation function in the output layer conjointly with L2-regularization optimizers. Table 2 shows details about the considered hyperparameters.
Table 2
Optimal experiment results
The XGboost classifier handles the second stage of training; it is fed a feature vector of length 52,163 that was extracted from CNN training by using a learning rate in the range 0.00001–0.1, which is considered within a wide variety of estimators. For the learning rate and number of estimators, experiments allowed for the best performance with values of 0.001 and 200, respectively.
As it is shown in Figure 1, the validation data are insufficient to adjust the model’s hyperparameters. So, we split the training data by 20% to validate this model.
Experimental process
Experiments were processed using Google Colab pro [30] on a A100 NVIDIA premium GPU with 27.3 Gb in the Python environment. We also used TensorFlow 2.11.0 and keras 2.11.0 as backend libraries and some other auxiliary tools such as sklearn for calculation of metrics and Numpy for image manipulation.
Within this context, various performance metrics were also used to evaluate the model including accuracy, precision, recall, and F1-score. The accuracy is defined as the ratio between the number of correctly predicted samples and the total number of samples. The precision, also known as specificity, estimates how well the model classifies a sample as positive. However, the recall or sensitivity, gauges the model’s ability to detect positive samples. In addition, the F1-score offers a pertinent blend of recall and precision. These evaluation metrics are represented by the following equations:
where TP, TN, FP, and FN denote, respectively, the number of samples correctly classified as positive, the number of samples correctly classified as negative, the number of samples wrongly classified as positive, and the number of samples wrongly classified as negative.
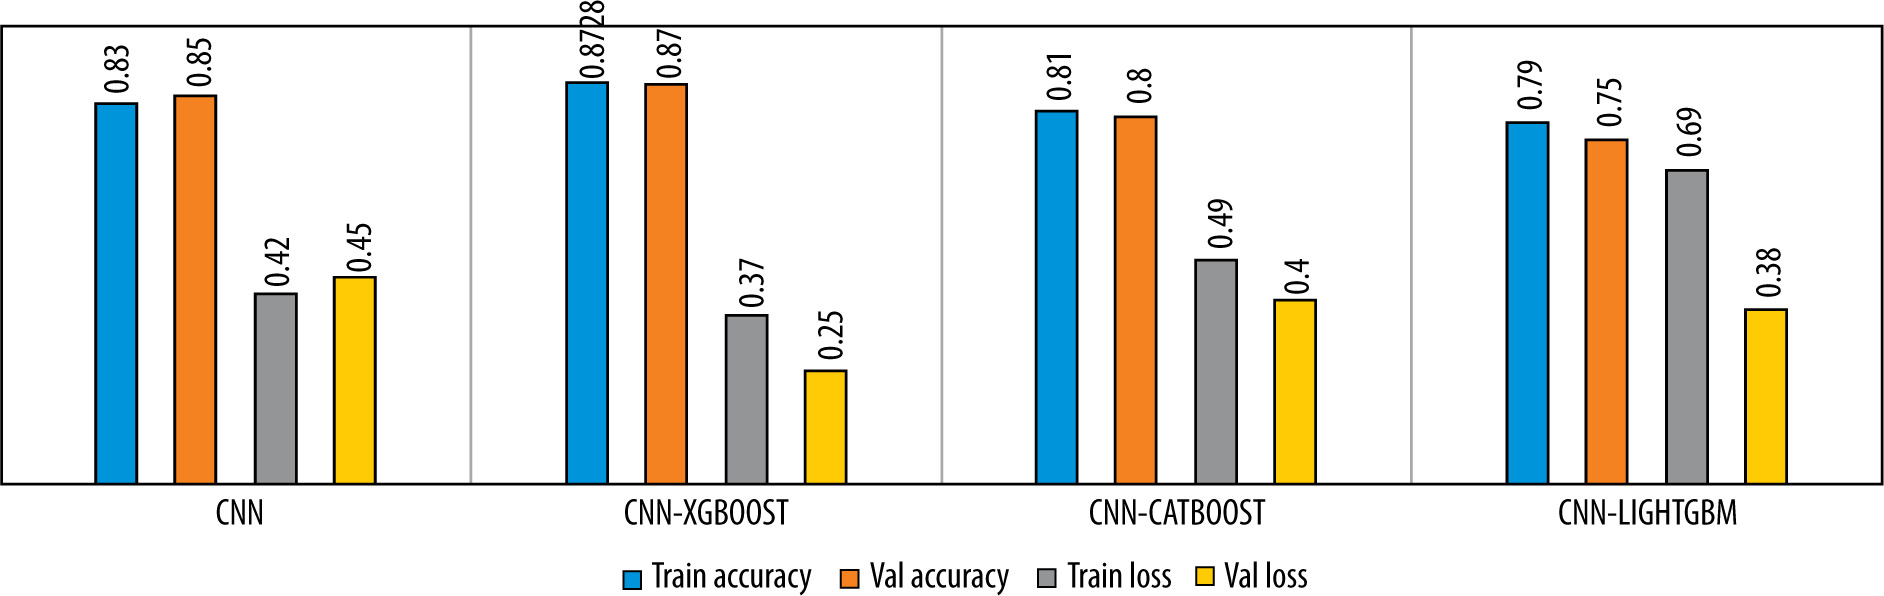
Table 3 shows the performances obtained by the various mentioned tools during the training process including other gradient boosting classifiers such as Catboost [31] and LightGBM [32], which are trained based on default hyperparameters.
Table 3
Classification performance for the test set
| Accuracy | Precision | Recall | F1-score | Training time | |
|---|---|---|---|---|---|
| CNN | 0.85 | 0.86 | 0.83 | 0.85 | 14 min |
| CNN-XGboost | 0.87 | 0.89 | 0.85 | 0.87 | 7 s |
| CNN-Catboost | 0.81 | 0.83 | 0.75 | 0.78 | 2 min 13 s |
| CNN-LightGBM | 0.79 | 0.80 | 0.68 | 0.73 | 57 s |
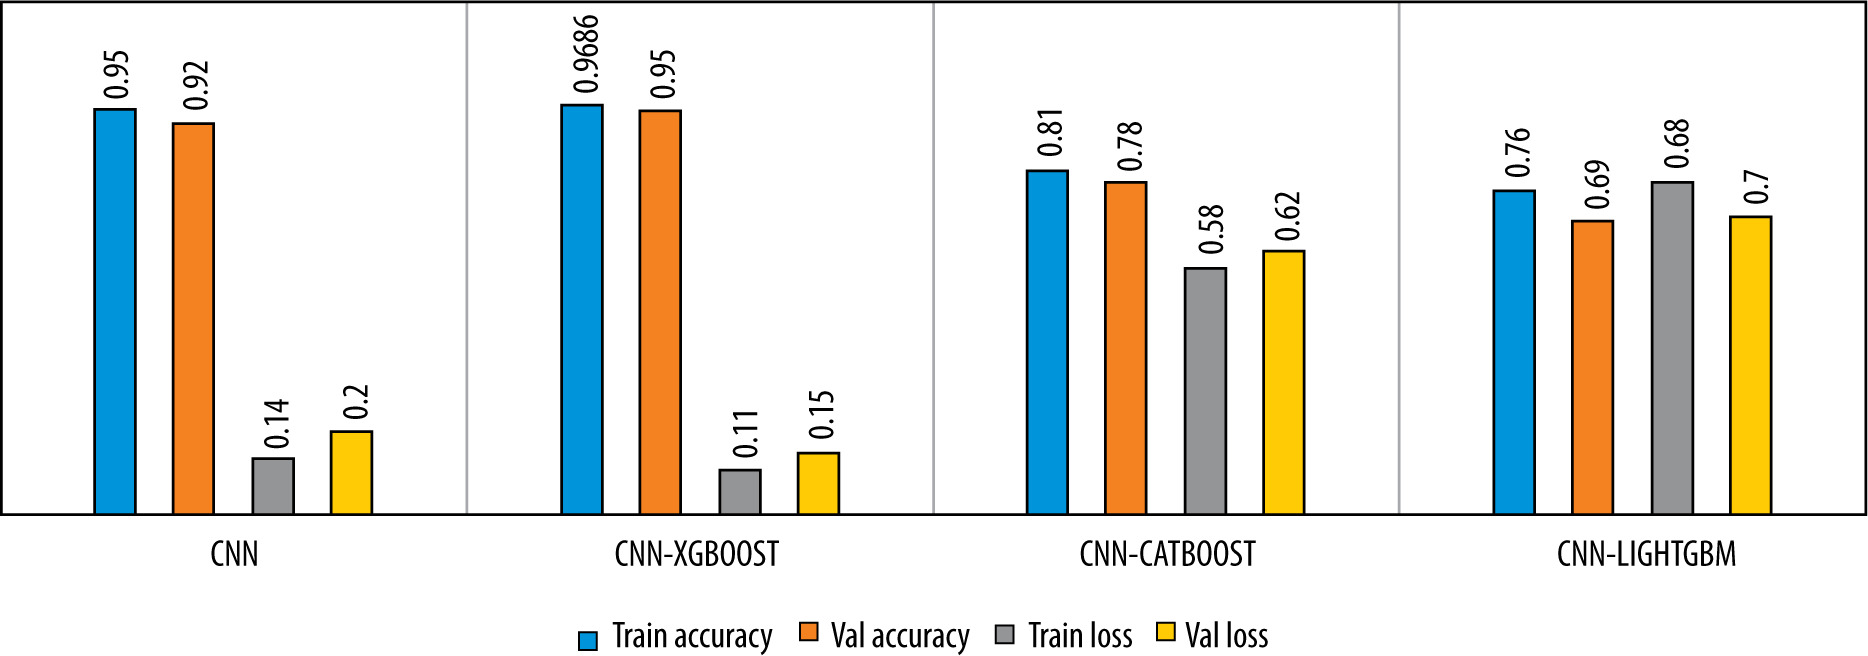
The learning curves of the proposed model with respect to epochs are shown in Figure 6. We noticed that no overfitting occurred to impact the model accuracy. The Figure 7 illustrates the performance analysis of the CNN model training and its combination with the diffe-rent gradient boosting classifiers.
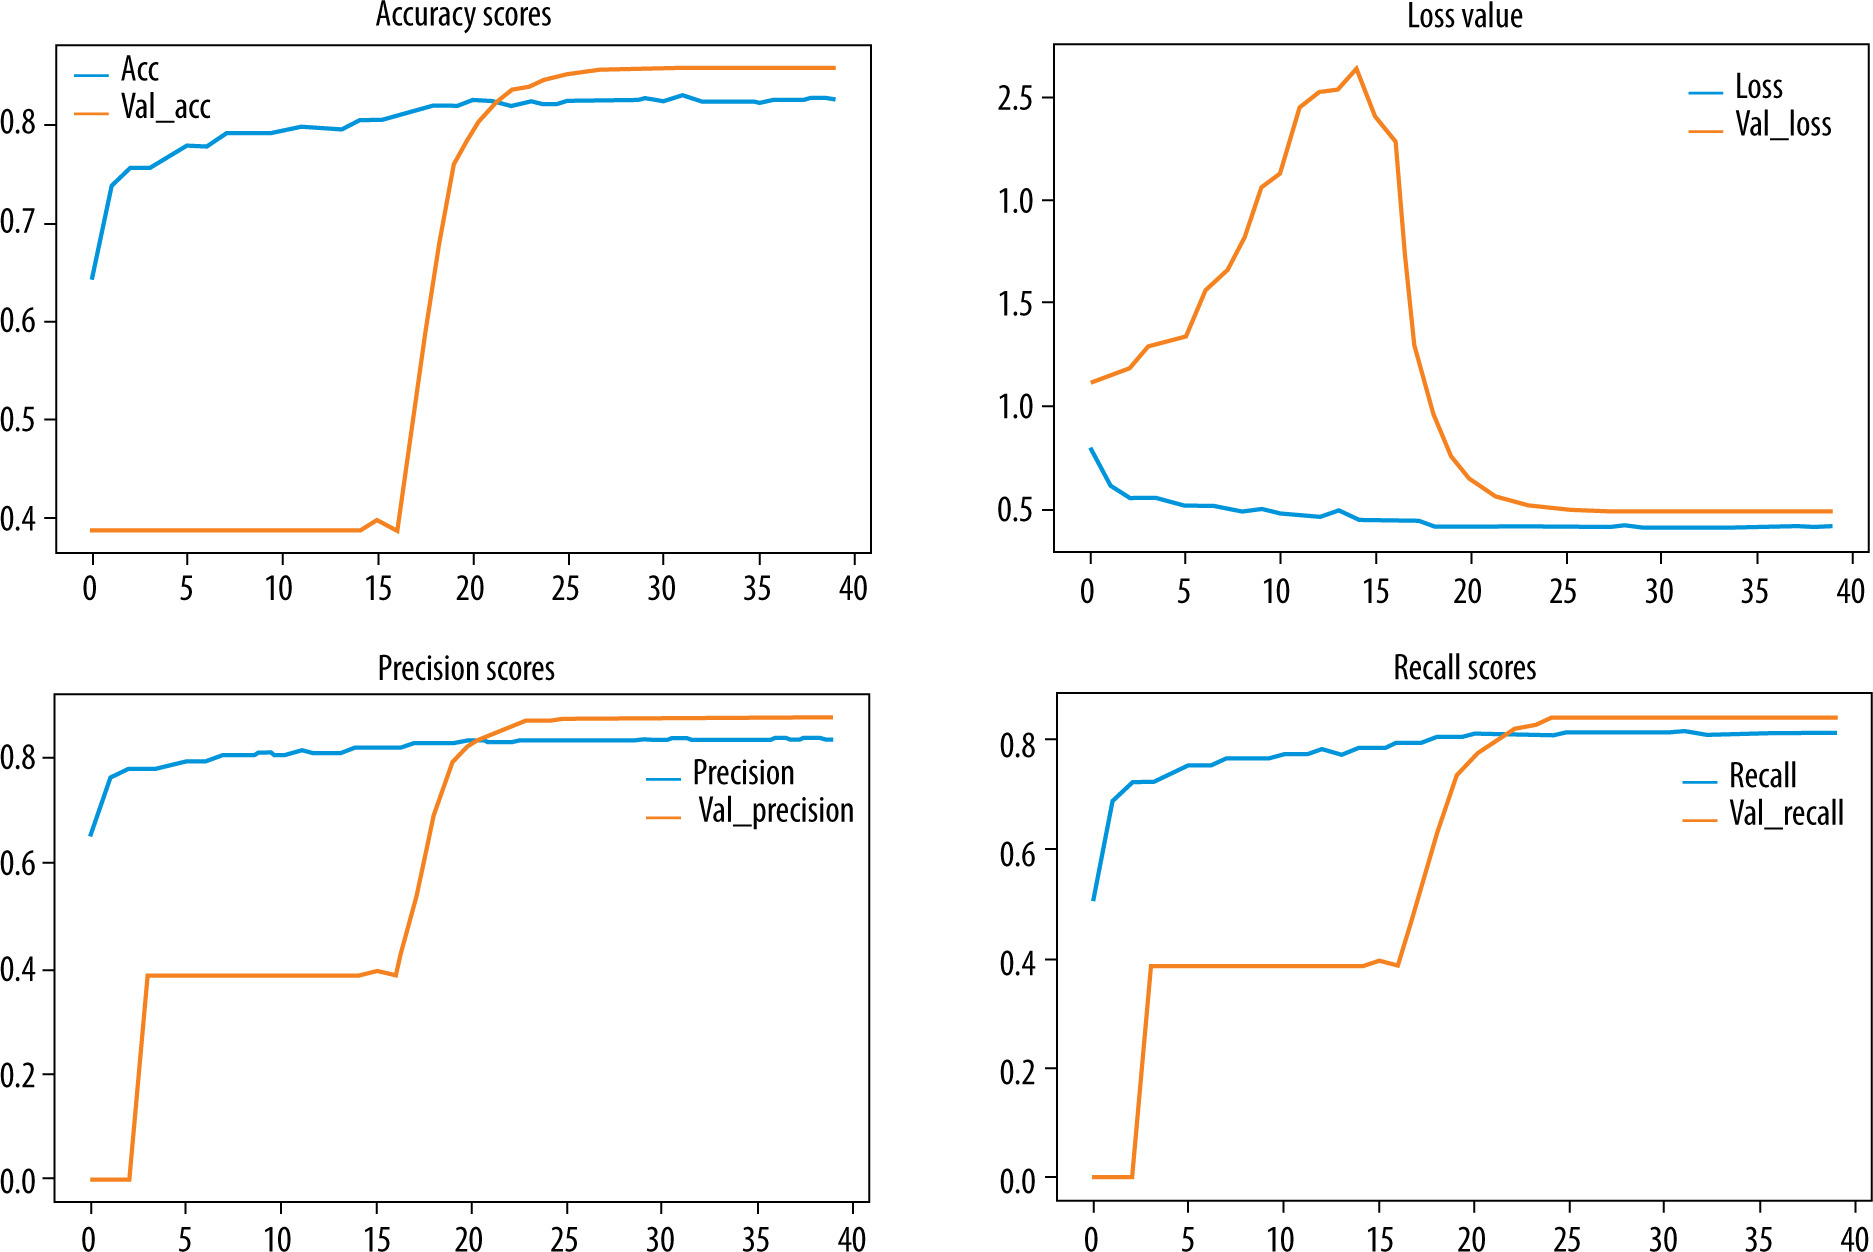
Figure 7
Comparison of the model’s performance in term of accuracy and loss for 3-class classification
To evaluate the performance of the proposed model, we trained the model for a binary classification by combining the viral pneumonia images with the bacterial pneumonia images as one class. The results are showed in Figures 8 and 9.
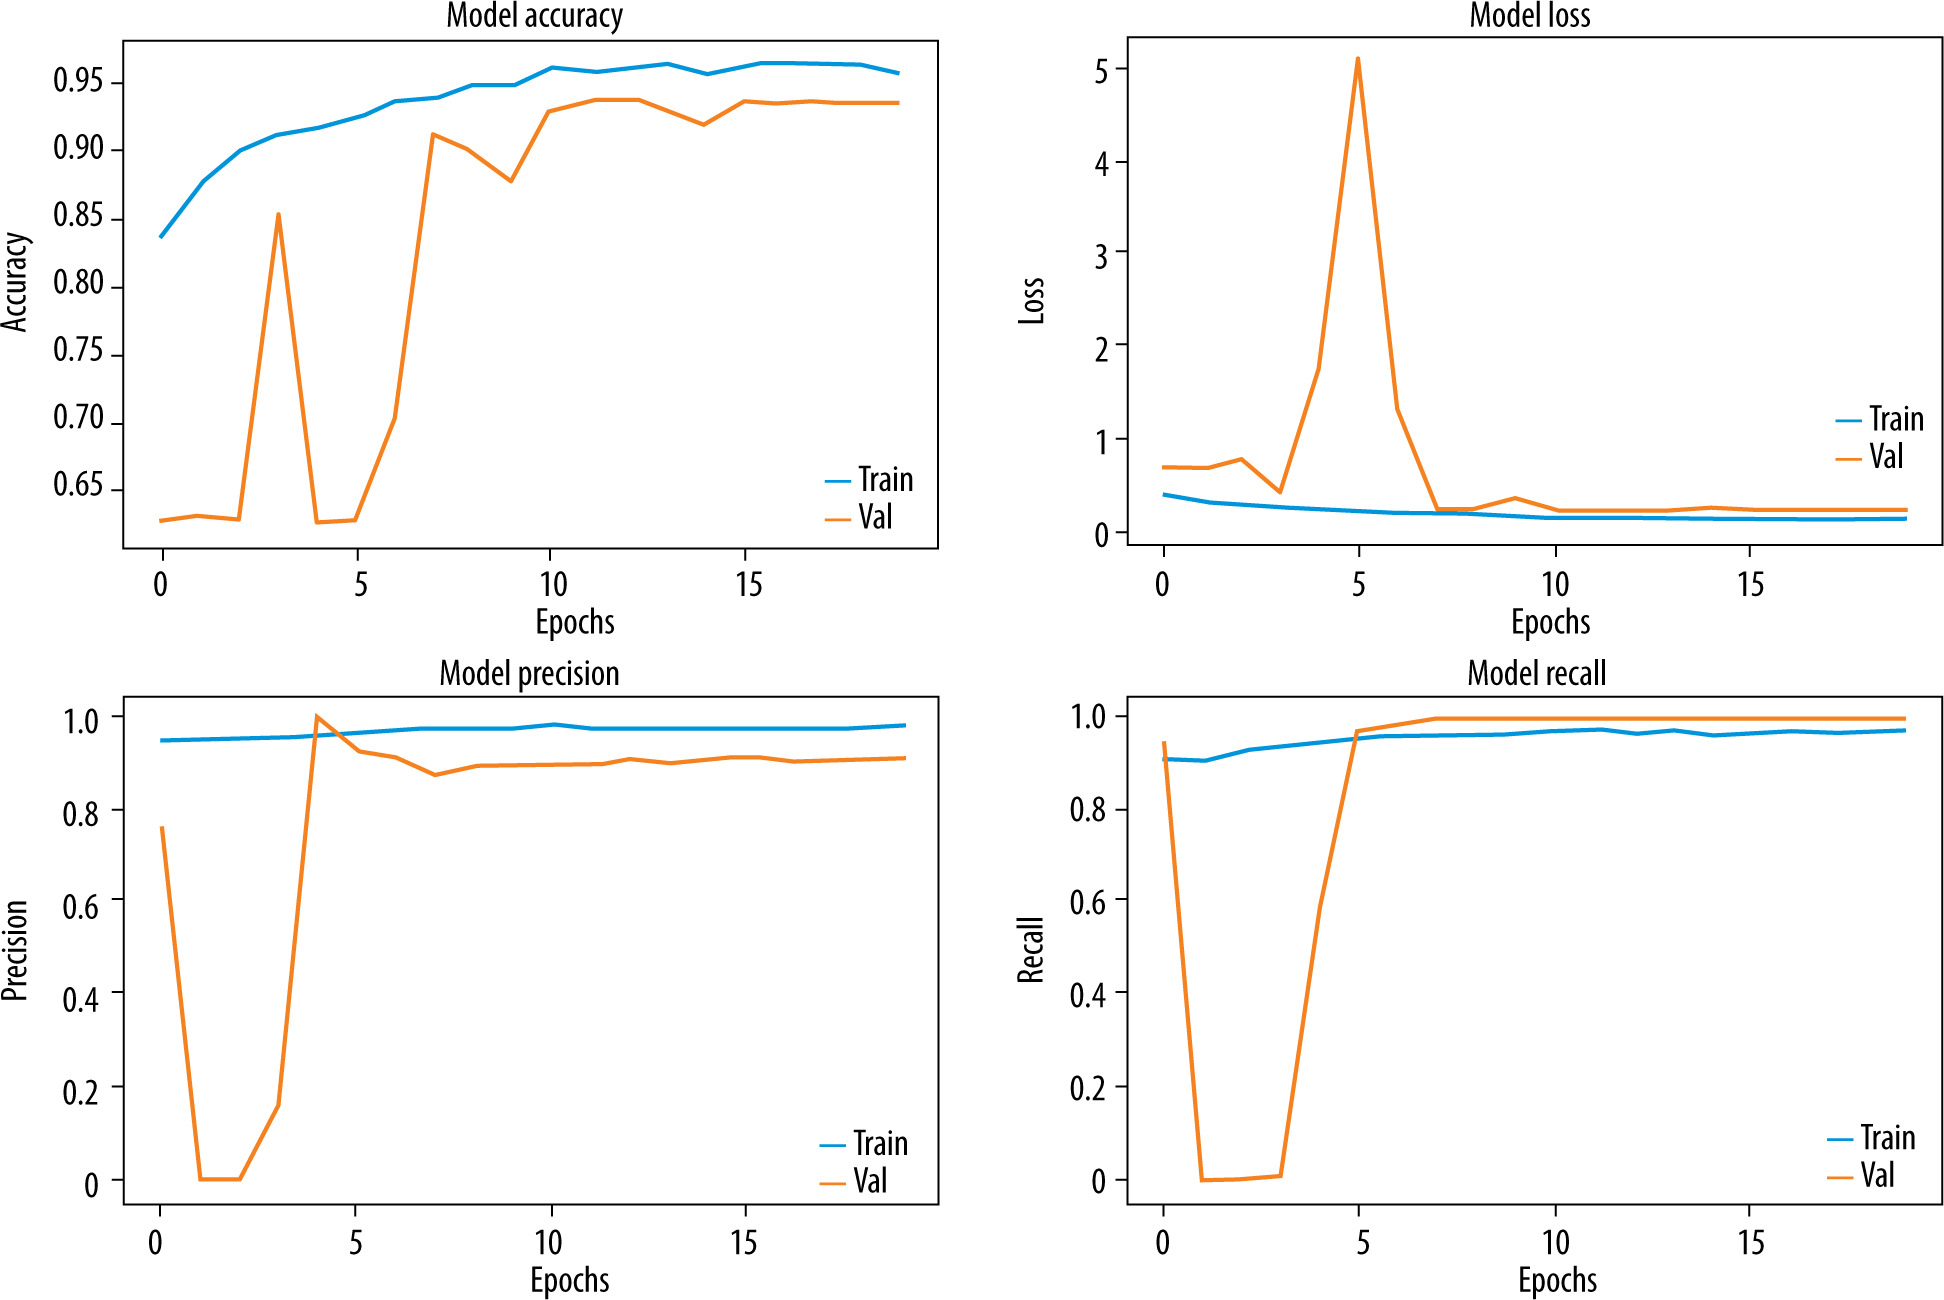
Figure 9
Comparison of the model’s performance in term of accuracy and loss for 3-class classification
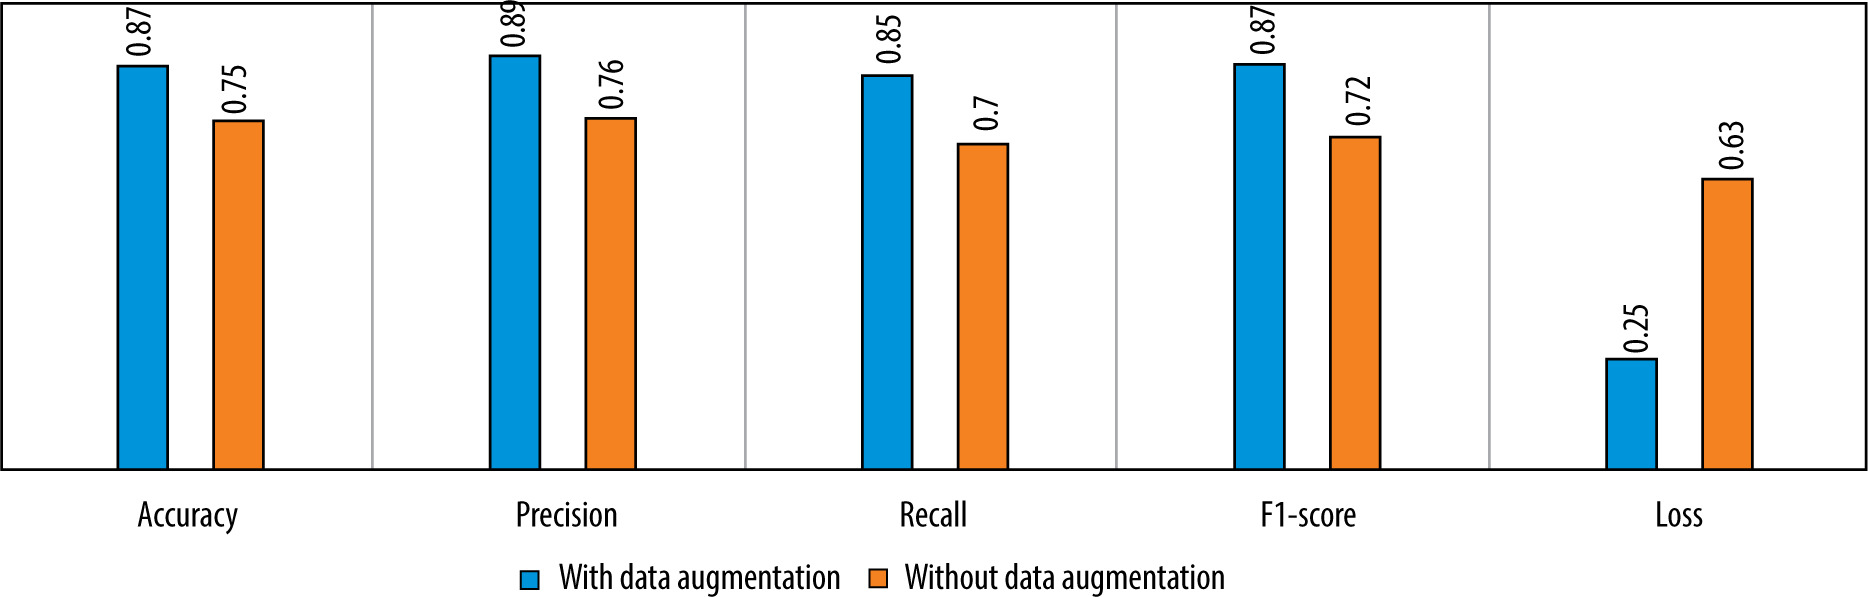
We also tested the efficiency of the used data augmentation technique. The difference between the model’s performance with and without data augmentation is given in Figure 10.
Discussion
Figures 6-9 and Table 3 demonstrate, in terms of performance and training time, that the hybridization of CNN and XGboost tools provide better results than each tool separately. However, the results obtained by CNN-LightGBM were not satisfactory. Thus, the same algorithm with 2-way classification achieved a higher accuracy compared with 3-way classification.
Table 3 indicates that the precision of the model outperforms the recall, which means that the model was able to correctly classify healthy CXR images compared with infected CXR images. This is due to the low number of images in the dataset and the strong resemblance between viral images and bacterial images. In the case of binary classification, the model yields a high recall, which means that this algorithm successfully identified a large number of pneumonia cases, which is very important for early diagnosis.
In regard to the literature, good performance was presented by [22], with an accuracy of 91.8% in distingu-ishing between normal, viral, and bacterial pneumonia. Within the Kaggle challenge for pneumonia detection in the spring of 2022, the best result was 87.018% [33]. Both works used fine-tuned, pre-trained CNNs (such as VGG-16, ResNet-50, or DenseNet), which allow general learned features to enhance the model’s performance. However, this kind of model encloses various convolutional layers, leading to complex treatment, and consequently requires more processing time. On the other hand, a similar approach was proposed by [34], which is based on CNN for feature extraction and XGboost, Catboost, LightGBM, and random forest for the classification of COVID-19 CXR images; LightGBM achieved the highest accuracy of 100%. A sparse number of 60 real data obtained from Antoni Juraz University was used (30 from healthy individuals and 30 with COVID-19) for which we cannot ensure the generalizability of the model to other data.
The use of a combination of CNN-XGboost models allowed us to take advantage of the power of CNN in the feature’s extraction and parallelization process of XGboost, which reduced the execution time. Table 4 shows an overview of results achieved by works developed for pneumonia classification compared to our work.
Table 4
Summary of different results achieved with regard to related works
| Authors | Pathology | Dataset | Number of classes | Model architecture | Results |
|---|---|---|---|---|---|
| Rajpurkar et al. [5] | Pneumonia | Chest x-ray 14 [7] | 14 | Pretrained DenseNet 121 | AUCROC = 76.8% |
| Jiang et al. [8] | Pneumonia | Children pneumonia dataset [20] | 2 | Inception ResNet V2 | Accuracy = 94.2% |
| Kermany et al. [9] | Pneumonia | Children pneumonia dataset [20] | 2 | Transfer learning | Accuracy = 92.8% |
| Shah et al. [10] | Pneumonia | Children pneumonia dataset [20] | 2 | Shallow CNN | Accuracy = 92.8% |
| Yaseliani et al. [11] | Pneumonia | Children pneumonia dataset [20] | 2 | Hybrid CNN VGG16+VGG19 | Accuracy = 98% |
| Pham et al. [12] | Chest abnormalities | VinDr-CXR [35] | 15 | ResNet and efficientNet for classification / FasterRCNN, yolov5 and efficientDet for abnormality localisation | MAP = 29% |
| Sirazitdinov et al. [14] | Pneumonia | Children pneumonia dataset [20] | 2 | Mask RCNN and RetinaNet | Recall = 79.3% |
| Liz et al. [16] | Alveolar pneumonia and non-consolidation | Children pneumonia dataset [20] + X-ray pediatric pneumonia Xrpp dataset | 2 | CNN from scratch with 5 convolutional layers | AUC = 92% |
| Wang et al. [18] | Pneumonia and COVID-19 | CovidX dataset [18] | 3 | Pretrained deep CNN | Accuracy = 93.3% |
| Rajaraman et al. [22] | Pneumonia | Children pneumonia dataset [20] | 3 | Customized VGG16 | Accuracy = 91.8% |
| Verma et al. [23] | Viral pneumonia and COVID-19 | Children pneumonia dataset [20] + BIMCV COVID-19 dataset [36] | 3 | Fine-tuned pretrained VGG16 | Accuracy = 98% |
| Gielczyk et al. [34] | COVID-19 | Hospital database of the Antoni Jurasz University hospital | 2 | CNN-LightGBM | Accuracy = 100% |
| Our | Pneumonia | Children pneumonia dataset [20] | 3 | Hybrid model CNN-XGboost | Accuracy = 87% |
Conclusions and future perspectives
The main goal of this study was to develop a high-precision model for real-time automated diagnosis using CXR images, which could help clinicians to anticipate the pneumonia treatment process. The paper provides a model based on convolutional neural network and extreme gradient boosting classifier to detect and classify images of viral and bacterial pneumonia diseases. The work was a challenging task due to the lack of appropriate data. The experimental process allows a greater accuracy of 87%, a specificity of 89%, and a sensitivity of 85%.
In future, we aim to enhance the model performance using a larger dataset, either by augmenting the data using more robust tools of data augmentation such as Generative Neural Networks (Gans) or by collecting more CXR images of pneumonia cases. We can also attempt experimentation with more models to obtain greater accuracy.