


Introduction
Low back pain (LBP) has been a global public health concern since 1990, affecting about 60-80% of individuals [1]. The annual and lifetime prevalence of LBP in India is 51% and 66%, respectively [2]. Lumbar degenerative disc disease (LDDD) is considered the most common cause of LBP, with an incidence rate of 70% [3]. LDDD starts at age of 16-20 years [3] and increases with age, with a high reported prevalence of up to 90% between 50 and 55 years of age [4]. Genetic predisposition, mechanical causes, high-load stress, lifestyle, nutrition, trauma, growth factors, and age-related physiological deterioration are commonly responsible for its onset, progression, and acceleration [3,5,6].
Intervertebral disc (IVD) consists of an inner gelatinous nucleus pulposus (NP) and an outer thick ring of fibrous cartilage, called the annulus fibrosus (AF), sandwiched between the hyaline cartilage endplates. Central NP contains randomly arranged collagen fibres embedded in highly hydrated gel containing aggrecan [7,8], which is a major sulphate chain containing proteoglycan (PG), which maintains tissue hydration through osmotic pressure [9]. Peripheral AF contains parallelly arranged collagen fibres within concentric rings [10], with higher PG and lower water content than NP [11,12]. The cartilage endplates are the last to wear through and serve as the disc’s primary source of nutrition through diffusion because IVDs are relatively avascular and aneural [13,14]. The early stage of degeneration begins with biochemical changes in NP that include damage to collagen, loss of PG, water content causing reduced hydration, and intradiscal osmotic pressure resulting in loss of height, disc bulge under load, and discogenic pain due to nociceptor stimulation in AF [15]. Lumbar discs are the most frequent and typical location of these changes due to considerable mechanical stress.
Magnetic resonance imaging (MRI) is the most widely used imaging technique for evaluating the morphology of IVD and the degree of disc degeneration. Pfirrmann et al. categorized disc degeneration (grade I to V) based on a variety of parameters [16], including the ability to distinguish between NP and AF, signal pattern, disc structure, and disc height on T2-weighted (T2-W) imaging. In 2007, Griffith et al. suggested a modified Pfirrmann grading (MPG), from grade I to VIII, to classify degenerative discs (DDs) more accurately in elderly people, in which the majority of discs fall into Pfirrmann grades III or IV [17]. The biochemical disturbances that occur before morphological alterations are the first indications of early LDDD that are not detected on conventional MRI, which is further limited by reproducibility and inter-observer variation [18,19].
Newer quantitative MRI (QMRI) techniques like T2* mapping, diffusion-weighted imaging (DWI), T1rho imaging, in vivo Na MRI imaging, and nuclear MR spectroscopy have emerged in the last decade as non-invasive, precise diagnostic tools to identify the biochemical makeup of IVD at various stages of LDDD [20,21]. The T2* mapping technique evaluates the biochemical changes by detecting translational motion of water molecules in the collagen matrix with an assessment of their molecular integrity and composition, which has a good correlation with micro-structural differences in collagen fibre arrangement, PG, and water content of NP [22-24]. The basis of T2* mapping is the use of characteristics of transverse relaxa-tion, indicating the transverse magnetization decay that is demonstrated with gradient-echo (GRE) sequences because its more sensitive to T2* decay by altering user-selectable parameters including repetition time (TR), echo time (TE), and flip angle. Consecutive images with variable TE and signal levels are required to generate a T2* relaxa-tion time map.
DWI measures random Brownian motion and creates apparent diffusion coefficient (ADC) maps by describing isotropic diffusion of water molecules and their relative speed in each direction within a voxel of tissue used to track the activity of water molecules in NP, thus reflecting microstructural changes within [25]. DWI uses the property of avascularity of IVD and nutrient diffusion limitation of DDs, utilising ADC values [22-24] that show reduction as molecular diffusibility is affected in LDDD [26].
The advantages of T2* mapping and DWI include easier, faster imaging with better resolution and availability of processing software with no exogenous contrast administration or any special hardware. Advanced imaging techniques to diagnose early stages of disc degeneration have become important with the availability of many new therapeutic options for NP augmentation [12,27]. We aimed to assess T2* and DWI/ADC mapping values of lumbar IVD, compiling normative data, and evaluating the spatial variations occurring within the same and different anatomical levels and spectrum of deviation in DDs. The relationship between T2* and ADC techniques with a T2-W visual MPG system for IVD degeneration was evaluated.
Material and methods
This observational, cross-sectional study was carried out at a tertiary care teaching hospital in Western India after obtaining Ethics Committee approval. One hundred adult subjects (56 females, 44 males), with ages ranging 20-74 years and with a history of non-specific LBP, were included. Patients with ankylosing spondylitis, lumbar trauma, prior lumbar surgery, metallic implant, infection, and other blood-related lumbar disorders were excluded.
All patients underwent MRI of the lumbar spine on a Siemens 3-Tesla Magnetom Vida MRI scanner (Erlan-ger, Germany) using a Biomatrix spine coil (Table 1). Conventional T2-W sagittal sequences were obtained in a supine position for disc localization and assessment for visual MPG of LDDD. Sagittal DWI was performed with multi-shot, dual spin echo, readout-segmented echo-planar (RESOLVE) imaging acquisition. An optimal b-value of 600 mm2/s, which falls within the range of the inverse of the mean ADC of IVD, was used for the optimum signal-to-noise ratio [28]. A sagittal T2* multi-echo GRE sequence with exponentially increasing 5 echoes was obtained. The sagit-tal acquisition plane was used to evaluate IVD in a perpendicular direction to the acting shearing forces. Post-processing for DWI was performed to obtain ADC maps and for T2* mapping to get automatic colour-coded T2* maps (Figures 1 and 2) by using the Inline processing package syngo MR XA30 software. In T2* mapping, healthy NP usually appears green, and AF appears blue.
Table 1
Imaging parameters of T2* and DWI/ADC MR sequence protocol
Figure 1
Mid-sagittal T2WI (A) of lumbar spine with corresponding apparent diffusion coefficient (ADC) values (B), T2* values (C) and T2*coloured maps (D).ADC and T2* values measured at 3 regions of interest (ROIs) on nucleus pulposus (NP) (anterior, mid, and posterior) after dividing the disc into 5 boxes with ROIs drawn along the horizontal line passing through the centre of the disc
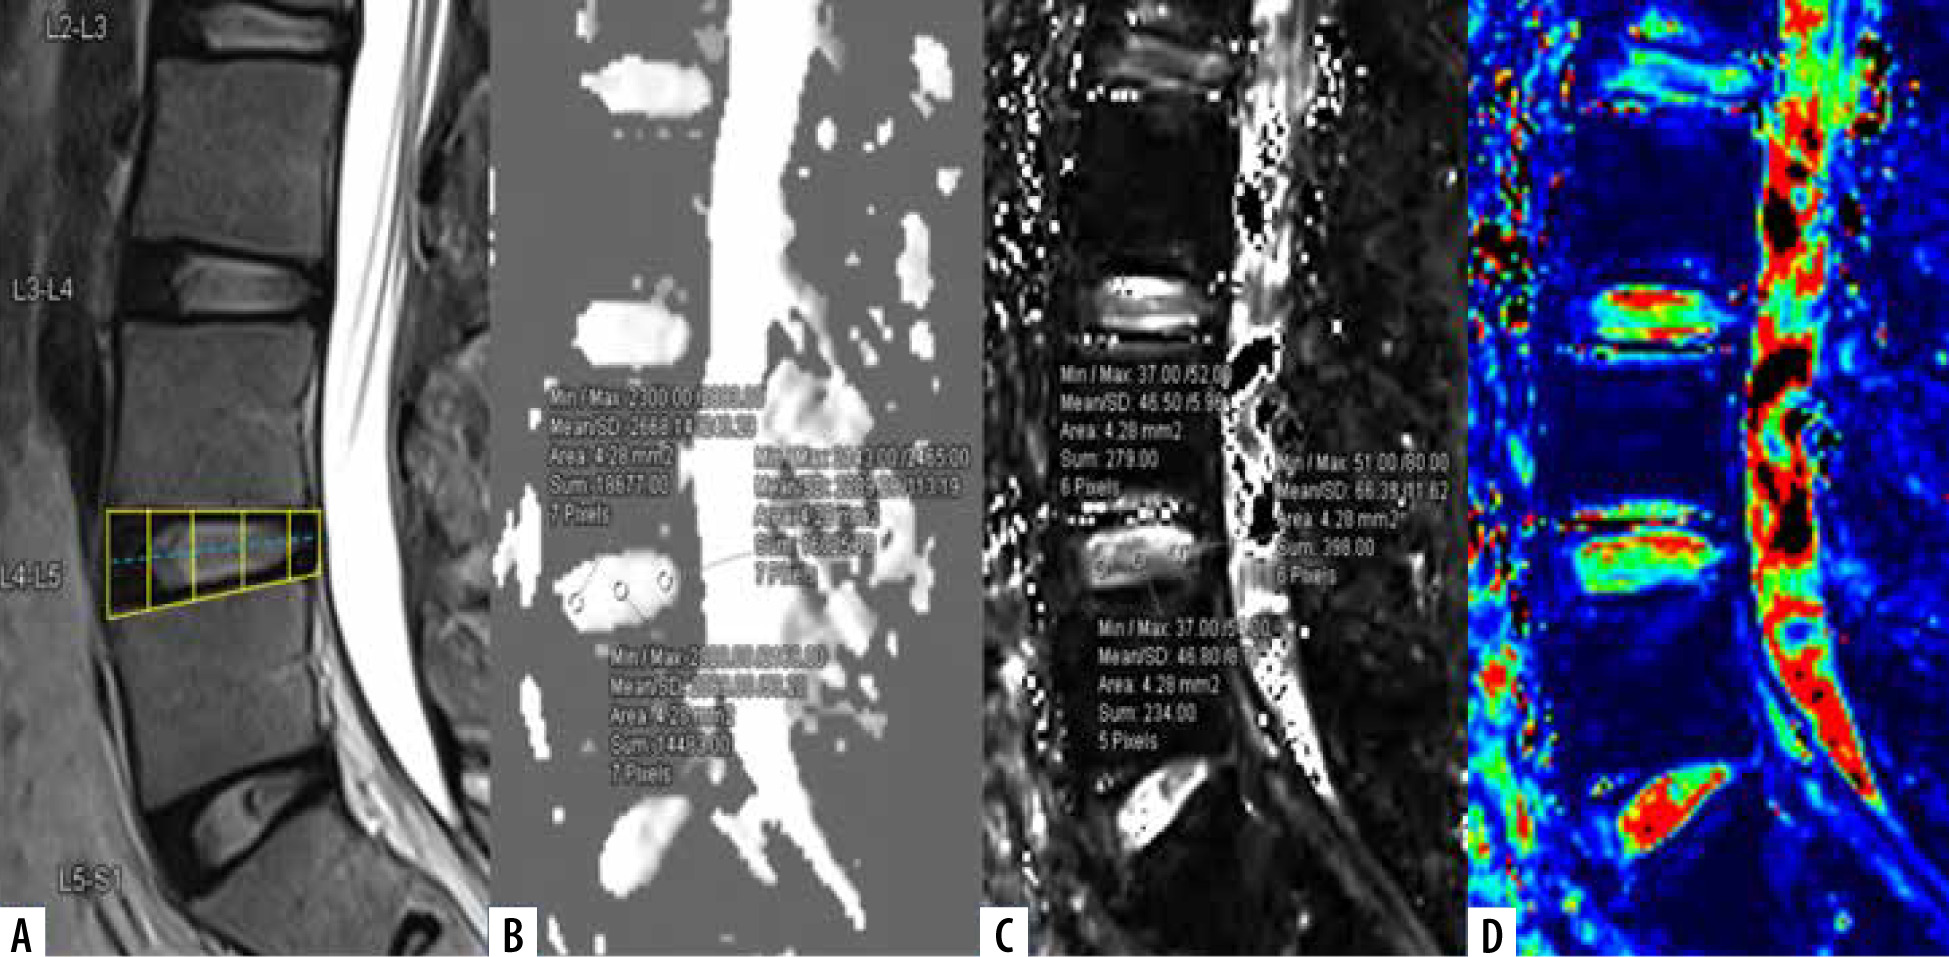
Figure 2
Mid-sagittal T2WI (A) of lumbar spine with corresponding apparent diffusion coefficient (ADC) values (B), T2* values (C), and T2*coloured maps (D).ADC and T2* values measured at 2 regions of interest (ROIs) on annulus fibrosus (AF) (anterior and posterior) after dividing the disc into 5 boxes with ROIs drawn along the horizontal line passing through the centre of the disc
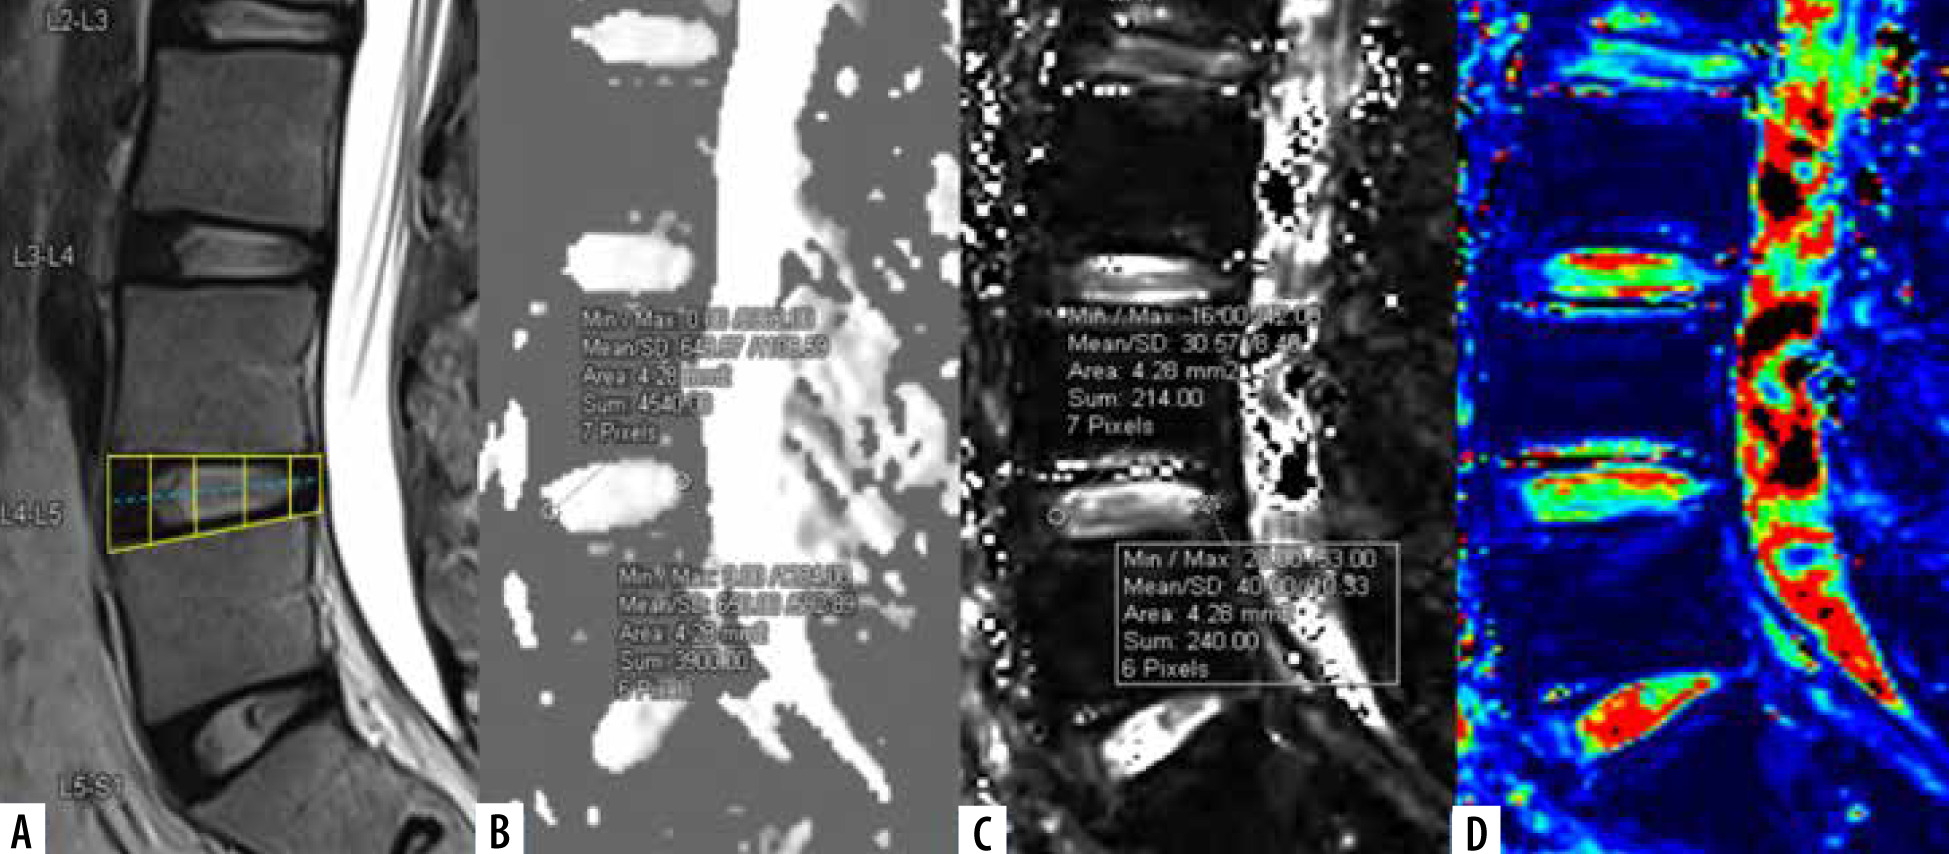
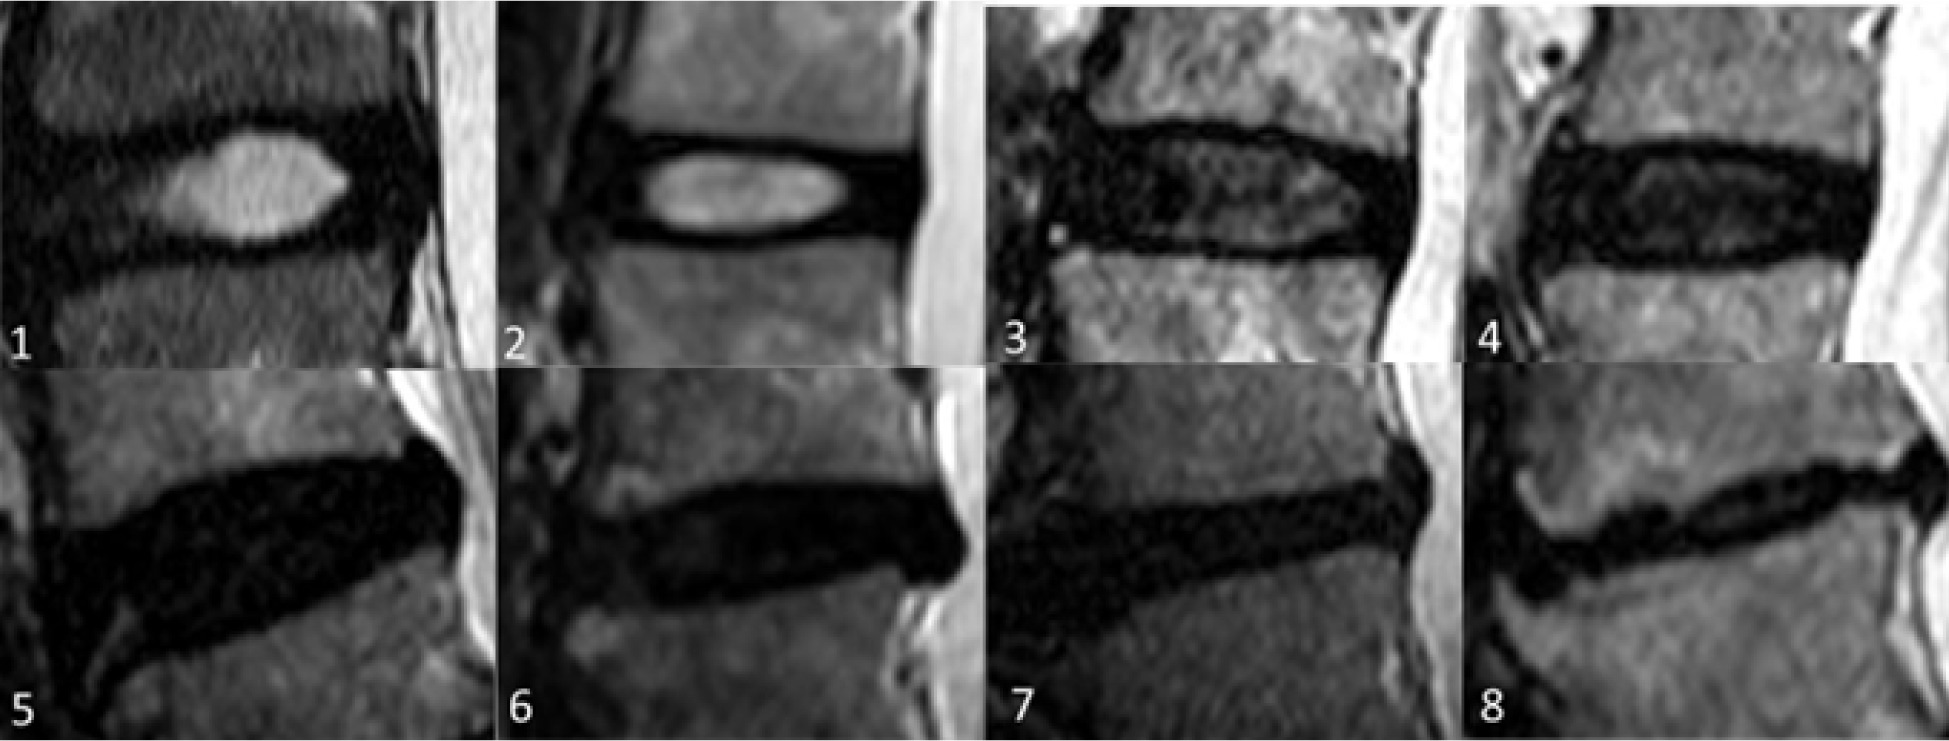
The L3-L4, L4-L5, and L5-S1 discs were considered for analysis because lower lumbar discs are more likely to degenerate under the effect of higher mechanical stress [29]. Total 300 discs in 100 patients were divided into 8 groups, from grade I to VIII, according to the MPG system on T2 sagittal sequence (Figure 3) [17]. Grade I discs were used as controls to obtain normative data, and grade II to VIII were used as cases. ADC and T2* relaxa-tion time values were obtained in 5 ROIs (area ranging between 4.1 and 4.5 mm2) at each disc level in the mid-sagittal section after proper syncing of the 3 sequences – T2-W, ADC maps, and T2* maps (both magnitude and colour-coded images). On T2-W images, the boxes were drawn for 2 segments (anterior, posterior) in AF and 3 equal segments in NP (anterior, mid, posterior) excluding the vertebral end plates, dividing the IVD into 5 boxes (Figures 1A and 2A). A horizontal line through the mid part of the IVD passing through the boxes was drawn to mark the central location, which was used for uniform placement of the ROIs. Placement of ROIs was done on the central line to avoid partial averaging and to obtain accurate measurement of ADC and T2* values (Figures 1 and 2).
Figure 3
Modified Pfirrmann grades (MPG) in lumbar IVDs on T2-weigted images based on signal of nucleus pulposus (NP) and inner fibres of annulus fibrosus (AF), distinction of inner and outer fibres of posterior AF, and disc height. 1. Grade I: homogenous high signal similar to cerebrospinal fluid (CSF). 2. Grade II: hyperintense signal which is more than presacral fat and less than CSF. 3. Grade III: hyperintense signal that is less than presacral fat. Grade I, II, and III have obvious distinction between inner and outer fibres of posterior AF and normal disc height. 4. Grade IV: mildly hyperintense, which is slightly more than outer AF. 5. Grade V: hypointense signal equal to outer AF. Grade IV to VIII (4-8) discs show loss of distinction between inner and outer fibres of posterior AF. 6. Grade VI: hypointense with < 30% disc height reduction, 7. Grade VII: hypointense with 30-60% disc height reduction, 8. Grade VIII: hypointense with > 60% disc height reduction
The same placement of ROIs was copied to the ADC and T2* maps to avoid variability in measurements. The ROIs in AF were taken at the inner part of the AF to include the region of inner fibres for measurements based on the MPG system (Figure 2). Mean ADC and T2* values for each ROI of each disc level were calculated. The differences of ADC and T2* values of NP and AF were established for normal and for DDs, which were correlated with the MPG system.
Statistical methods
Following data entry in Microsoft Excel, statistical analysis was performed in SPSS software version 17.0. Demographic and qualitative variables were presented as frequency and percentages. ADC and T2* values were expressed as mean (standard deviation). ANOVA was used to find differences in mean values of 5 ROIs across different regions and MPG of IVDs. The Pearson and Spearman correlation coefficient was used to find the correlation of ADC and T2* values with age and the MPG system of IVD. A receiver operating characteristics (ROC) curve was used to calculate the ADC and T2* cut-off for different MPGs, which was validated with sensitivity, specificity, positive predictive value (PPV), and negative predictive value (NPV). P-value < 0.05 was considered statistically significant.
Results
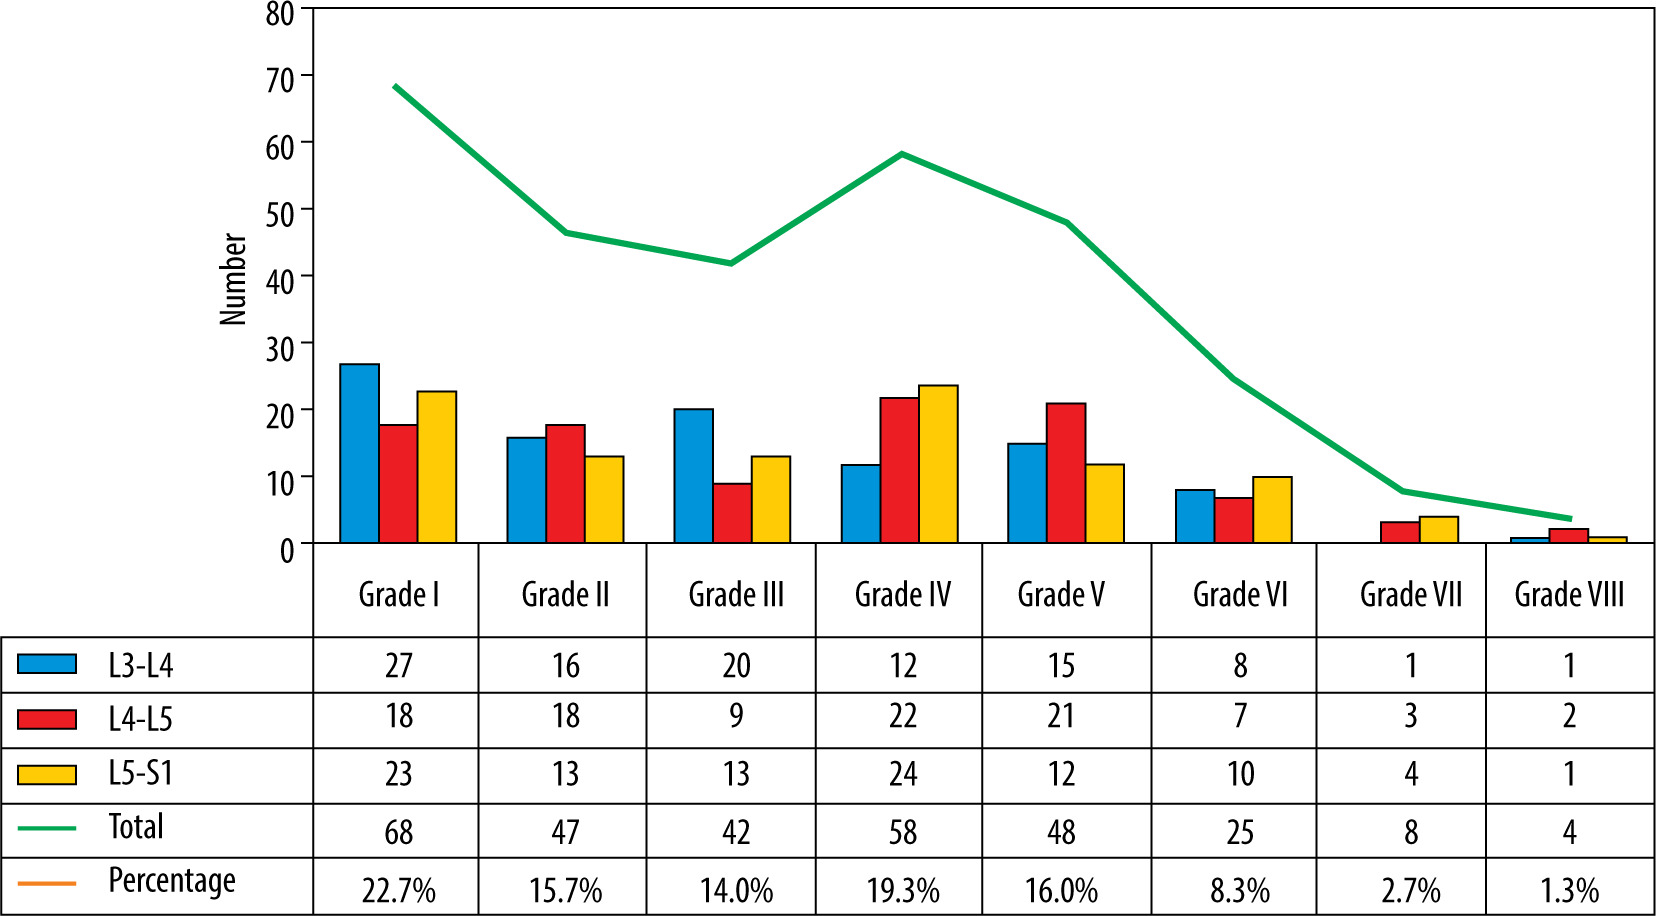
Three hundred discs were evaluated in 100 adult subjects (mean age 42.2 ± 15.0 years and female:male ratio 1 : 1.3). Most of the patients were in overweight (47%) and normal (45%) BMI categories. Out of 300, 68 (22.7%) were normal (grade I) discs and 232 (77.4%) were DDs (grade II-VIII), with the majority (263) in MPG categories I-V (Figure 4).
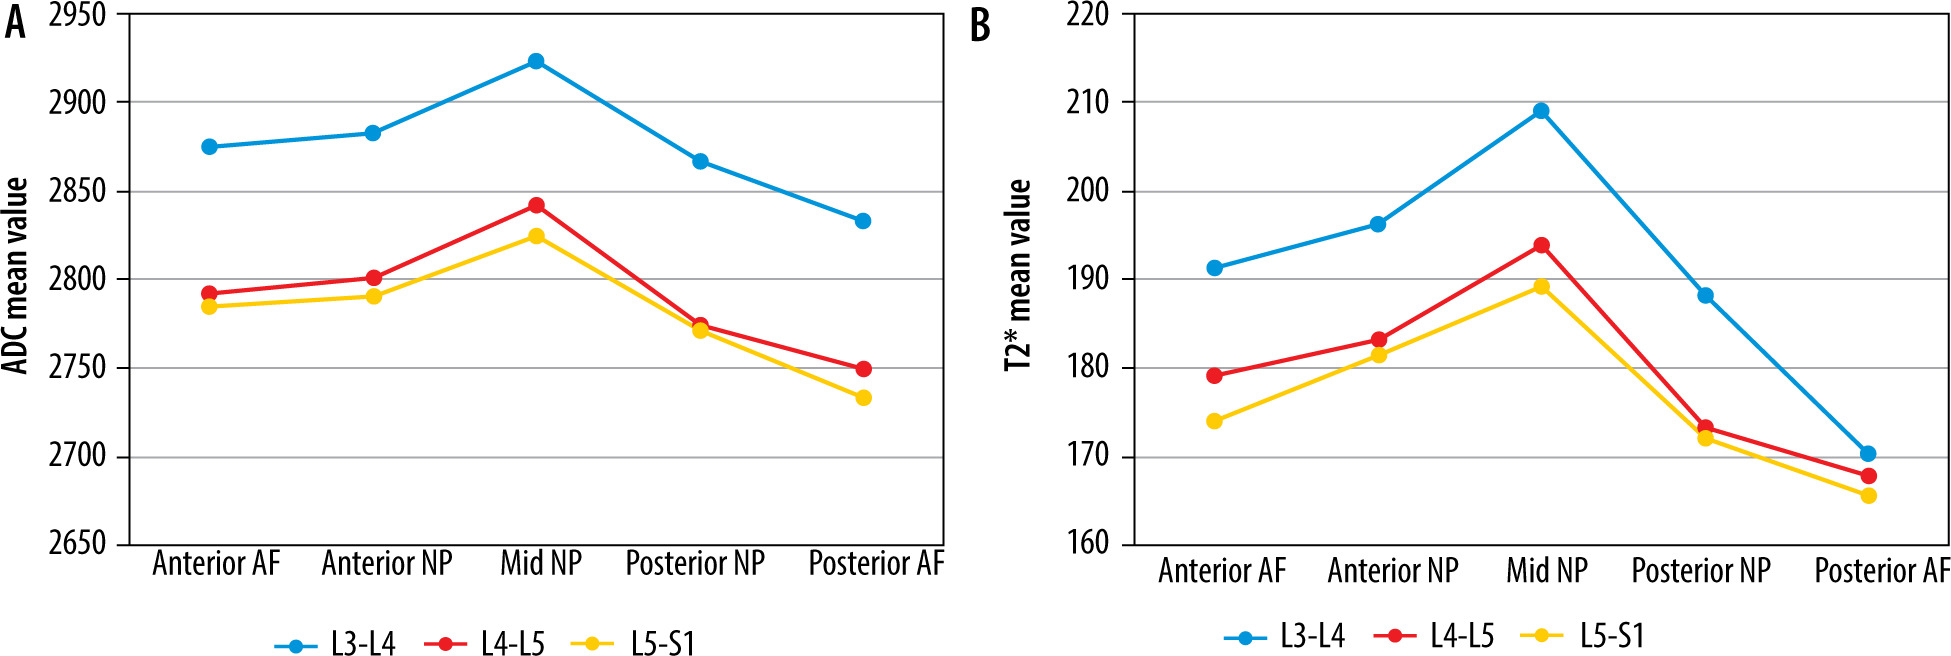
The highest mean ADC and T2* values in normal discs were recorded at the L3-L4 level and declined consistently from L3-L4 to L5-S1 (Tables 2 and 3). ADC and T2* values in normal discs differed statistically significantly at corresponding ROIs at different lumbar disc levels. The combined mean ADC and T2* values of NP were greater than AF at all disc levels. Mean ADC and T2* values were highest at mid NP at each normal disc and declined to their lowest at the posterior NP and AF (Figure 5). Mean ADC and T2* values in anterior AF and NP were higher than posterior AF and NP. No significant correlation between T2* and ADC values and age was noted for normal discs.
Table 2
Mean ADC (× 10-6 mm2/s) and T2* (ms) values with reference range at various ROIs in NP in each disc at 3 different lumbar disc levels for Grade I MPG (normative data)
Table 3
Mean ADC (× 10-6 mm2/s) and T2* (ms) values with reference range at various ROIs in AF in each disc at 3 different lumbar disc levels for grade I MPG (normative data)
Figure 5
Mean apparent diffusion coefficient (ADC) (× 10-6 mm2/s) (A) and T2* (ms) (B) values at different regions of interest (ROIs) in normal (grade I modified Pfirrmann grading) disc at 3 different lumbar disc levels
Statistically significant negative correlation was noted between age and T2* and ADC values for central region of DDs with respective Spearman correlation coefficient (r) of −0.62/−0.66 at L3-L4, −0.64/−0.7 at L4/L5, and −0.38/−0.34 at L5/S1 level. Mean ADC (Table 4) and T2* (Table 5) values in NP, AF, and the entire disc were significantly lower in DDs from normal discs (p < 0.001). From grade I to grade VIII the mean ADC value ranged from 2831.1 ± 64.9 to 211.1 ± 161.8 × 10⁻⁶ mm2/s and from 2812.9 ± 75.4 to 236.7 ± 172.1 × 10⁻⁶ mm2/s in NP and AF, respectively (Table 4). Similarly, from grade I to grade VIII, the mean T2* value ranged from 187.3 ± 16.7 to 15.3 ± 3.6 ms and from 174.7 ± 19.1 to 22.8 ± 9.8 ms in NP and AF, respectively (Table 5). Mean ADC and T2* values of NP decrease significantly as compared to AF with increasing subsequent grades (grade II to grade VIII) with drastic reduction in values of advanced degeneration grades VI, VII, and VIII (Figure 6). The mean ADC (Figure 7) and T2* (Figure 8) values were inversely proportional to increasing grades, with strong negative correlation (p < 0.001) with MPG irrespective of disc level.
Table 4
Mean ADC values (× 10-6 mm2/s) of all ROIs (NP and AF) across different MPGs in the total discs (irrespective of disc level)
Table 5
Mean T2* values (ms) of all ROIs (NP and AF) across different MPGs in the total discs (irrespective of disc level)
Figure 6
Mean apparent diffusion coefficient (ADC) (× 10-6 mm2/s) and T2* values (ms) of nucleus pulposus (NP) and annulus fibrosus (AF) across different modified Pfirrmann grades in all discs (irrespective of disc level)
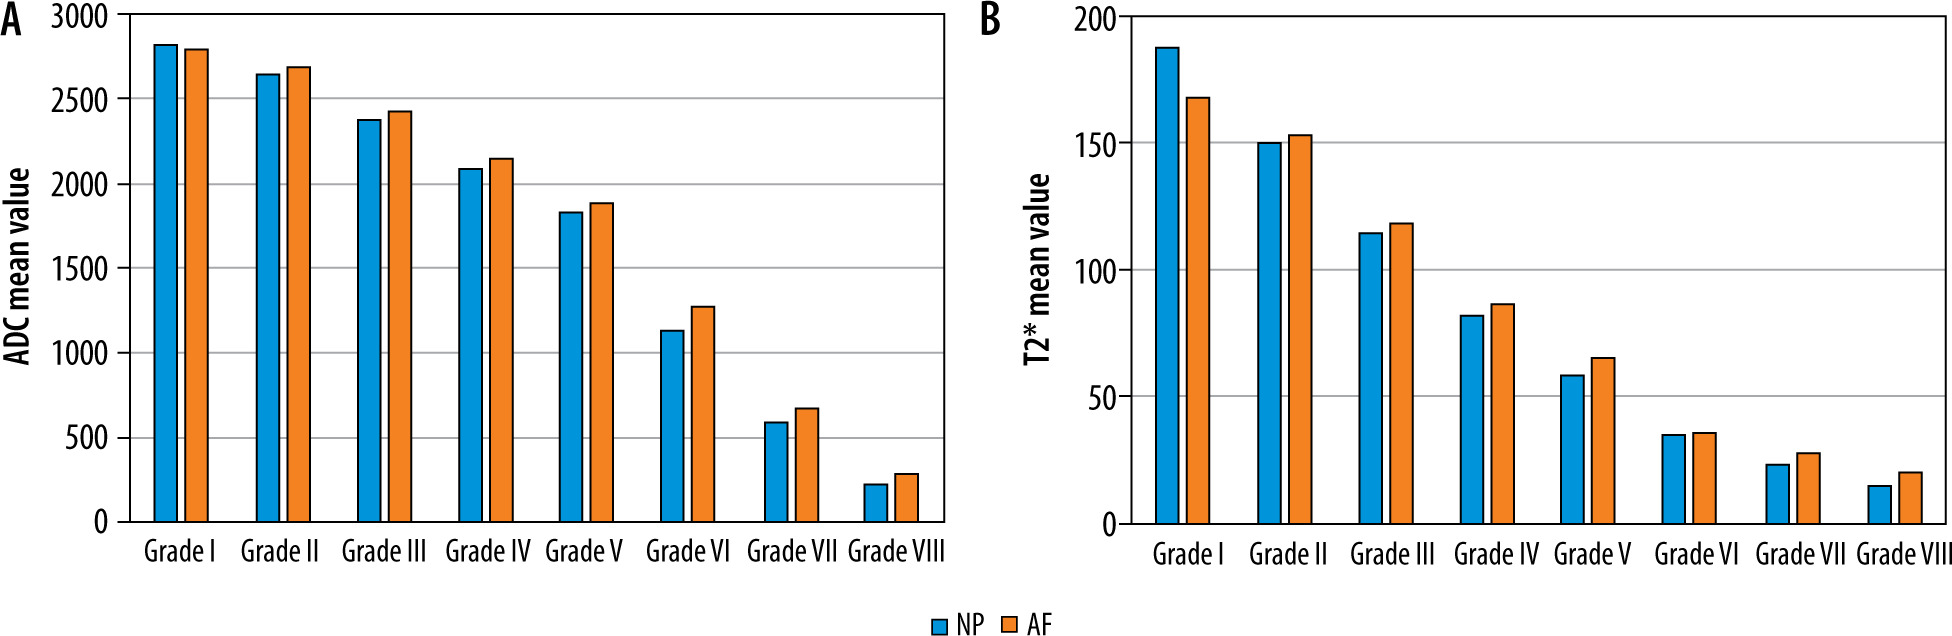
Figure 7
Correlation between modified Pfirrmann grading (MPG) and ADC values (× 10-6 mm2/s) (n = 300)
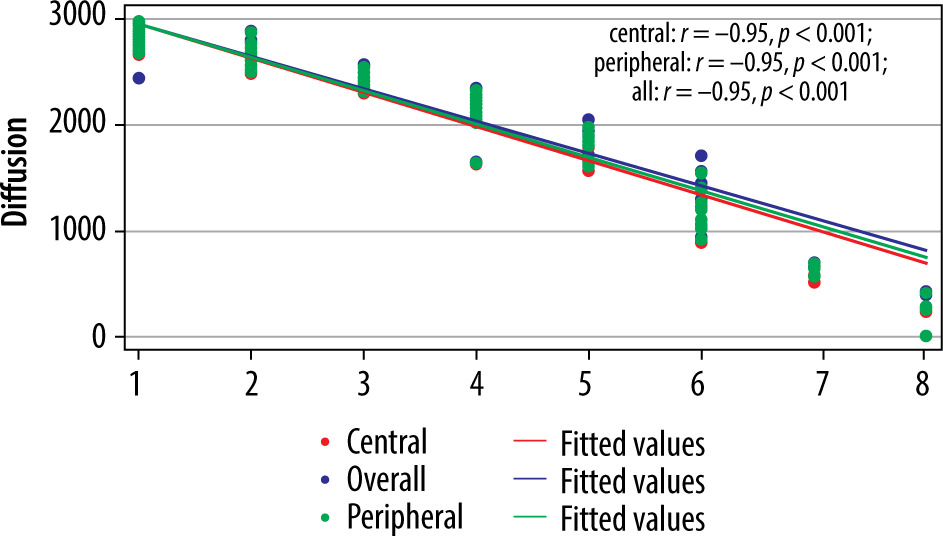
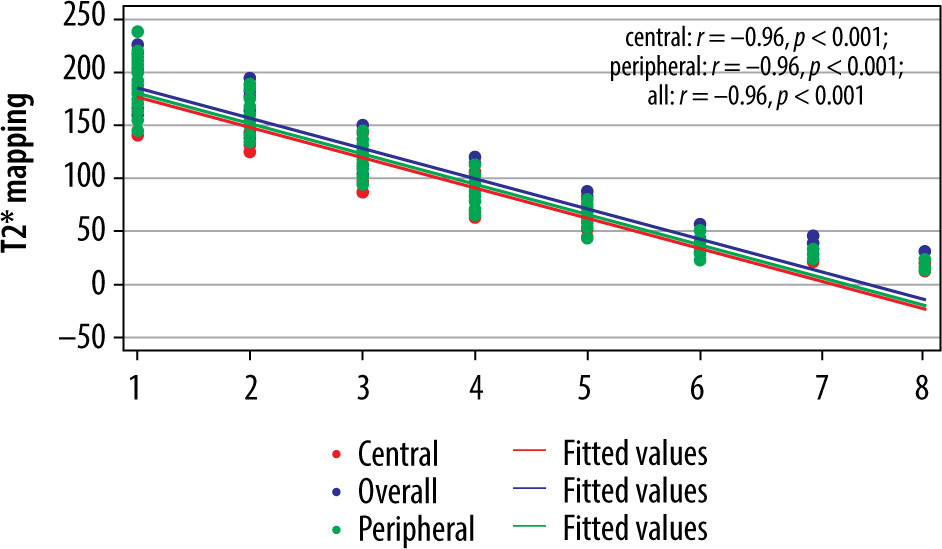
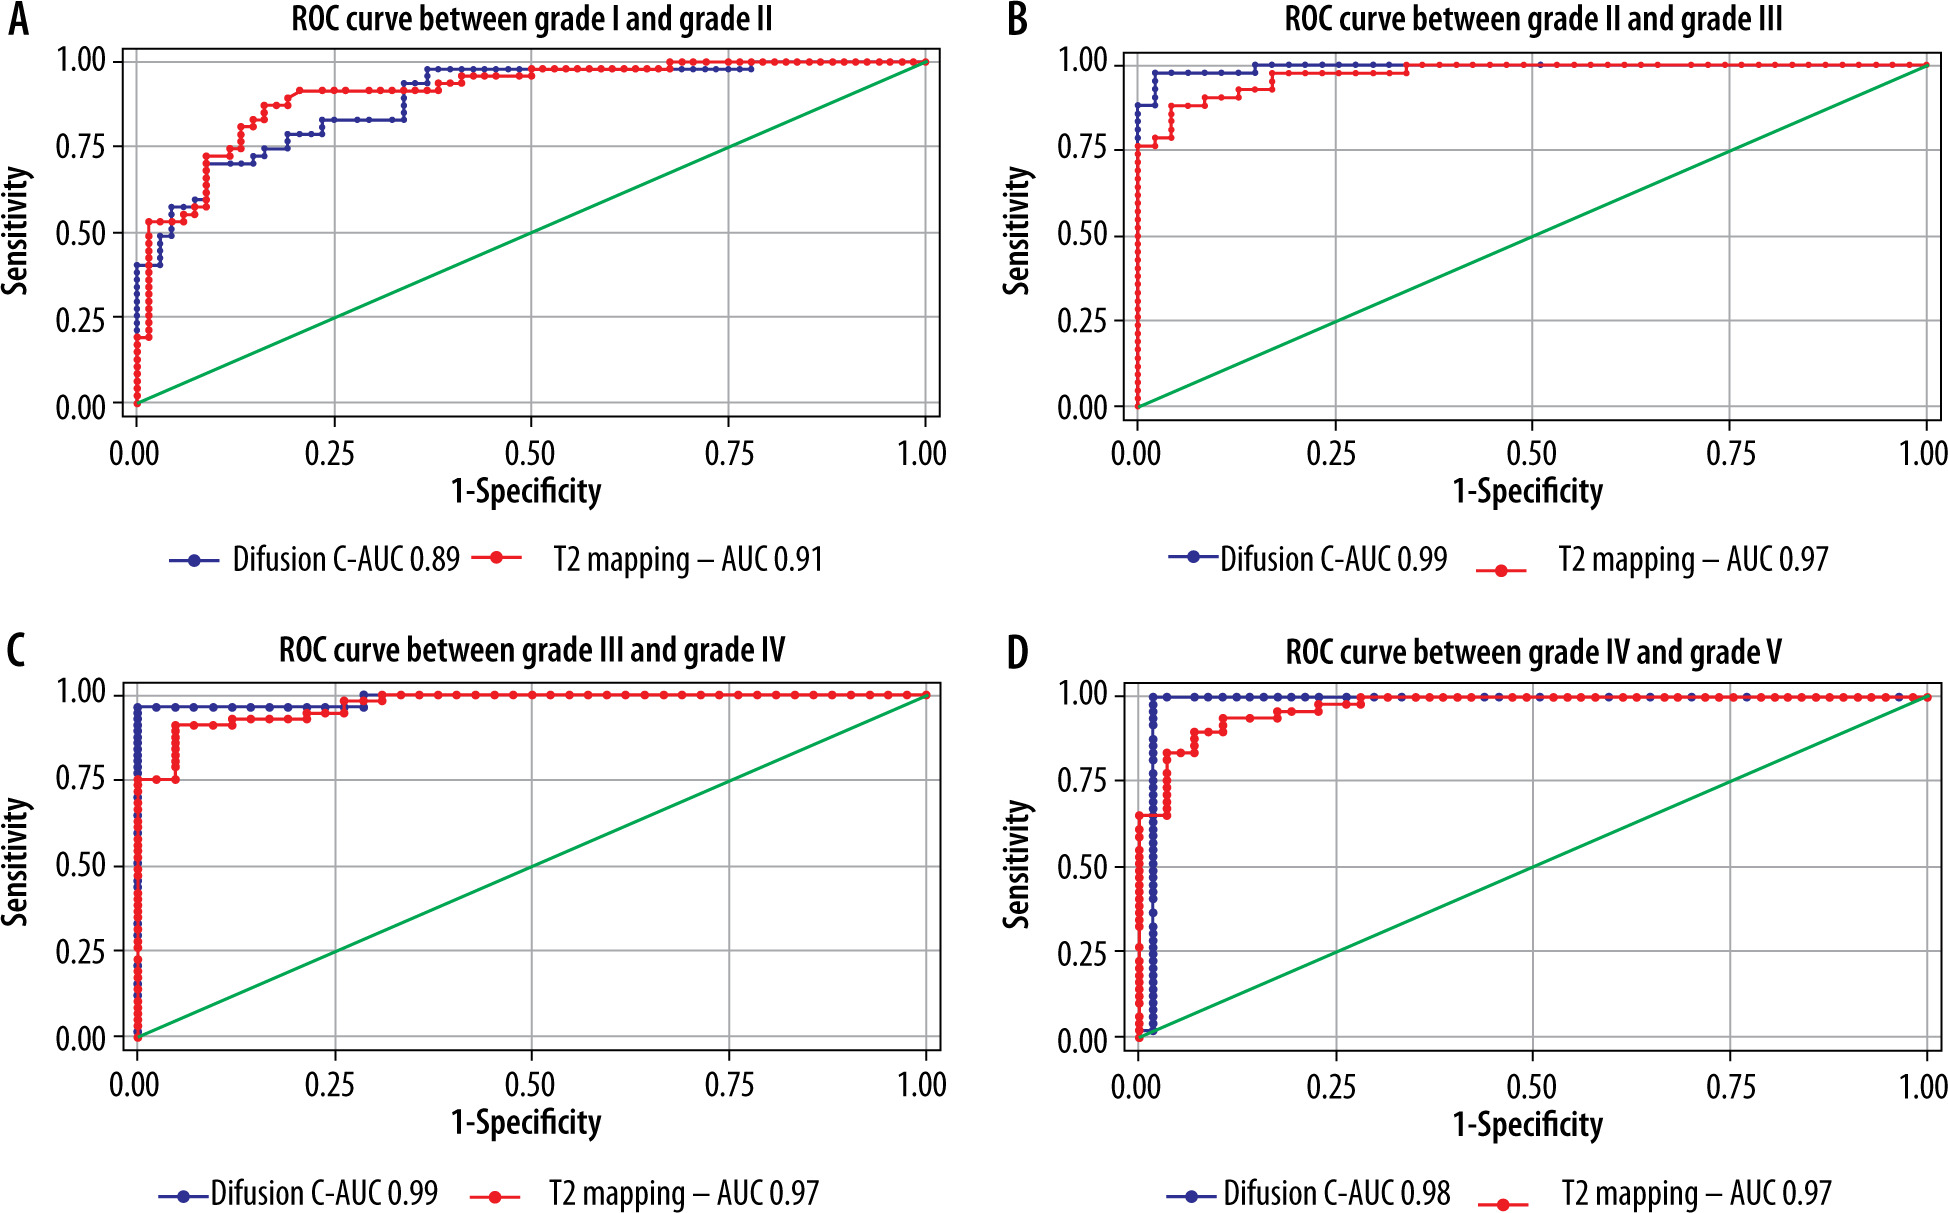
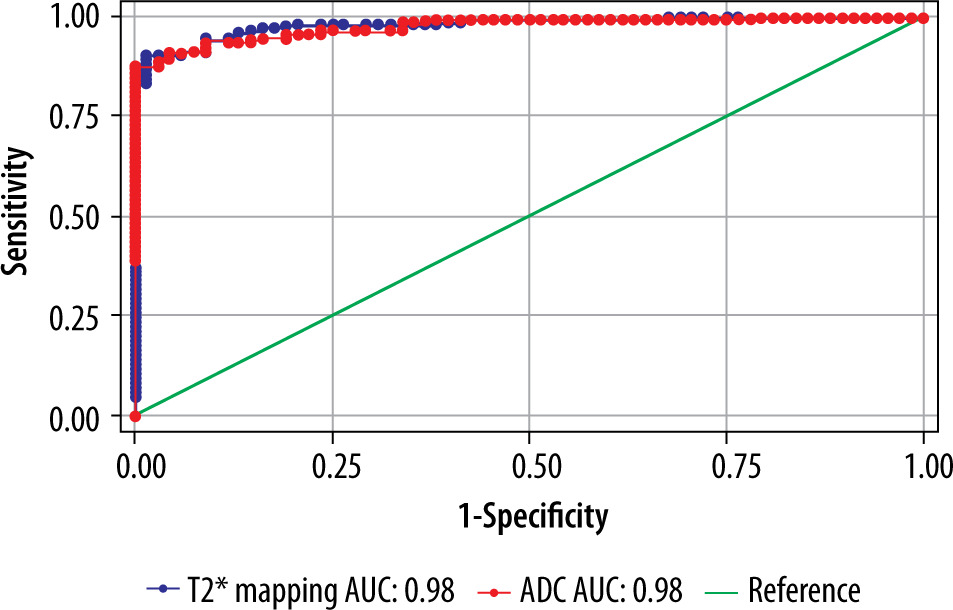
The cut-off value of ADC (Table 6) and T2* (Table 7) in the central region for grades I to V were significant (p < 0.001). The area under the curve (AUC) was within the moderate to high accuracy range (0.8 to > 0.9) for ADC and the high accuracy range (> 0.9) for T2* values (Figure 9). The sensitivity of the T2* value increased from grade I to grade V. A statistically significant marginally stronger negative correlation of T2* values (r = –0.96) for central and peripheral) and strong negative correlation of ADC values (r = –0.95) for central and peripheral) with MPG was noted (Table 8). Overall, AUC for both ADC and T2* values were in the high accuracy range (0.98), irrespective of different grades (Figure 10).
Table 6
ADC central cut-off (× 10-6 mm2/s), sensitivity, specificity, AUC (area under the curve), and p-value between different MPGs
Table 7
T2* central cut-off (ms), sensitivity, specificity, AUC (area under the curve), and p-value between different MPGs
Table 8
Correlation between MPG and different parameters (ADC and T2*) in the total discs
| Parameter | Correlation coefficient (r) | p-value* |
|---|---|---|
| ADC | ||
| Central | –0.95 | < 0.001 |
| Peripheral | –0.95 | < 0.001 |
| Entire disc | –0.95 | < 0.001 |
| T2* | ||
| Central | –0.96 | < 0.001 |
| Peripheral | –0.96 | < 0.001 |
| Entire disc | –0.96 | < 0.001 |
Discussion
DWI/ADC and T2* mapping are new diagnostic QMRI techniques that analyse microstructural differences in PG in IVD, based on water content with its mobility and diffusion, collagen architecture, and their interactions at various stages of LDDD, which is overlooked with subjective interpretation of conventional MRI [20]. According to the KIRKALDY-WILLIS stages of disc degeneration [30], early LDDD begins between ages 15 and 45 years, which was corroborated in our study which included young adults in the early stages of physiological IVD degeneration, making them an ideal population to study ADC and T2* changes.
We found a significant negative correlation (p < 0.01) between age and mean ADC (r = –0.34 to –0.70) and T2* (r = –0.38 to –64) values of NP and AF for DDs, with a reduction in ADC and T2* values noted with increasing age of the patients. Niu et al. reported a statistically significant inverse correlation between mean ADC (r = –0.37) and T2 relaxation (r = –0.77) values of NP and age in a study of 37 asymptomatic volunteers [31]. Abou Khadrah et al. also found a statistically significant negative correlation for NP between T2 mapping (r = –0.255) and ADC (r = –0.193) values with age in their study of 300 pathological discs [32]. We did not find a significant difference between males and females in grades of LDDD or ADC/T2* values, similarly to the findings reported by Abou Khadrah et al. and Xiong et al. [32,33].
Shen et al. studied 200 normal discs and reported higher mean ADC and T2* values of NP compared to AF, which matched with our study for normal discs [24]. The diffe-rences in these values of various ROIs in normal discs closely coincided with the biochemical characteristics of discs with high ADC and T2* values in mid NP due to high PG, water content and low values in AF due to decline in water content but higher collagen fibre in peripheral AF [24]. This can be used to effectively monitor water molecule activity using ADC values and biochemical changes utilizing T2* mapping values in NP. T2* and ADC values of NP and AF for normal discs showed a gradual decrease from cranial to caudal disc levels, similar to the study by Kealey et al. of 210 discs in 44 subjects, which reported lower ADC values in caudal than in cephalic discs [25]. However, Shen et al. reported higher T2* and ADC values for lower lumbar than upper discs [24].
We found that T2* and ADC values of NP, AF, and the entire disc decreased with increasing MPG of LDDD, with significant negative correlation (p < 0.001), which is in concordance with a study by Xiong et al., which reported significantly decreased T2* and ADC values of NP and AF, and statistically significant negative correlation with increasing Pfirrmann grades (grade I-V) [33]. Niu et al. also found statistically significant negative correlation between ADC values of NP and inner AF with increasing Pfirrmann grades from grade I-V [31]. Kealey et al. found that ADC values of DDs reduced by 9% as compared to normal discs. This reduction in ADC values in DDs is sensitive to a gradual decrease in water content leading to reduced water molecule diffusibility in NP, as explained in various studies [25,31,34,35]. To the best of our knowledge, ours is the first study of DWI/ADC evaluation of IVD using the MPG system. Abou Khadrah et al. reported increased mean ADC values in grade V after a significant decrease in grades from I-IV [32]. Niu et al. and Abou Khadrah et al. both reported decreased T2 mapping values with increasing Pfirrmann grades except for grade V [31,32]. We did not find any such deviation in our study, which showed decreasing T2* values with increasing degenerative grades. Wang et al. studied 256 discs and reported significant statistical correlation of T2 relaxation values from grades I-V with no apparent difference of values between grades V-VIII of MPG [36]. Although we found the difference in T2* values to be statistically significant for these grades, it was less so for MPG V-VIII (Figure 6).
T2* mapping does not differ extensively from T2 mapping, and it depicts the same microstructural changes within IVDs with shorter imaging time; however, T2* is more likely to be affected by susceptibility field artefacts. Yang et al. described a strong fundamental correlation between relaxation times of T2 and T2* because both are associated with PG and water content [37]. T2 relaxation times that correlate with the structural integrity of IVDs show differences in different ROIs of disc and reduction in DD across grades due to dehydration and variations in biochemical compositions like reduced water and glycosaminoglycan content in various stages of degeneration [38-40].
Abou Khadrah et al. found statistical significance for the T2 cut-off value only between grade II/III and grade III/IV, and for the ADC cut-off value only between grade III/IV [32]. However, we found statistically significant T2* and ADC cut-off values under the ROC curve for grades I/II, II/III, and III/IV as well as grade IV/V (Tables 6 and 7). The AUC values for combined ADC and T2* in the study were within the high accuracy range (0.98) irrespective of grades, indicating that both ADC and T2* value-based grade scales are suitable for assessing the degree of early degeneration of IVD at the biochemical level with a high degree of accuracy as a comparison to conventional subjective MPG. The AUC for ADC and T2* values for grade I and II, which was found to be in the moderate (0.89) and high accuracy range (0.91), respectively, indicating that the T2* value-based grade scale is slightly better at evaluating degeneration of grade I/II level. ADC appears to be slightly more accurate (ranging from 0.98 to 0.99 for grade II-V) than the T2* value (0.97 for grade II-V) in evaluating degeneration from grade II-V. Takashima et al. reported moderate accuracy and intermediate level of reliability for T2 cut-off value-based grading [41].
We have concentrated more on early disc degenerative grades (II-V) because T2* and ADC values hold significance in detecting the biochemical changes in early LDDD with no significance in advanced degenerative grades where pathology has already progressed to a severe level of degeneration due to extreme biochemical imbalance associated with morphological changes like reduced disc height with/without disc bulge or herniation [21].
The signal strength of T2WI in IVDs has been found to correlate with ADC values. Previous research proves that decreased diffusion was associated with reduced nutrient supply in LDDD [25]. Accordingly, ADC mapping could reflect subtle changes in the integrity and composition of early IVD degeneration. The T2* value detects both rotational and translational motion of water molecules in the collagen matrix [22-24]. The ADC value cannot detect the microscopic translational motion of protons and only measures isotropic diffusion [29]. Compared to the ADC value, the T2* value appears more accurate in determining water and collagen content, which explains the better performance of T2*-based grade scale at grade I/II for distinguishing normal from grade II MPG. The key finding of our study is that both T2* and ADC value-based grade scales are useful for evaluating grades of IVD degeneration with high objectivity in comparison to the visual assessment-based MPG system as measured by AUC, with the T2* value having slightly greater accuracy in differentiating grades I and II.
Many new therapeutic options like dietary supplementation (oral glucosamine), intradiscal injectables (glucosamine and chondroitin sulphate with dimethylsulfoxide and hypertonic dextrose or recombinant protein consisting of amino acid sequence blocks), cell-based reconstructive techniques (direct injection of growth factors or cytokine inhibitors), and autologous IVD cell implantation with gene therapy are available for NP augmentation [12,27]. Therefore, advanced imaging techniques are important to diagnose early stages of disc degeneration.
The primary limitation of our study was the lack of inter-observer variability and repeatability, because one reader defined the ROIs and obtained ADC and T2* values. Manual demarcation of ROI to cover the interior portion of IVD might have introduced subjectivity and bias. No histological correlation of ADC and T2* values was obtained with various disc degenerative grades. The study did not consider loading conditions of IVD, potential diurnal variations, and other influencing elements, including exercise, mechanical stress, obesity, smoking, and hereditary factors for LDDD.
Conclusions
ADC and T2* mapping serve as a sensitive non-invasive evaluation method for biochemical condition of NP and AF for both normal discs and DDs which show reduced mean values. ADC and T2* maps can be added to conventional MRI without substantially lengthening exam times, as potential imaging markers for qualitative and quantitative information on microstructural changes in early LDDD, helping in the early diagnosis and better management of LDDD.