


Introduction
Diffusion kurtosis imaging (DKI) is an MRI method related to diffusion imaging (DWI) evaluated by a non-Gaussian approach to calculate diffusion of water in tissues. The theoretical basis emphasizing this method, as reported by Jensen et al. [1], is an assumption that non-Gaussian analysis can reveal the presence of natural barriers in tissues, such as cell membranes and organelles, implying an advantage over the Gaussian diffusion model applied in DWI. However, for differences between the two models, it is necessary to acquire ultra-high values of b-value (> 1,000 s/mm2).
DKI has been analyzed in several studies to detect and stage liver fibrosis [2]. While many papers have concentrated on different aspects of hepatocellular carcinoma (HCC) [3-7], only limited studies have focused on the differentiation of liver focal lesions. In regard to malignant liver lesions being distinguished from benign ones, we were able to find two studies only. Jia et al. showed that ADC- and DKI-derived parameters allow HCC to be differentiated from focal nodular hyperplasia (FNH), hemangioma, and HCA; however, metastases were not included in that study [4]. In turn, in a study performed by Budjan et al., a standard DWI protocol with the highest b-value of 1,000 s/mm2 was applied in calculating DKI parameters [8], though in line with the method’s concept, it would be beneficial to apply still-higher values (up to b-value = 2,000 s/mm2).
On that basis, in the present paper, we sought to assess whether DKI applying ultra-high b-values may have an advantage over DWI technique in differentiating benign and malignant liver lesions.
Material and methods
Study population
The study protocol was approved by the local ethics committee (Bioethical Commission at the Maria Sklodowska-Curie National Research Institute of Oncology; approval number 11/2017), and informed consent was obtained from all patients prior to examination. Between 2017 and 2020, the study group was acquired prospectively, and consisted of 83 patients (female, n = 45; male, n = 38; age range, 23-85 years; median age, 61 years) referred consecutively for MRI of the liver due to suspected liver tumor. Criteria for inclusion were age over 18, a suspicious liver mass, no prior oncological treatment, and consent to participate in the study. Exclusion criteria were contraindications to MRI. Within the cohort, a total of 95 liver lesions were found, of which 31 were diagnosed as benign (9 FNH, 4 regenerative nodules [RN], and 18 hemangiomas), while 59 lesions were malignant (11 intra-hepatic cholangiocarcinomas [iCCA], 10 HCCs, and 38 metastases). The diagnosis of benign lesions was based on typical MRI characteristics and 12-44 months of follow-up. In malignant masses, 6 HCCs were diagnosed on the basis of LI-RADS criteria (LR5 lesions) [9], whereas in remaining lesions, the diagnosis was based on biopsy and histopathological examination.
MRI protocol
MRI examinations were performed on a 3T MR system (MAGNETOM Skyra, Siemens Healthcare, Erlangen, Germany), with an 18-channel phased array body coil in combination with a 32-channel spine coil. Within a standard liver tumor diagnosis in MRI protocol, a spin-echo echo-planar DKI sequence was done, with acquisition of seven b-values, including 0, 200, 500, 750, 1,000, 1,500, and 2,000 s/mm2 in the axial plane. Details of the DKI sequence are shown in Table 1. The remainder of protocol consisted of sequences T2 HASTE, T2 HASTE fs, T2 TSE fs, Trufisp, VIBE Dixon, CE Twist VIBE Dixon with 70 min delayed phase after administration of hepatobiliary contrast (Multihance, Bracco Imaging Deutschland GmbH, Germany).
Image analysis
Image analysis were obtained using a scanner dedicated workstation, syngo.via (Siemens Healthcare, Erlangen, Germany). Quantitative data were acquired by three board-certified radiologists (JP, PK, and BG). Regions of interest (ROIs) were located in each liver tumor on a b-value = 750 image, with regions of necrosis or hemorrhage avoided. The regions were copied to all DKI b-value images, with ROIs data (mean signal intensity [SI] and standard deviation [SD]) extracted for further analysis.
Calculation of DWI and DKI parameters
The calculation of parameters was achieved with GNUPLOT software (version 5.0, patch level 4), while function fitting was done using a non-linear least squares (NLLS) Marquardt-Levenberg algorithm.
The respective formula used in calculating DKI and ADC parameters were as follow:
ln [S(b)/S(0)]= –b × DK + 1/6 × b2 × DK × K (1)
ln [S(b)/S(0)]= –b × ADC (2)
ADC was calculated for all acquired b-values (ADC0-2000), and for the following selected three values: b = 0, 500, and 750 (s/mm2) (ADC0-500-750).
Statistical analysis
Statistical calculations were performed using R environment (version 3.3.2, R-Foundation, Austria) [10]. Differences at p < 0.05 were considered statistically significant. Data were verified for normality of distribution using Shapiro-Wilk test. Wilcoxon rank-sum test was applied to compare DKI and ADC parameters calculated for benign and malignant liver lesions. For all parameters, ROC curves were plotted, sensitivity, specificity, and accuracy were calculated, and cut-off points were determined using Youden criterion.
Results
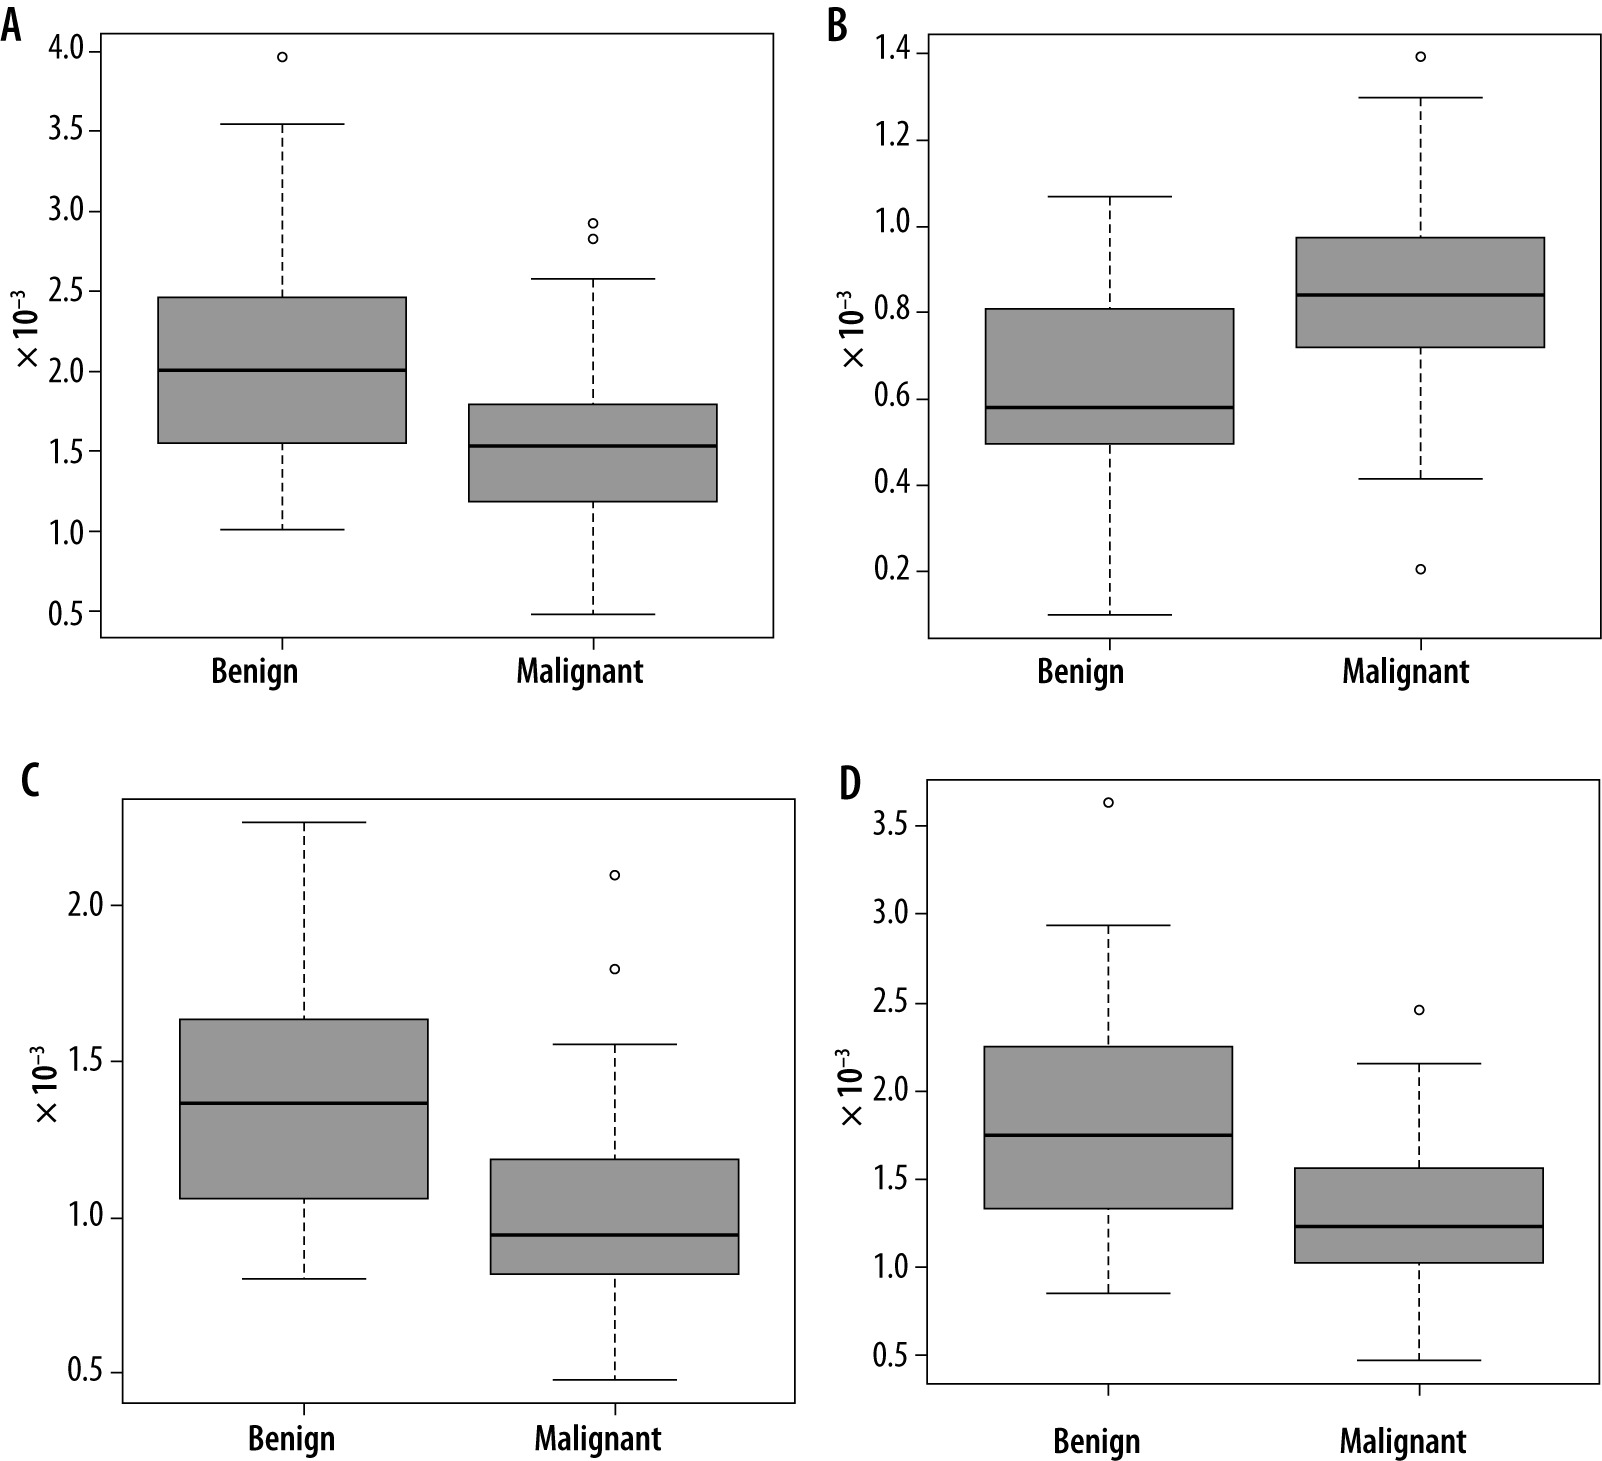
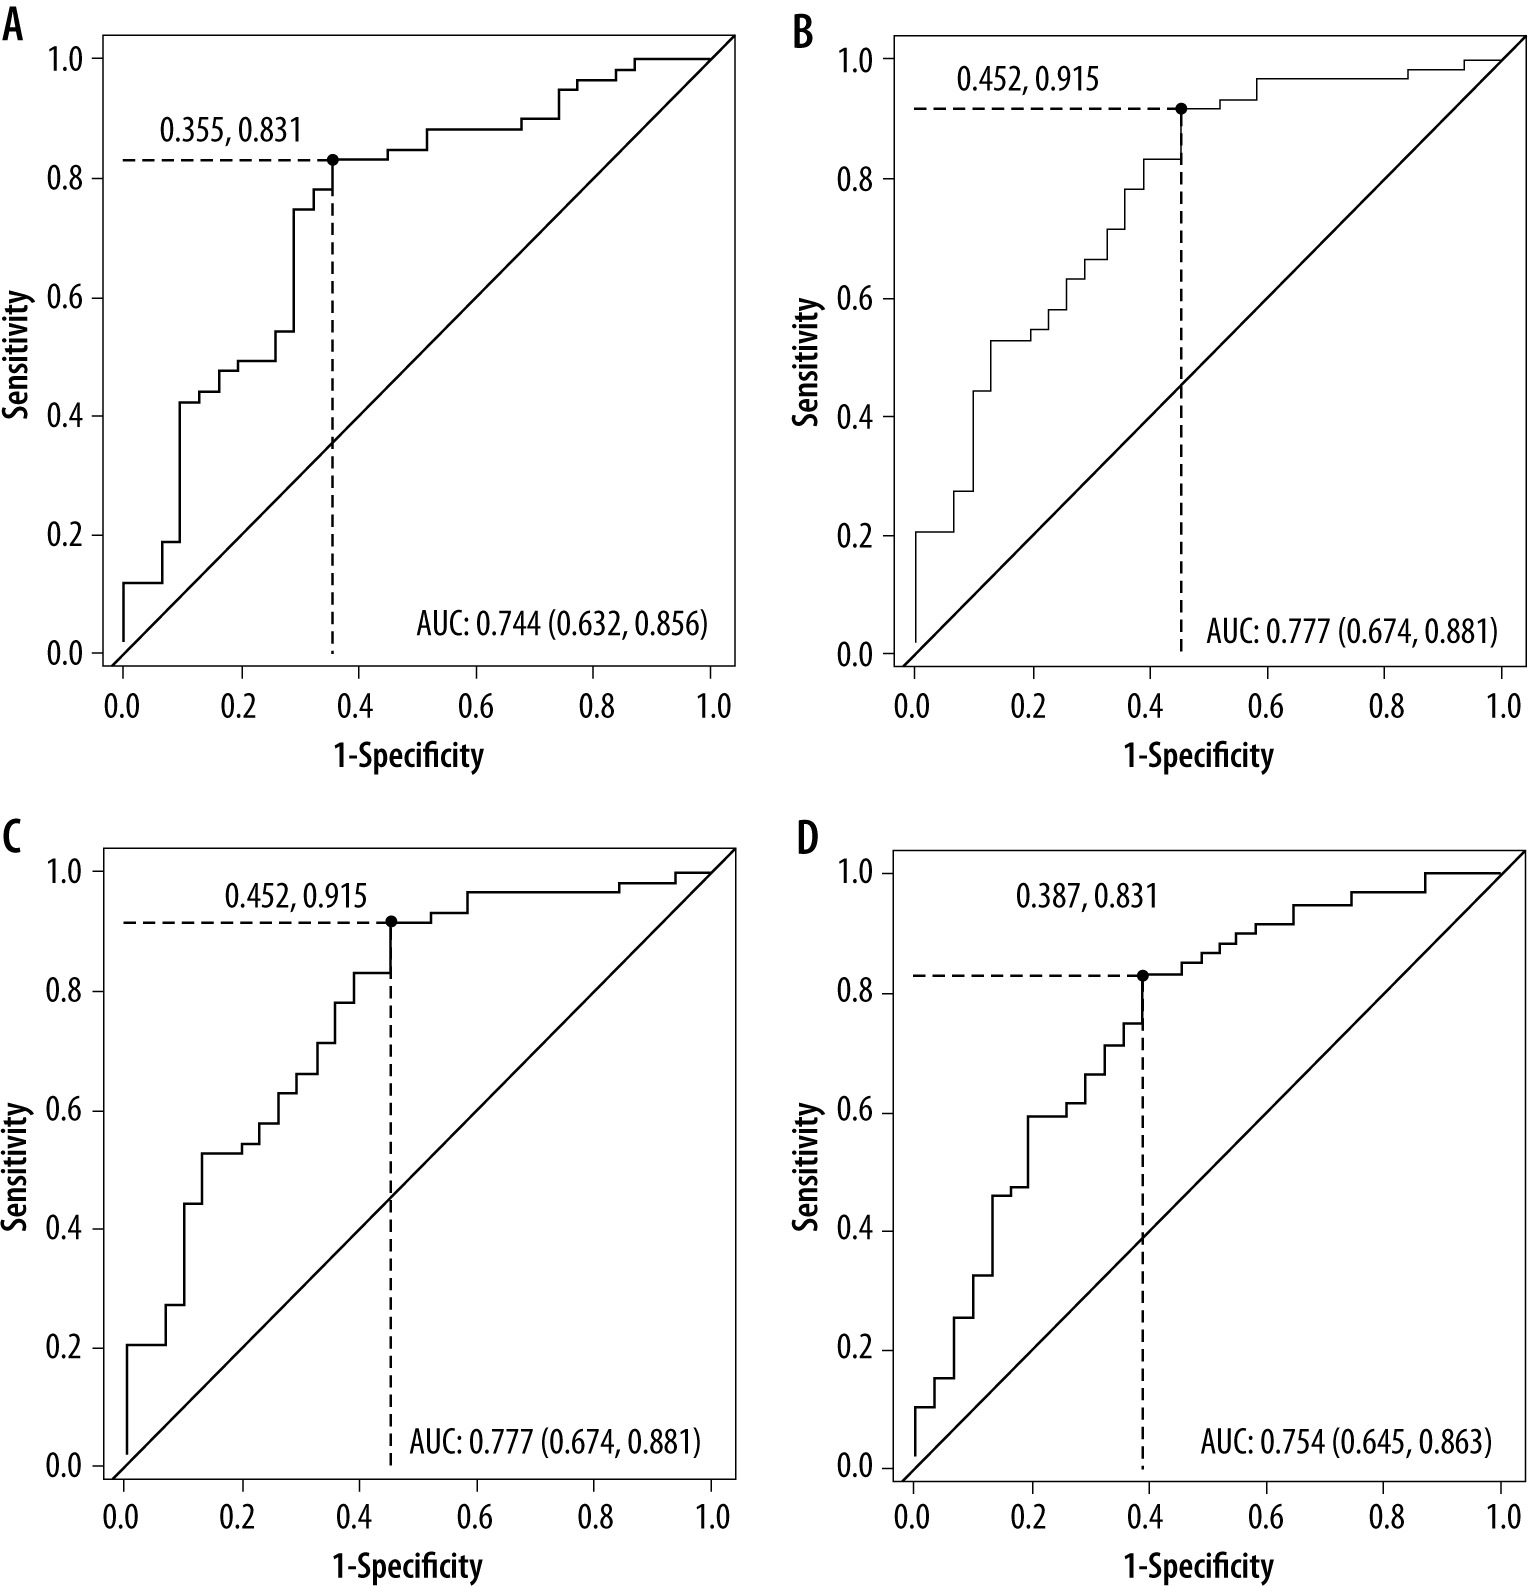
Significant statistical differences between benign and malignant lesions were obtained for all DKI and ADC parameters. Obtained results are shown in Table 2. Ana-lysis of the ROC curves showed that for parameter DK, AUC was 0.74, while for parameters K, ADC0-2000, and ADC0-500-750, it was 0.77, 0.77, and 0.75, respectively. The highest sensitivity (0.91) was obtained for the ADC parameter calculated on the basis of seven b-values (range, 0-2,000 s/mm2). The highest specificity (0.65) was obtained for the K parameter, with the highest accuracy of 0.80. Detailed results of the ROC curve analysis are demon-strated in Table 3. These indicate that the DKI technique yields results that are statistically comparable with those using the DWI technique (Figures 1 and 2).
Table 2
Differences between benign and malignant liver lesions presented as median ± standard deviation. Bolded values for probabilities indicate differences between the two groups, achieving statistical significance
| Parameter | Benign lesions | Malignant lesions | p-value |
|---|---|---|---|
| DK | 2.01 ± 0.75 | 1.53 ± 0.53 | 0.00015 |
| K | 0.58 ± 0.21 | 0.84 ± 0.25 | 0.000033 |
| ADC0-2000 | 1.37 ± 0.39 | 0.93 ± 0.25 | 0.000017 |
| ADC0-500-750 | 1.75 ± 0.64 | 1.23 ± 0.42 | 0.000081 |
Table 3
Receiver operating characteristic (ROC) curve analysis for all parameters
| DK | K | ADC0-2000 | ADC0-500-750 | |
|---|---|---|---|---|
| AUC | 0.74 | 0.77 | 0.77 | 0.75 |
| Sensitivity | 0.83 | 0.88 | 0.91 | 0.83 |
| Specificity | 0.64 | 0.65 | 0.55 | 0.61 |
| Cut-off | 1.88 | 0.65 | 1.32 | 1.64 |
| Accuracy | 0.77 | 0.80 | 0.79 | 0.76 |
Discussion
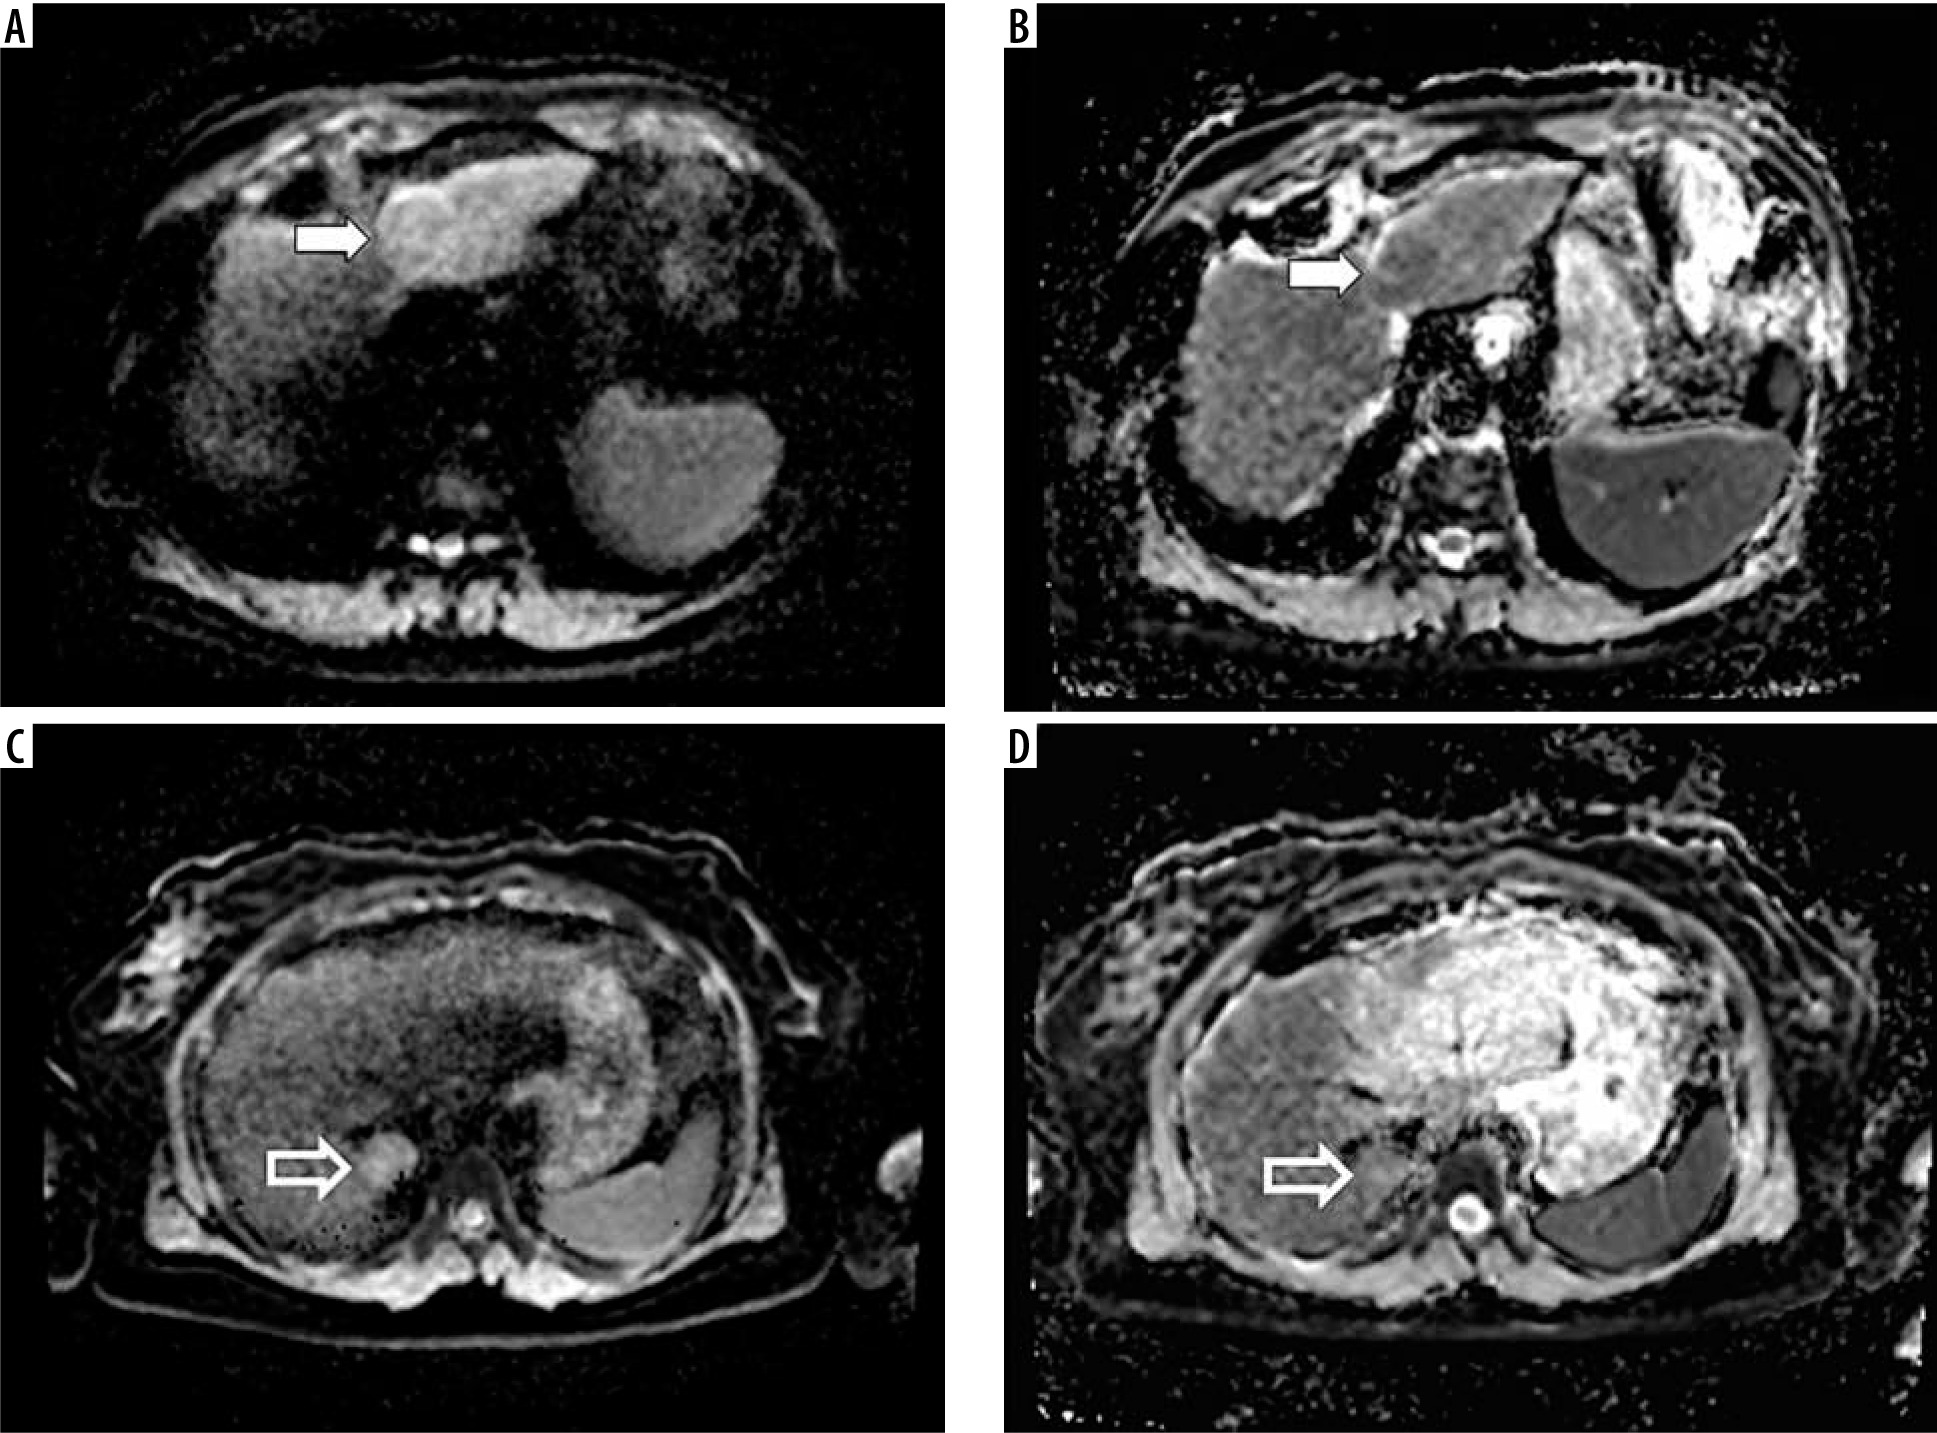
In the current study, ADC and DKI parameters were investigated for their ability to differentiate between malignant and benign lesions of the liver (Figure 3). All the para-meters showed significant differences; however, K and ADC calculated for seven b-values achieved the greatest accuracy. DK and ADC calculated for three b-values demonstrated a slightly worse performance. DKI reflects the deviation from a Gaussian distribution to characterize tissue diffusion. It is used increasingly more replacing conventional DWI for more accurate provision of information on tissue characteristics.
Figure 3
ADC maps created with different sets of b-values, ADC0-500-700 and ADC0-2000. Images (A) and (B) present hepatocellular carcinoma located in the left liver lobe (white arrow), and images (C) and (D) show focal nodular hyperplasia located in the posterior part of the right liver lobe (open arrow)
However, the number of studies, in which this method has been used within the liver, remains relatively small. Our results are consistent with those obtained by Jia et al., who showed that ADC- and DKI-derived parameters K and D were able to distinguish HCC from FNH, heman-gioma, and HCA, even as there was no evidence for D or K being superior to ADC [4]. Different from our work, metastases were not included in that study group.
While our study included seven b-values, with 2,000 s/mm2 being the highest applied, there have also been attempts to obtain DKI data from a standard DWI protocol, with b-values of maximum 1,000 s/mm2. In such a setting, Bujdan et al. found no additional value of DKI over ADC regarding the difference between benign and malignant liver lesions [8]. Interestingly, cysts and hemangiomas were included in that study, while metastases were not. Based on the results of other studies and our previous experience, we presume that acquisition of b-values greater than 1,000 is necessary for DKI data to be obtained, which is time-consuming due to necessity of a significantly greater number of signal averages used in case of high values. However, by reducing and selecting appropriate b-values, the sequence time can to shorter [11].
Most studies performed in this field considered HCC and liver fibrosis. Goshima et al. compared DKI and DWI to assess the viability of HCC following loco-regional treatment, and demonstrated that sensitivity, specificity, and AUC values were all superior with K than ADC. In contrast, ADC was observed to be more useful in assessing liver parenchyma [6]. Wang et al. found K useful in the detection of micro-vascular involvement of HCC [5].In a study by Cao et al., K proved capable of offering mo-derate diagnostic efficacy (AUC = 0.77) in the recognition of micro-vascular invasion, while compared with ADC, there was a greater specificity in the identification of tumor grade [7]. Regarding liver fibrosis, Yoon et al. reported that K exhibited significantly greater values in clinically significant fibrosis, while ADC failed to show statistically significant differences [12]. Similar conclusions were drawn by Yoshimaru et al., who demonstrated how K and D derived from DKI correlated significantly with the extent of hepatic fibrosis staging. In this study, ADC showed significant differences between cirrhotic and non-cirrhotic groups of patients, despite no capacity to differentiate between particular stages of the fibrosis [13]. Likewise, Xie et al. found that D derived from DKI differed from ADC in correlating better with liver fibrosis stages [14]. Zhang et al., who investigated liver metastatic disease showed that low pre-treatment ADC and DK as well as high K are independent factors associated with a good response to chemotherapy in colorectal liver metastasis. Among all the parameters tested, ADC exhibited the greatest AUC and was consi-dered the best predictive parameter [15].
In regard to benign and malignant lesions distinguished from each other in other organs, studies have confirmed the superiority of DKI over DWI, but with moderate differences. For example, in breast cancer, K and D showed significantly greater specificity than ADC (83% and 83% vs. 76%, respectively) [16], while in prostate cancer, K emerged as significantly better compared with ADC or D (93.3% vs. 78.5% and 83.5%) [17].
The present study has certain limitations. First, as there is lack of standardization of the DKI protocol, data from other studies were not readily comparable with ours. Moreover, all parameters were calculated with reference to ROI data, something that is not feasible in day-to-day practice. Comparison with data acquired through mapping would bring the results closer to clinical use. Certain examinations (in the left lobe of the liver, in particular) were impaired by motion of artefacts from the heart and diaphragm.
Finally, as the above data were all derived from a single MRI system, applicability should be verified regarding alternative MRI systems. It may be also concluded that DKI represents a further feature in the evaluation of hepatic lesions, even if our results indicate little advantage over the widely-used DWI.