


Introduction
Colorectal cancer (CRC) is one of the most common malignancies in the world. Nowadays many treatments are available to help control CRC, including surgery, radiation therapy, interventional radiology, and drug treatments such as chemotherapy, targeted therapy, and immunotherapy. Due to the development of these therapies in recent decades, the mortality rate of CRC has decreased [1]. On the other hand, the incidence of CRC is increasing in the general population, especially in those younger than 40 years old [2]. The prognosis of CRC patients is largely dependent on local tumour extent and the presence of distant metastasis. Staging helps determining what treatments are most appropriate for each patient. Staging tests may include imaging procedures such as abdominal, pelvic, and chest computed tomography (CT) scans and magnetic resonance (MR) imaging examinations [1]. The stages of CRC are indicated by Roman numerals that range from 0 to IV, with the lowest stages indicating cancer that is limited to the lining of the inside of the colon. By stage IV, the cancer is considered advanced and has spread (metastasized) to other parts of the body [1]. In those metastatic cases, the liver is the most frequently involved organ [3,4] followed by lung, distant lymph nodes, peritoneum, and ovary. The prognosis of CRC is largely dependent on the early detection of colorectal liver metastases (CRLM) [4].
Multidisciplinary team (MDT) collaboration is crucial for optimal treatment planning and may improve outcome and overall survival. It should include surgeons (experienced in colorectal, liver, and lung surgery), medical oncologists, diagnostic and well and interventional radiologists, and pathologists, who determine how to optimally diagnose and treat each patient with CRC. Several publications have demonstrated that an MDT meeting is associated with improved survival for patients with CRC with liver or lung metastasis [5,6].
Evaluation of the performance of CT and MR imaging for the detection of liver metastases shows that MR imaging including diffusion-weighted imaging and liver-specific contrast agents provide the best performance [7-10].
The purpose of this article is to illustrate the significance of imaging features of colorectal liver metastases during systemic therapy using radiopathological correlations. Specific presumptions and practical aspects of evaluating responses according to the Response Evaluation Criteria in Solid Tumours (RECIST) criteria 1.1 are discussed [11]. Furthermore, examples of possible CRLM systemic treatment response observed in CT and MR imaging including tumour necrosis, apparent diffusion coefficient (ADC) values, tumour calcification, tumour fibrosis, intratumoural fat deposition, and disappearing liver metastases are described. These changes are inseparably related to pathological alterations and have prognostic value [10].
Oligometastatic disease (OMD) is a state of disease with limited metastatic tumour burden. It should be distinguished from polymetastatic disease due the potential curative therapeutic options of OMD [12]. Imaging plays a pivotal role in the diagnosis and follow-up of patients with OMD, especially in conversion therapy. The goal of conversion therapy is to transform unresectable lesions or potentially resectable lesions into resectable, and to obtain prolonged patient survival [13].
Tumour response assessment with RECIST criteria 1.1
The Response Evaluation Criteria in Solid Tumours (RECIST) were developed in 2000, based on the original World Health Organization (WHO) guidelines first published in 1981. They were created due to the growing need to share experiences on cancer assessment and ways of reporting results between medical centres [14]. After several years of practical application of the RECIST criteria, Eisenhauer et al. [11] published the updated and recommended version 1.1 of the RECIST criteria, which are currently the standard for evaluating responses in clinical trials.
In 2009, revisions (RECIST 1.1) incorporated the following major changes:
reduction of the number of target lesions;
a new measurement method to classify lymph nodes as pathologic or normal;
the clarification of the requirement to confirm a complete response (CR) or partial response (PR) and new methodologies for more appropriate measurement of disease progression [11].
Measurable lesions
According to the RECIST criteria 1.1, to consider the lesion as measurable, its longest dimension measured on the CT axial imaging plane must exceed 10 mm. Contrary to other measurable changes, lymph nodes are measured along the short axis. Observation indicates that during treatment the size of the lymph node changes more often in short axis while its length remains the same [15]. Moreover, lymph nodes are visible among the anatomical structures in diagnostic imaging studies also in physio-logical conditions, and – according to RECIST 1.1 criteria – reaching up to 10 mm in the short axis, are not considered as enlarged. Lymph node metastases can only be considered as measurable if their shortest dimension exceeds 15 mm [14]. There is no need to monitor all the visible changes. According to the classification, RECIST 1.1 sums up the dimensions together for further evaluation of 5 maximal and most suitable measurable lesions [16]. RECIST assigns 4 categories of response: CR, PR, stable disease (SD), and progressive disease (PD) [11]. The discussed criteria of response evaluation are summarized in Table 1.
Table 1
Categories of the responses of measurable changes
Non-measurable lesions
Disease outbreaks less than 10 mm or lesions not meeting the minimum size criteria for measurable lesions, including enlarged lymph nodes, measuring in the short axis between 10 and 15 mm, are classified as non-measurable lesions [14]. The response of measurable and non-measurable lesions is assessed in subsequent studies adequately to the adopted method for a given lesion in baseline study [14]. On the contrary, for measurable changes, it is not necessary to provide the dimensions of the non-target lesion. The status is defined in subsequent tests as “present”, “absent”, or “undergoing unequivocal progression” [11]. Multiple non-measurable focal lesions with a similar morphology located in one organ cannot be indicated individually and must be counted as multiple liver metastases [14]. During the observation, the response of non-measurable changes is reported as CR, PD, or response not falling into the above-mentioned categories and determined as “non-PD and non-CR” [11]. The discussed criteria of response evaluation are summarized in Table 2.
Table 2
Categories of the responses of non-measurable changes
Regardless of the response to measurable and non-measurable lesions, the occurrence of a new lesion – regardless of its size – is considered as disease progression. During each measurement, the current dimension of all observations should be provided, even it is less than 10 mm [16]. To evaluate the overall answer, preferably measurable lesions are indicated. However, RECIST criteria 1.1 only allow an assessment based on non-measurable lesions [16]. In that case, the appearance of a new lesion or unequivocal progression of non-measurable lesions classifies the response as PD. In the absence of evaluation of all the described lesions, the response cannot be determined, and it is considered as “not-evaluable”. In other cases, the overall answer is classified according to the assessment of non-target changes (as CR or not-CR/non-PD) [15,16].
The benchmark for evaluating responses in clinical trials and clinical practice is the RECIST 1.1 criteria [17]. They make it possible to track the efficiency of cancer treatment and make it easier for treatment facilities to communicate with one another. The subjective evaluation of the response of immeasurable lesions and the correlation of the RECIST response with the actual clinical benefit in the case of using new anticancer treatments like anti-angiogenic therapy or immunotherapy remains a contentious issue despite the consideration of alternative imaging techniques and the decrease in the number of measurable lesions.
In 2010, modified RECIST (mRECIST) criteria were proposed as a way of adapting the RECIST criteria to assess treated hepatocellular carcinoma (HCC) [18]. Nowadays, mRECIST has become the standard tool for the measurement of radiological endpoints at early/intermediate stages of HCC. mRECIST has been proven to capture higher objective response rates in tumours treated with molecular therapies, and those responses have shown to be independently associated with better survival [19].
In 2017 the RECIST working group published a modified set of response criteria, immune RECIST (iRECIST) for immunotherapy [20]. The new iRECIST allow a standardized response evaluation within the framework of clinical trials, considering the relatively rare but clinically significant possibility of pseudo progression within the framework of modern oncological immunotherapies [20].
RECIST 1.1 are currently described as a gold standard in differing response classification because of their simplicity and objectivity. However, it has been stated that “RECIST is simple but using RECIST is not” [14]. Moreover, RECIST classification has some disadvantages. The pattern of side effects after treatment on radiological assessment might be different. Human mistakes come from incorrect assessment of the tumour, especially in necrosis when the dimension of the tumour does not change. What is more, richly vascularized lesions reduce their vascularization during treatment, but not the dimen-sion that imitates regression in radiological assessment [14]. RECIST criteria are more tumour-centric than patient-centric, which results in not taking patient symptoms into evaluation. Nonetheless, RECIST classification is the most widely accepted methods to objectively assess response to applied therapies.
Tumour response assessment based on the other criteria
Tumour necrosis
Untreated CRLM is said to be susceptible to tumour hypoxia-induced necrosis due to limited blood supply [21]. Acinar necrosis, sometimes known as “dirty necrosis”, is a kind of necrosis that has patches of nuclear debris that are surrounded by healthy cells. On the edge of the lesion, where most live cells are found, the blood circulation is still present. Because a significant quantity of necrosis prevents the medications from penetrating the lesion, this form of necrosis may also be seen in metastases that do not respond to preoperative chemotherapy [22]. “Infarctlike necrosis” (ILN) is caused by chemotherapy and is characterized by sizable confluent regions of necrosis surrounded by fibrosis [23]. This type of necrosis is seen in lesions that have responded well to chemotherapy, and it is typically accompanied by a decrease in tumoural cell number and a certain amount of fibrosis. More infarct-like necrosis is visible in patients receiving chemotherapy regimens containing bevacizumab than in individuals receiving standard chemotherapy. In assessing the histological response to chemotherapy, it has been proposed that infarct-like necrosis may be similar to fibrosis [24]. Haemorrhagic necrosis is a type of necrosis that is more uncommon. Its connection to chemotherapy has not been established, and it is due to the burst of tumour blood vessels in necrotic areas.
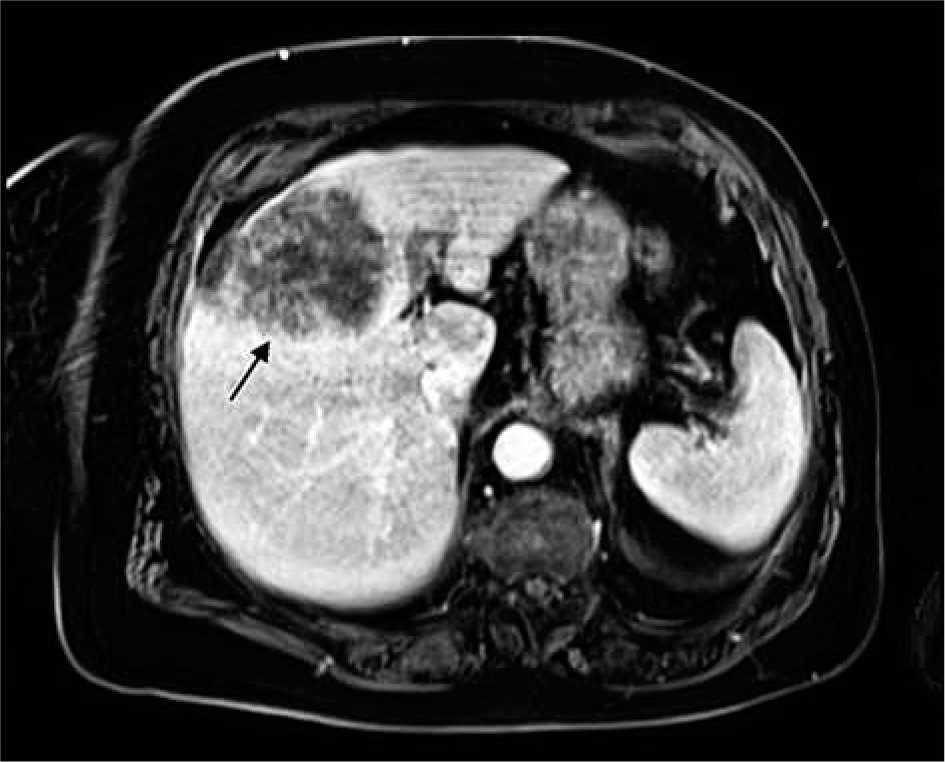
On imaging, separating the 2 types of necrosis is highly challenging. Based on an investigation of the heterogeneity of the total lesion attenuation, researchers have already attempted to distinguish between these 2 types on CT scans, and it has been claimed that infarct-like necrosis may appear more homogenous [25]. The mean ADC value seen in MRI scans following systemic chemotherapy appears to be connected to the degree but not the type of necrosis [21]. In general, the presence of necrosis in metastatic lesions (with or without reduction in size) on cross-sectional imaging is presumed to represent good response to systemic therapy. Tumour necrosis with massive degradation is presented in Figure 1.
Apparent diffusion coefficient values
The apparent diffusion coefficient (ADC) value is a measure of the magnitude of diffusion (of water molecules) within tissue, and it is commonly clinically calculated using MRI with diffusion-weighted imaging (DWI) [26]. DWI exploits the random motion of water molecules. The extent of tissue cellularity and the presence of intact cell membrane help determine the impedance of water molecule diffusion.This impedance of water molecules diffusion can be quantitatively assessed using the ADC value [27-29], which can be displayed as a parametric map that reflects the degree of diffusion of water molecules through different tissues [29].
Various studies demonstrate that DWI can be helpful in liver tumour detection, characterization, and assessment of treatment response. Furthermore, because the ADC value shows a correlation with the tumour proliferation index, that value can be used to differentiate highly cellular regions of the tumour from acellular regions, and to identify the presence of fibrosis or tumour necrosis after treatment [30,31].
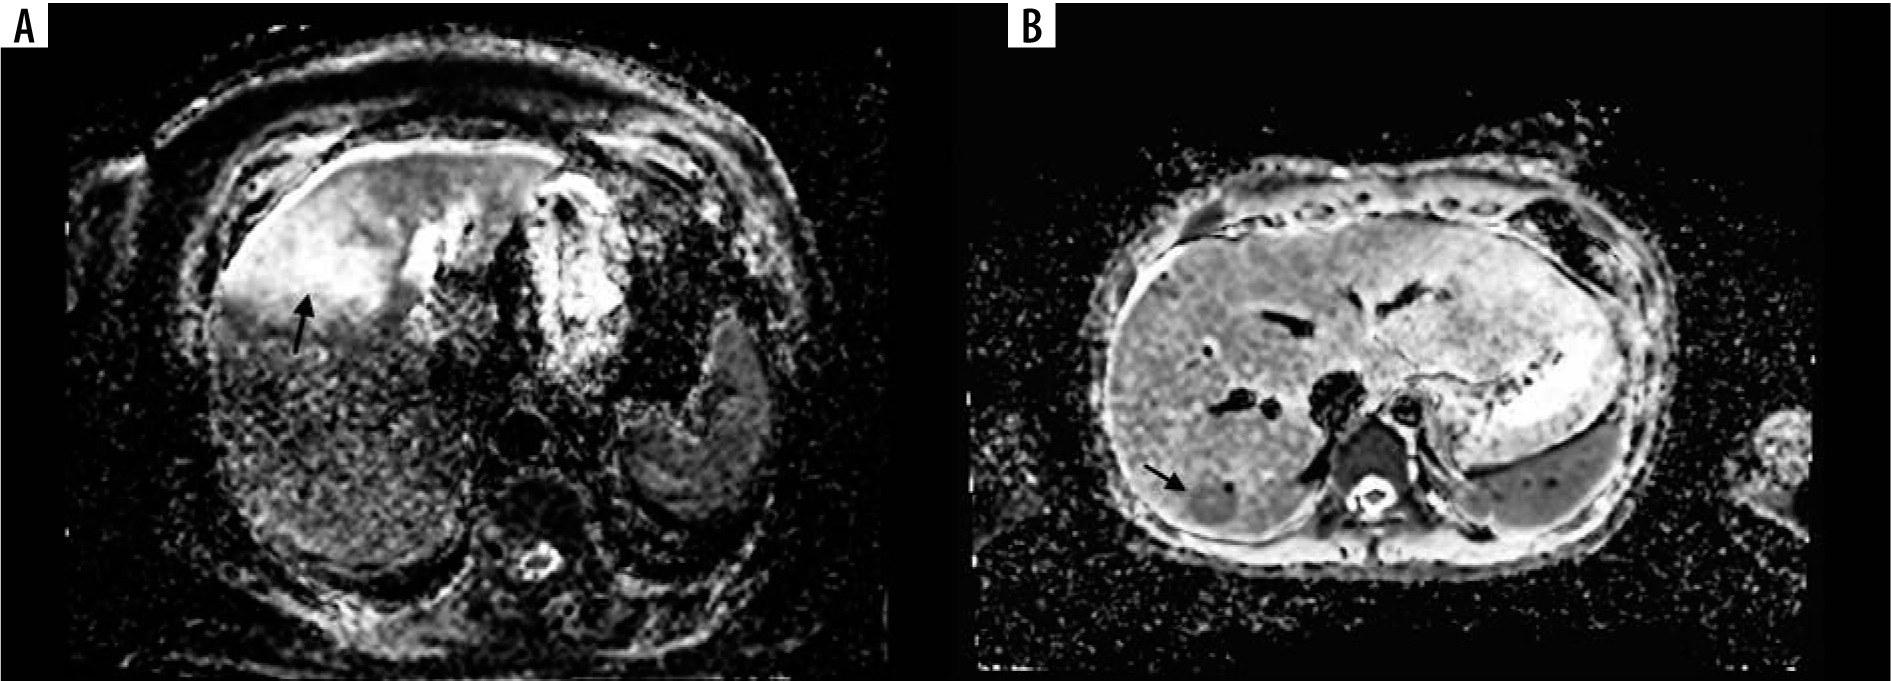
In the literature, colorectal liver metastases are classified as responding or non-responding to chemotherapy and are compared with ADC values, showing a correlation between increasing ADC values and successful treatment (Figure 2). Investigation of the efficacy of DWI imaging based on quantitative analysis of ADC values of liver lesions can differentiate between benign and malignant lesions [32-34]. The results of most of them are promising because they demonstrate statistically significant differences between higher mean ADC values of non-solid benign lesions (such as haemangiomas and cysts) and lower mean ADC values of solid malignant tumours [32,33]. Because the diffusion coefficient is related to lesion cellularity and the size of extracellular space, some solid, highly cellular benign lesions, such as focal nodular hyperplasia (FNH) or hepatocellular adenoma (HCA), show lower ADC values within the range of those of malignant lesions. Moreover, in several abscesses, diffusion is restricted because of cellular debris and exudates. On the other hand, some malignant lesions, mostly metastases, demonstrate high ADC values [35].
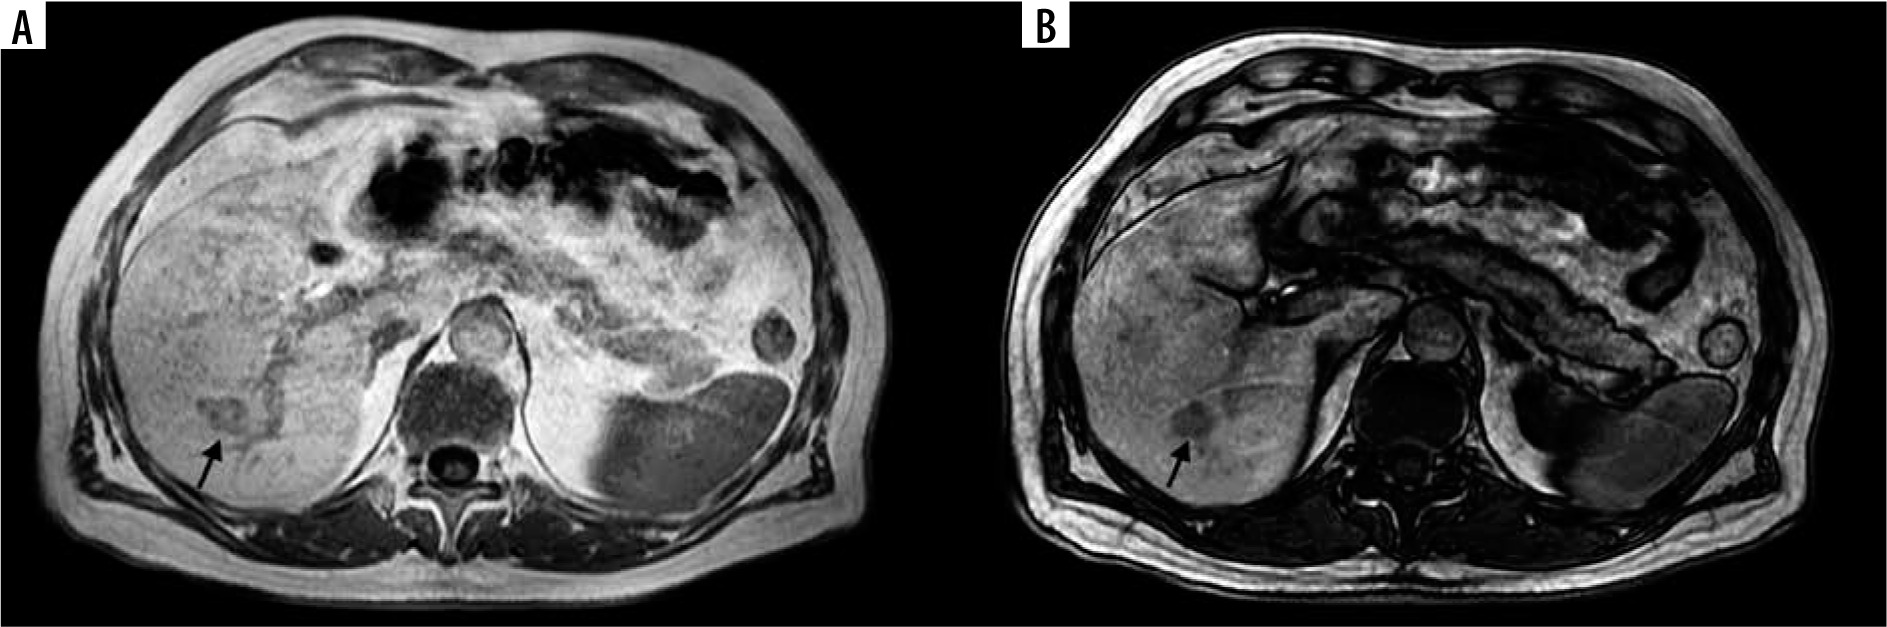
Figure 2
A 68-year-old female with colorectal liver metastases (CRLM) (arrow). Most of the CRLM represents elevated apparent diffusion coefficient (ADC) value (1.78 × 10⁻⁶ mm2/s) indicating the necrosis during treatment (A). Lower ADC value (0.54 × 10⁻⁶ mm2/s) in solid CRLM (arrow) in a 56-year-old male in segment VI (B)
Differentiation of hepatic colorectal metastases with complete pathological response from those with incomplete response shows significantly higher ADC values in lesions with complete response compared to those with incomplete response [31]. A high ADC value correlates with tumour necrosis after chemotherapy, but generally not with tumour vitality because of varying amounts of fibrosis and scattered distribution of tumour cells. Some correlation with ADC and vitality has been noted in patients treated with targeted agents [36]. High ADC of the whole tumour or tumour periphery after N-acetylcysteine (NAC) correlates inversely with low tumour vitality [37]. No association was found between whole metastasis ADC and histology after NAC, but ADC of the periphery was higher for metastases with major histological response [38]. An elevation in ADC value is thought to present a higher degree of freedom of water molecules in the tissue, which can be due to increased necrosis and reduced cellularity [39].
Significant correlation between ADC values of diffusion-weighted MR imaging and histological tumour regression grading (TRG) of colorectal liver metastases after preoperative chemotherapy can have crucial clinical implications for future surgical planning. It can be useful for a timely identification of patients who are non-responders to preoperative chemotherapy. These patients can be directed to a different, more effective chemotherapy regimen. Therefore, the ADC value can be proposed as an imaging biomarker for assessing tumour response to chemotherapy in colorectal liver metastases [36].
Tumour calcification
According to the research, there are numerous causes of liver parenchyma calcifications, including granulomatous illness, infectious diseases, and benign or malignant neoplasms [10]. Numerous malignant tumours, such as colorectal cancer, ovarian cancer, pancreatic cancer, thyroid cancer, osteosarcoma, and chondrosarcoma, are often associated with calcified liver metastases. There is rare documentation in the literature of breast cancer combined with calcified liver metastases [38].
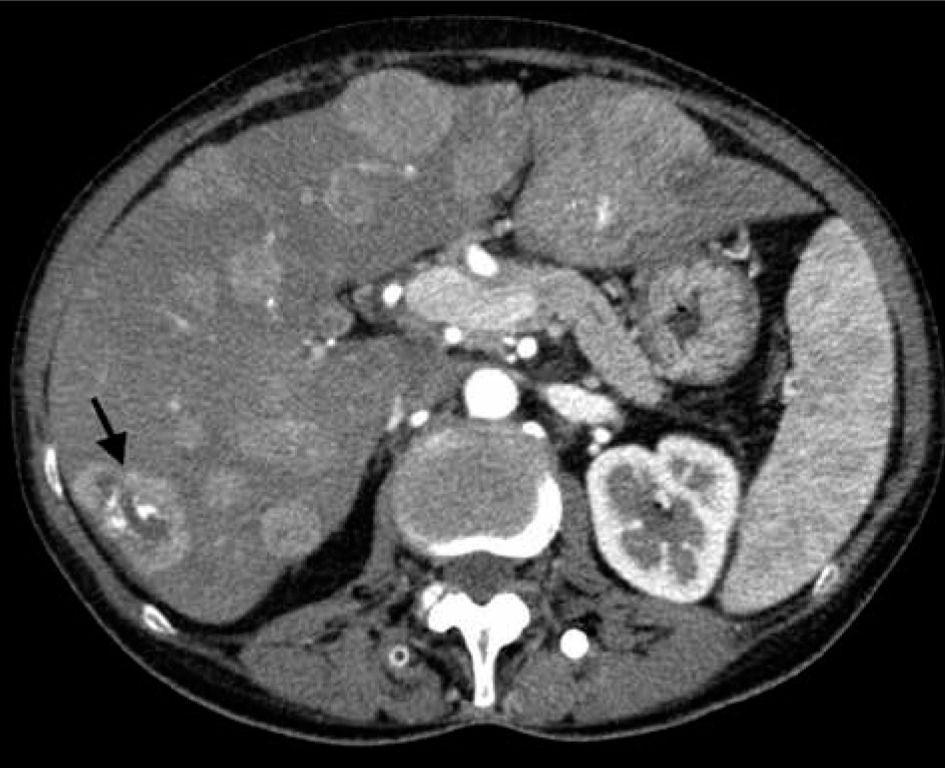
It has been suggested that calcifications of hepatic metastases found in CT scans have predictive value in various malignancies. Because the radiographic characteristics of calcifications may help in identifying the causes of underlying malignancies and provide prognostic relevance, it is crucial to understand the pattern and genesis of calcified liver metastases [10]. According to some reports, colon cancer patients with calcified liver metastases had a better prognosis than those who did not. For instance, the development of the disease is indicated by the calcification of hepatic metastases in ovarian cancer, osteosarcoma, and chondrosarcoma [10]. It is generally accepted that the necrosis of tumour cells following systemic therapy like chemotherapy in the FOLFIRI (folinic acid [leucovorin], 5-fluorouracil, and irinotecan) protocol may result in subsequent inflammatory reactions that cause the metastatic lesions to calcify (Figure 3). Thus, repeated growth and necrosis of tumour cells during systemic therapy may lead to calcified liver metastases [38]. The maximum calcification density and calcification morphology has no bearing on the effectiveness of treatment [10].
Figure 3
A 60-year-old male after cetuximab and FOLFIRI (folinic acid [leucovorin], 5-fluorouracil and irinotecan) chemotherapy. Axial contrastenhanced computed tomography image shows hyperattenuating hepatic lesions representing untypical colorectal liver metastases (CRLM). One of them exhibits central calcification (arrow)
In metastatic CRC patients receiving cetuximab and chemotherapy, it has been demonstrated that the presence of tumour calcification was related to both better median progression-free survival and overall survival rates. Positive prognostic indicators for survival and imaging indicators of therapy success include not only tumour calcification but also an increase in the number of calcifications [9].
Tumour fibrosis
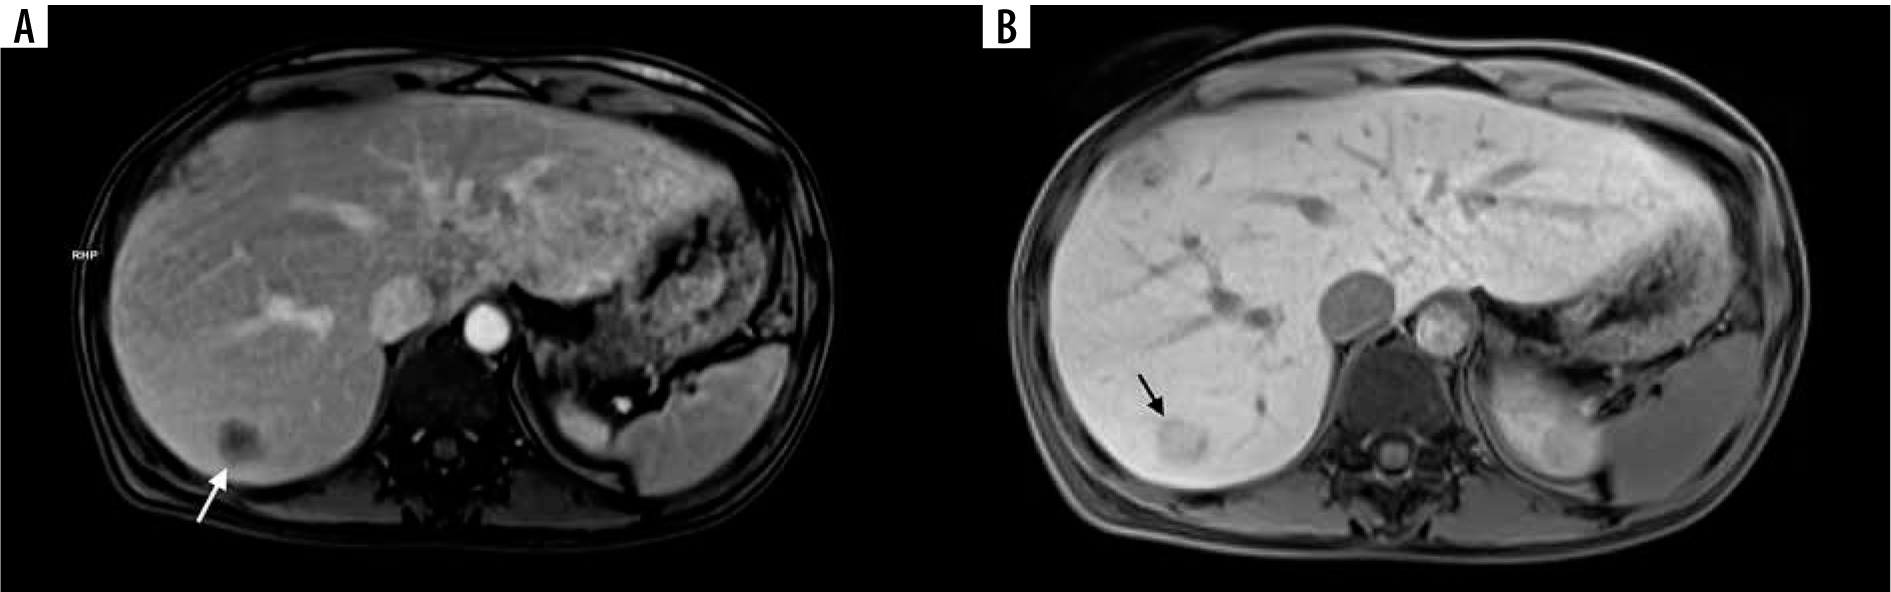
To identify liver fibrosis in patients with colorectal liver metastases (CRLM) following hepatectomy, many noninvasive models based on laboratory data have been devised [40]. A strong response to chemotherapy and a better outcome following CRLM resection are related to the degree of fibrosis in treated metastases [41]. On dynamic contrast-enhanced CT or MR imaging, fibrosis appears as gradual enhancement from the arterial to the 5-minute delayed phase. After the infusion of hepato-specific contrast agents, there is also some retention of contrast agent in intra-tumoural fibrotic tissue visible on hepatobiliary phase images [42,43]. On preoperative MRI, late gadolinium enhancement as well as hepatobiliary phase enhancement of CRLM are related to tumour fibrosis and correlate with better overall survival rates [44,45]. Radiologists find it more challenging to differentiate among a tumour’s fibrous stroma and chemotherapy-induced fibrosis. Although it is unusual, capsular retraction with preoperative chemotherapy may be a marker of increasing fibrosis. Hepatic fibrosis has been observed to be an important prognostic factor for hepatic recurrence following curative resection of colorectal cancer due to the link between liver fibrosis and malignant tumours [45]. 5Progressive enhancement in the T1-weighted gradient echo MR images is presented in Figure 4.
Figure 4
A 74-year-old female with colorectal liver metastases (CRLM) in segment VII (arrows). Progressive enhancement in the T1-weighted gradient echo magnetic resonance images starting with peripheral enhancement in the equilibrium phase (A) and subsequent central enhancement in the hepatobiliary phase (B) corresponding with the presence of fibrous tissue
Intratumoural fat deposition
Elevated intra-hepatic fat (IHF) is an independent risk factor for post-operative morbidity following hepatic resection of CRLM [46]. Hepatic steatosis (HS) alters the component diversity of liver microenvironment, and it may affect metastases foci formation and chemotherapeutic response in patients with CRLM [47-49]. Studies demonstrate that HS may be a negative prognostic factor for the onset and progression of CRLM [50,51]. Furthermore, several studies based on proton MR spectroscopy have reported that most cancer cells, including colorectal cancer cells, contain mobile lipids, and that this is an early indicator of the effects of chemotherapy, which can handicap the assessment of the liver [52].
The presence of fatty liver is not associated with intratumoural fat deposition, although CRLM after pre-operative chemotherapy frequently exhibit intratumoural fat deposition [52]. Chemical shift gradient-recalled echo MR imaging is a robust and common technique for visualization of fat [53]. It was presumed that identification of fat in some CRLM after preoperative chemotherapy may have a positive impact on prognosis because of cytotoxicity to cancer cells resulting from successful chemotherapy [52]. Contrary to this statement, a recent study observed a correlation between intratumoural fat deposition in CRLM after chemotherapy and poor long-term prognosis [53]. Figure 5 presents the axial T1-weighted in-phase and opposed-phase MR images exhibiting intratumoural fat deposition with signal-intensity drop.
Figure 5
A 55-year-old-man with colorectal liver metastases (CRLM) after FOLFOX (folinic acid [leucovorin], 5-fluorouracil and oxaliplatin) chemotherapy in chemical shift MR imaging (arrows). Axial T1-weighted opposed-phase MR image shows focal signal intensity drop (B) compared to in-phase MR image (A)
Disappearing liver metastases
The response rates of CRLM have significantly increased in recent years because of the development of new systemic treatment approaches [1]. Complete shrinkage of CRLM on cross-sectional imaging (usually observed on CT scans), also known as disappearing liver metastases (DLM), presents a therapeutic dilemma (Figure 6). The best treatment option for these lesions is still being disputed in the literature, highlighting radiological response as a favourable prognostic factor [54]. In reality, DLM is not always synonymous with cure, and when resected, pathological analysis shows that in more than 80% of patients there is a variable percentage of the residual tumour or an early recurrence in situ [55]. The complete curing of CRLM with systemic therapy is a rare phenomenon that now occurs in less than 5% of cases [55]. Thanks to the development of innovative oncological strategies, a higher rate of patients will develop DLM in the future [56]. Unfortunately, resection of DLM can be technically troublesome. For this reason, it is necessary to perform detailed restaging after and during chemotherapy with accurate localization of all sites of CRLM previously described as the key point for the correct treatment [57].
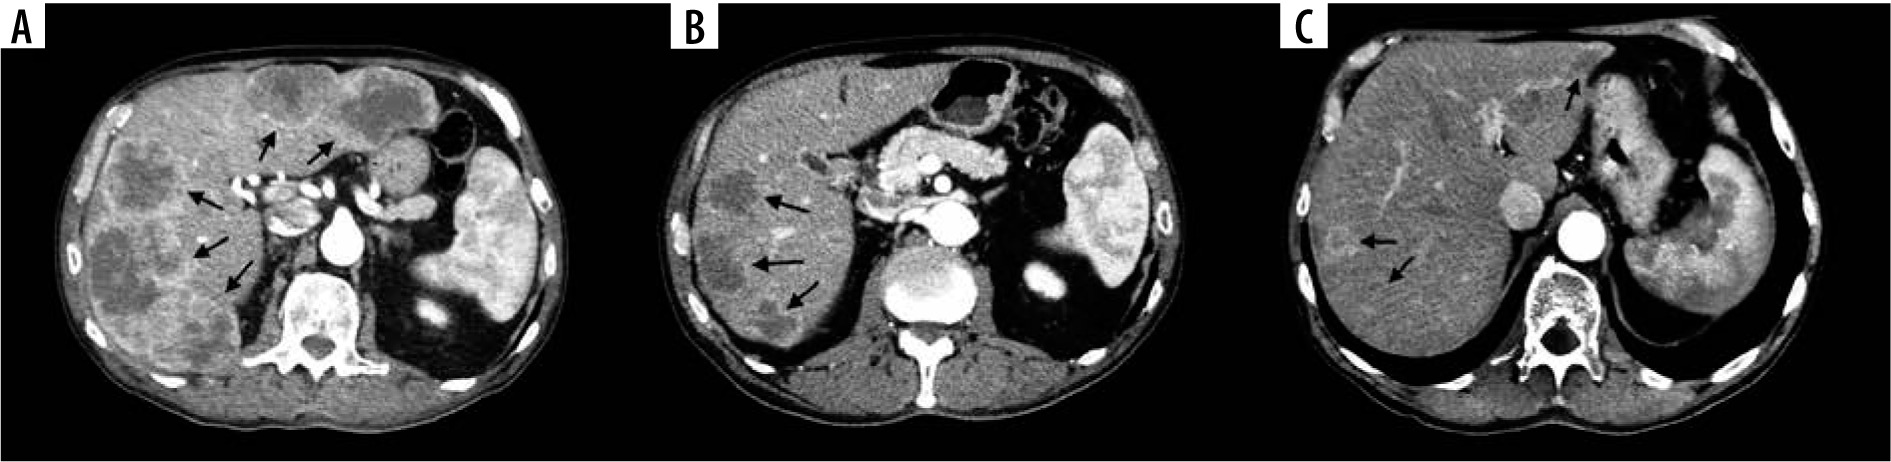
Figure 6
Examples of disappearing liver metastases (DLM) in computed tomography (CT) images in 48-year-old female with colorectal liver metastases (CRLM). A) Initial contrast-enhanced CT image shows 5 confluent CRLMs (arrows). B) Contrast-enhanced CT image shows 2 DLMs in the left lobe and 3 CRLMs reduced in size compared to initial CT scan after conversion therapy on 6-month follow-up (arrows). C) Contrast-enhanced CT image shows further reduction in size of 3 CRLMs in the right lobe but reappearance of a single CRLM in the left lobe on 18-month follow-up (arrows)
It has been observed that a combination of contrastenhanced CT, MRI, and intraoperative ultrasound show promising results in accurately identifying DLM with complete response. The results suggest that leaving DLM in situ could be an alternative to surgical resection when a DLM remains undetectable by MRI and intraoperative ultrasound [58]. In another publication the authors concluded that when metastasis not seen on CT is depicted on hepatocyte-specific MRI, in most of the cases it represents a viable tumour. However, lesions not identified by MRI were usually not viable metastases [59]. Nonetheless, the optimal management of DLM is still controversial due to the uncertainty of residual microscopic disease and effective long-term outcomes in resected versus unresected patients [60].
Conclusions
This article shows how unique radiological patterns in CT and MRI examinations might help to visualize some of the clinical and histological characteristics of colorectal liver metastases. An important role in evaluating tumour features, tumour response, and tumour regrowth following treatment is played by radiologists. It is crucial to accurately represent these tumoural characteristics to modify clinical therapy and aid in patient prognosis prediction.
The creation and validation of novel imaging biomarkers for CRLM will require the use of advanced analysis techniques like radiomics and machine learning. To accomplish this, researchers including radiologists and clinicians will need to collaborate to investigate the robustness of the deep learning models and software implementation with regard to generalizability across imaging platforms and patient populations, as well as to train clinicians to adapt to artificial intelligence support for making clinical decisions.