


Introduction
The knee joint is prone to injuries because of excessive axial force, its wide range of motion, its frequent exposure to trauma, and degeneration. Some morphological factors and anatomical variations lead to patellofemoral instability and contribute to degenerative processes [1]. Pathologies of the patellofemoral joint play an important role in knee pain in young patients, and particularly chondromalacia patella (CP) is often considered in individuals with anterior knee pain [2]. Abnormal contact of the patellofemoral joint and increased stress on chondral surfaces due to patellofemoral malalignment are often associated with anterior knee pain and chondral damage [3]. A progressive loss of articular cartilage results in patellofemoral osteoarthritis [4]. According to the most cited hypothesis in the literature, patellofemoral malalignment causes excess load on the patellofemoral joint and increases subsequent cartilage wear [5,6].
Abnormal morphologic properties of the trochlea were studied in previous research, and an association between morphological properties and CP was indicated in women [6,7]. Patellar height was also mentioned to have a relationship with patellar cartilage lesions [8]. During knee flexion, patella alta may cause excessive lateral motion of the patellar bone [9]. This situation may lead the patella to engage the trochlear groove earlier than expected during the flexion of the knee [10]. All these morphological alterations and interactions results in CP. Some authors in the literature used ratios of the patellar articular cartilage and trochlear cartilage parameters and claimed that these methods were better to assess the vertical location of the patella in patients with patellofemoral instability [10,11].
A recent study by Li et al. [12] presented the ratio of the most superior edge of patella-entrance of femoral trochlea interval to the length of the articular surface of the patella (SP-ET) on sagittal MRI as a new index to define the vertical location of the patella relative to the trochlea and studied this new index in relation to CP. This current study aimed to reveal the effectivity of this new index to indicate the CP and present the interobserver difference to depict the usability of this measurement technique.
Material and methods
Patients
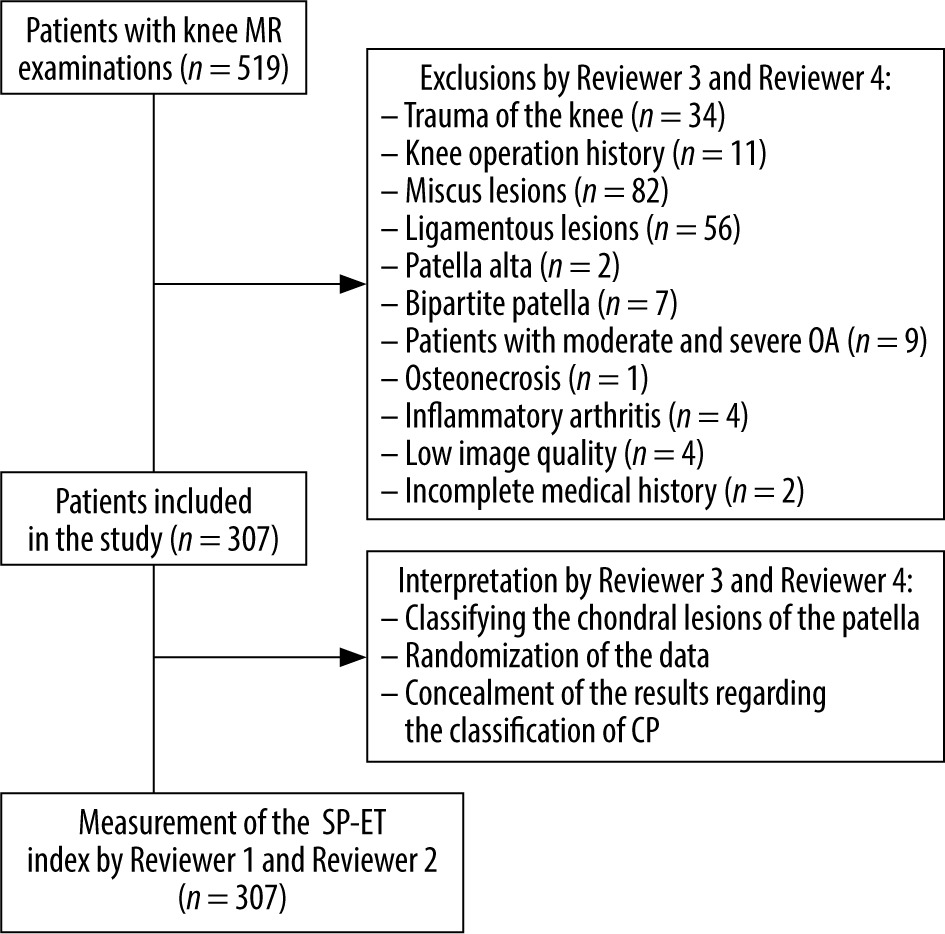
The institutional Ethics Committee approved the investigation and waived each patient’s informed consent due to the methodology of the study. After Ethics Committee approval, all patients aged between 18 and 60 years who had undergone knee MRI between the 1 January and the 28 February 2023 were re-interpreted according to the inclusion criteria. In total 519 magnetic resonance images of patients’ knees were found in our hospital’s picture archiving and communication system (PACS). Patients with a trauma history (n = 34), any knee operation story (n = 11), meniscus lesions (n = 82), ligamentous lesions (n = 56), patella alta (n = 2), bipartite patella (n = 7), and patients with moderate and severe osteoarthritis (compa-tible with Kellgren-Lawrance types 3 and 4) (n = 6 and n = 3, respectively), osteonecrosis (n = 1), and inflammatory arthritis (n = 4) were excluded from the study because these conditions might have affected the results. Four patients with low image quality (due to motion artifacts on magnetic resonance images) and 2 patients with incomplete medical history were excluded from the investigation. Patients with patella baja, transient patellar dislocation, and tumour located in the anterior compartment, which might affect the results of interpreting the patellofemoral joint, were also planned to be excluded; however, no patients were encountered with these conditions in the study population. After exclusions, 347 knee MRIs of 307 patients (40 of them were bilateral knee MRI examinations) were included in the study (Figure 1).
Magnetic resonance imaging
All MRIs included in this research were performed by a 1.5 T magnetic resonance machine (Magnetom Aera, Siemens, Erlangen, Germany) with standard (16-channel) knee coils, and turbo spin echo images were obtained. The parameters (time of repetition – TR, time of echo – TE, number of excitations – NEX, field of view – FOV, slice thickness – ST, voxel size – VS) used in each imaging series were as follows: sagittal plane T1-weighted images (TR: 1110 ms, TE: 9.7 ms, NEX: 1, FOV: 180 mm, ST: 3 mm, VS: 0.5 ´ 0.5 × 3 mm), sagittal plane fat-saturated proton density imaging (TR: 3060 ms, TE: 38 ms, NEX: 1, FOV: 180 mm, ST: 3 mm, VS: 0.7 × 0.7 × 3 mm), coronal plane fat-saturated proton density imaging (TR: 2390 ms, TE: 20 ms, NEX: 2, FOV: 200 mm, ST: 4 mm, VS: 0.6 × 0.6 × 4 mm), axial plane proton density-weighted fat-saturated imaging (TR: 3440 ms, TE: 30 ms, NEX: 2, FOV: 180 mm, ST: 3 mm, VS: 0.6 × 0.6 × 3 mm).
Interpretation and measurements
All magnetic resonance images included in this research were reviewed by 2 radiologists (with 10 years and 24 years of experience) regarding the classification of patellar cartilage lesions and excluded the patients with the criteria explained in this research. These 2 radiologists (reviewer 3 and reviewer 4) determined these conditions together in consensus at the same time in the same monitor and prepared the dataset. The mixed dataset consisted of the patients with and without CP, and the grades of cartilage injuries were hidden to the other reviewers (reviewer 1 and reviewer 2). Two other radiologists (with 18 years and 3 years of experience) reviewed the dataset using different monitors, at different times (15 days of interval between the reviewers), and unaware of each other’s results regarding the α and β measurements to reveal the SP-ET indexes. A picture archiving and communications system (PACS) was used (Akgün PACS Viewer v7.5, Akgün Software, Ankara, Turkey) to analyse the cross-sectional images in standard digital imaging and medicine (DICOM) formats.
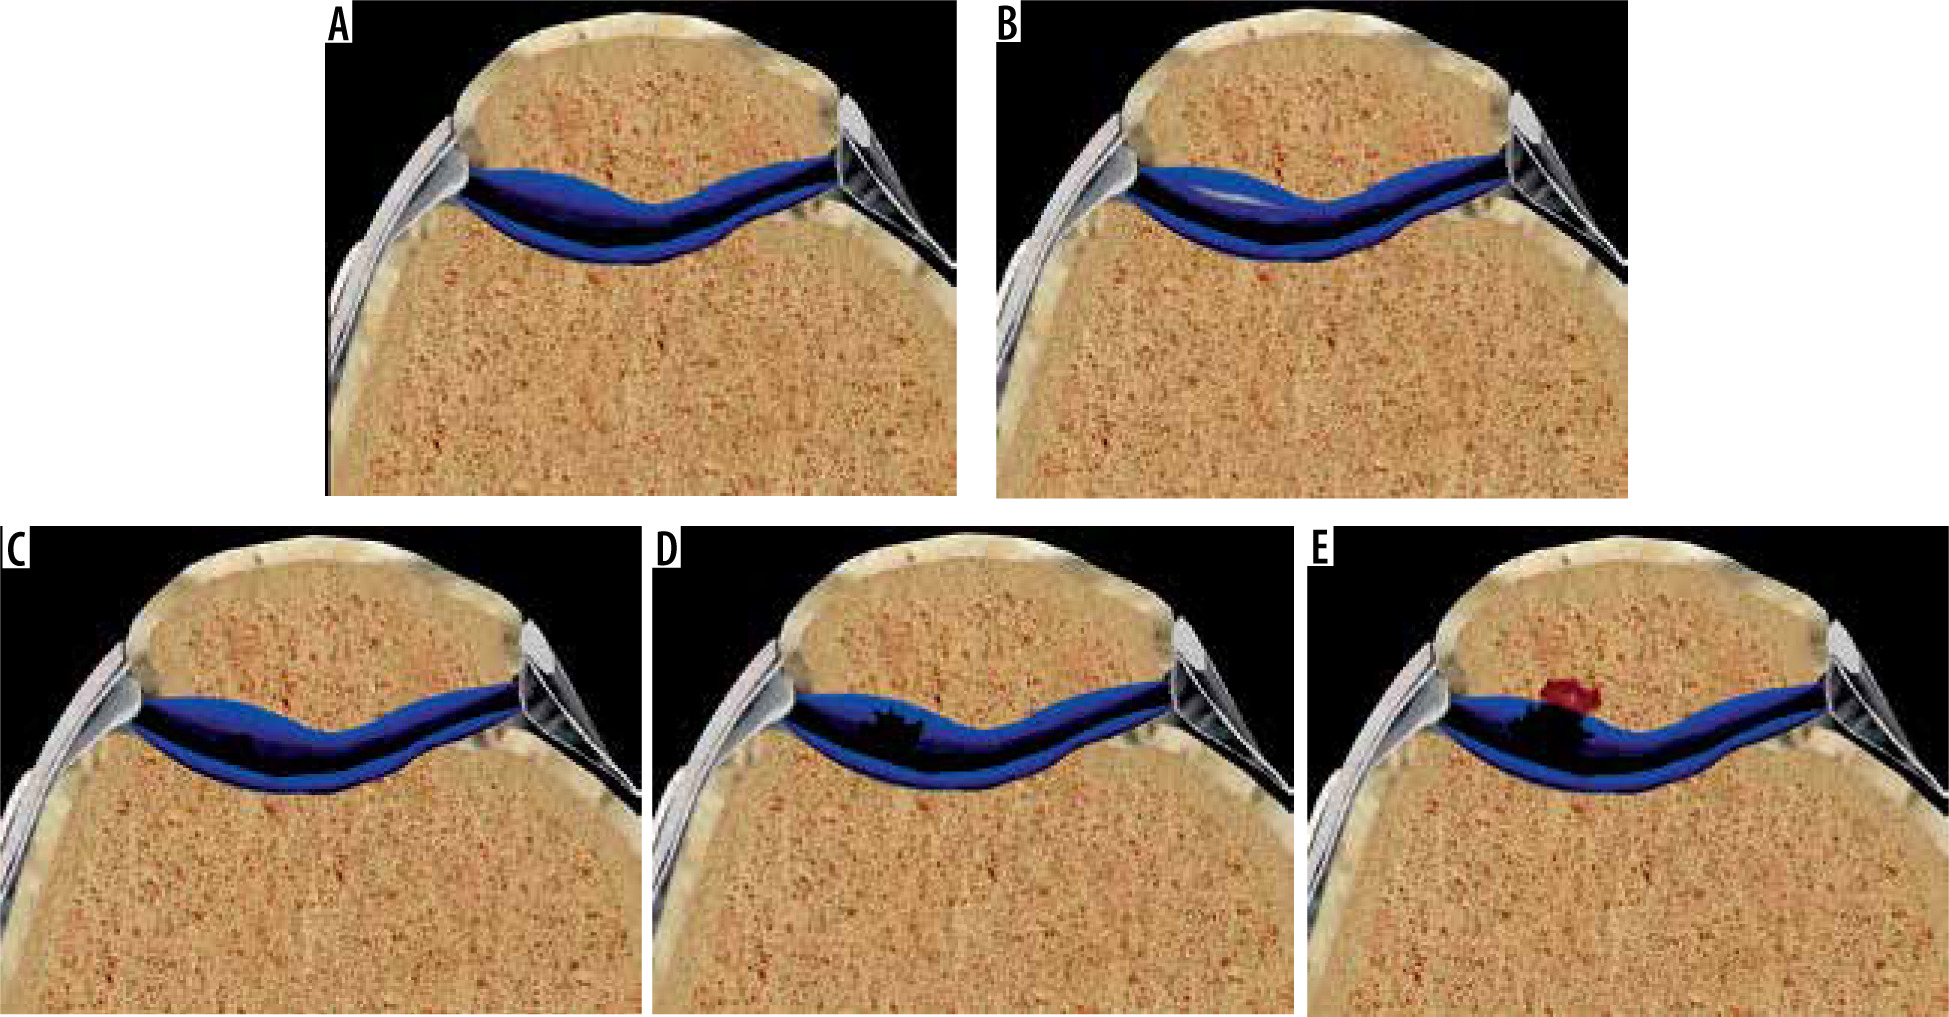
A modified Noyes classification was used to categorise the cartilage damage for the patients with CP, similarly as that used in knee MRI studies in the literature [13,14]. According to this method, grade 0 showed normal articular cartilage with homogenous signal intensity with an intact surface and thickness, grade 1 indicated a normal cartilage surface but focal abnormal signal intensity, grade 2 represented a defect less than 50% of the cartilage thickness (2A) or a cartilage defect more than 50% thickness but less than a full thickness (2B), and grade 3 specified a full cartilage thickness defect with exposed bone (Figure 2).
Figure 2
According to the modified Noyes classification, grade 0 (A) represented a normal cartilage. Grade 1 (B), grade 2A (C), grade 2B (D), and grade 3 (E) indicated different levels of chondral injuries
Figure 2 has been created by the Adobe Photoshop program (Adobe Inc., 2021. Adobe Photoshop, https://www.adobe.com/products/photoshop.html) based on the figures provided by the Complete Anatomy program (3D 4 Medical., 2021. Complete Anatomy. Retrieved from: https://3d4medical.com/).
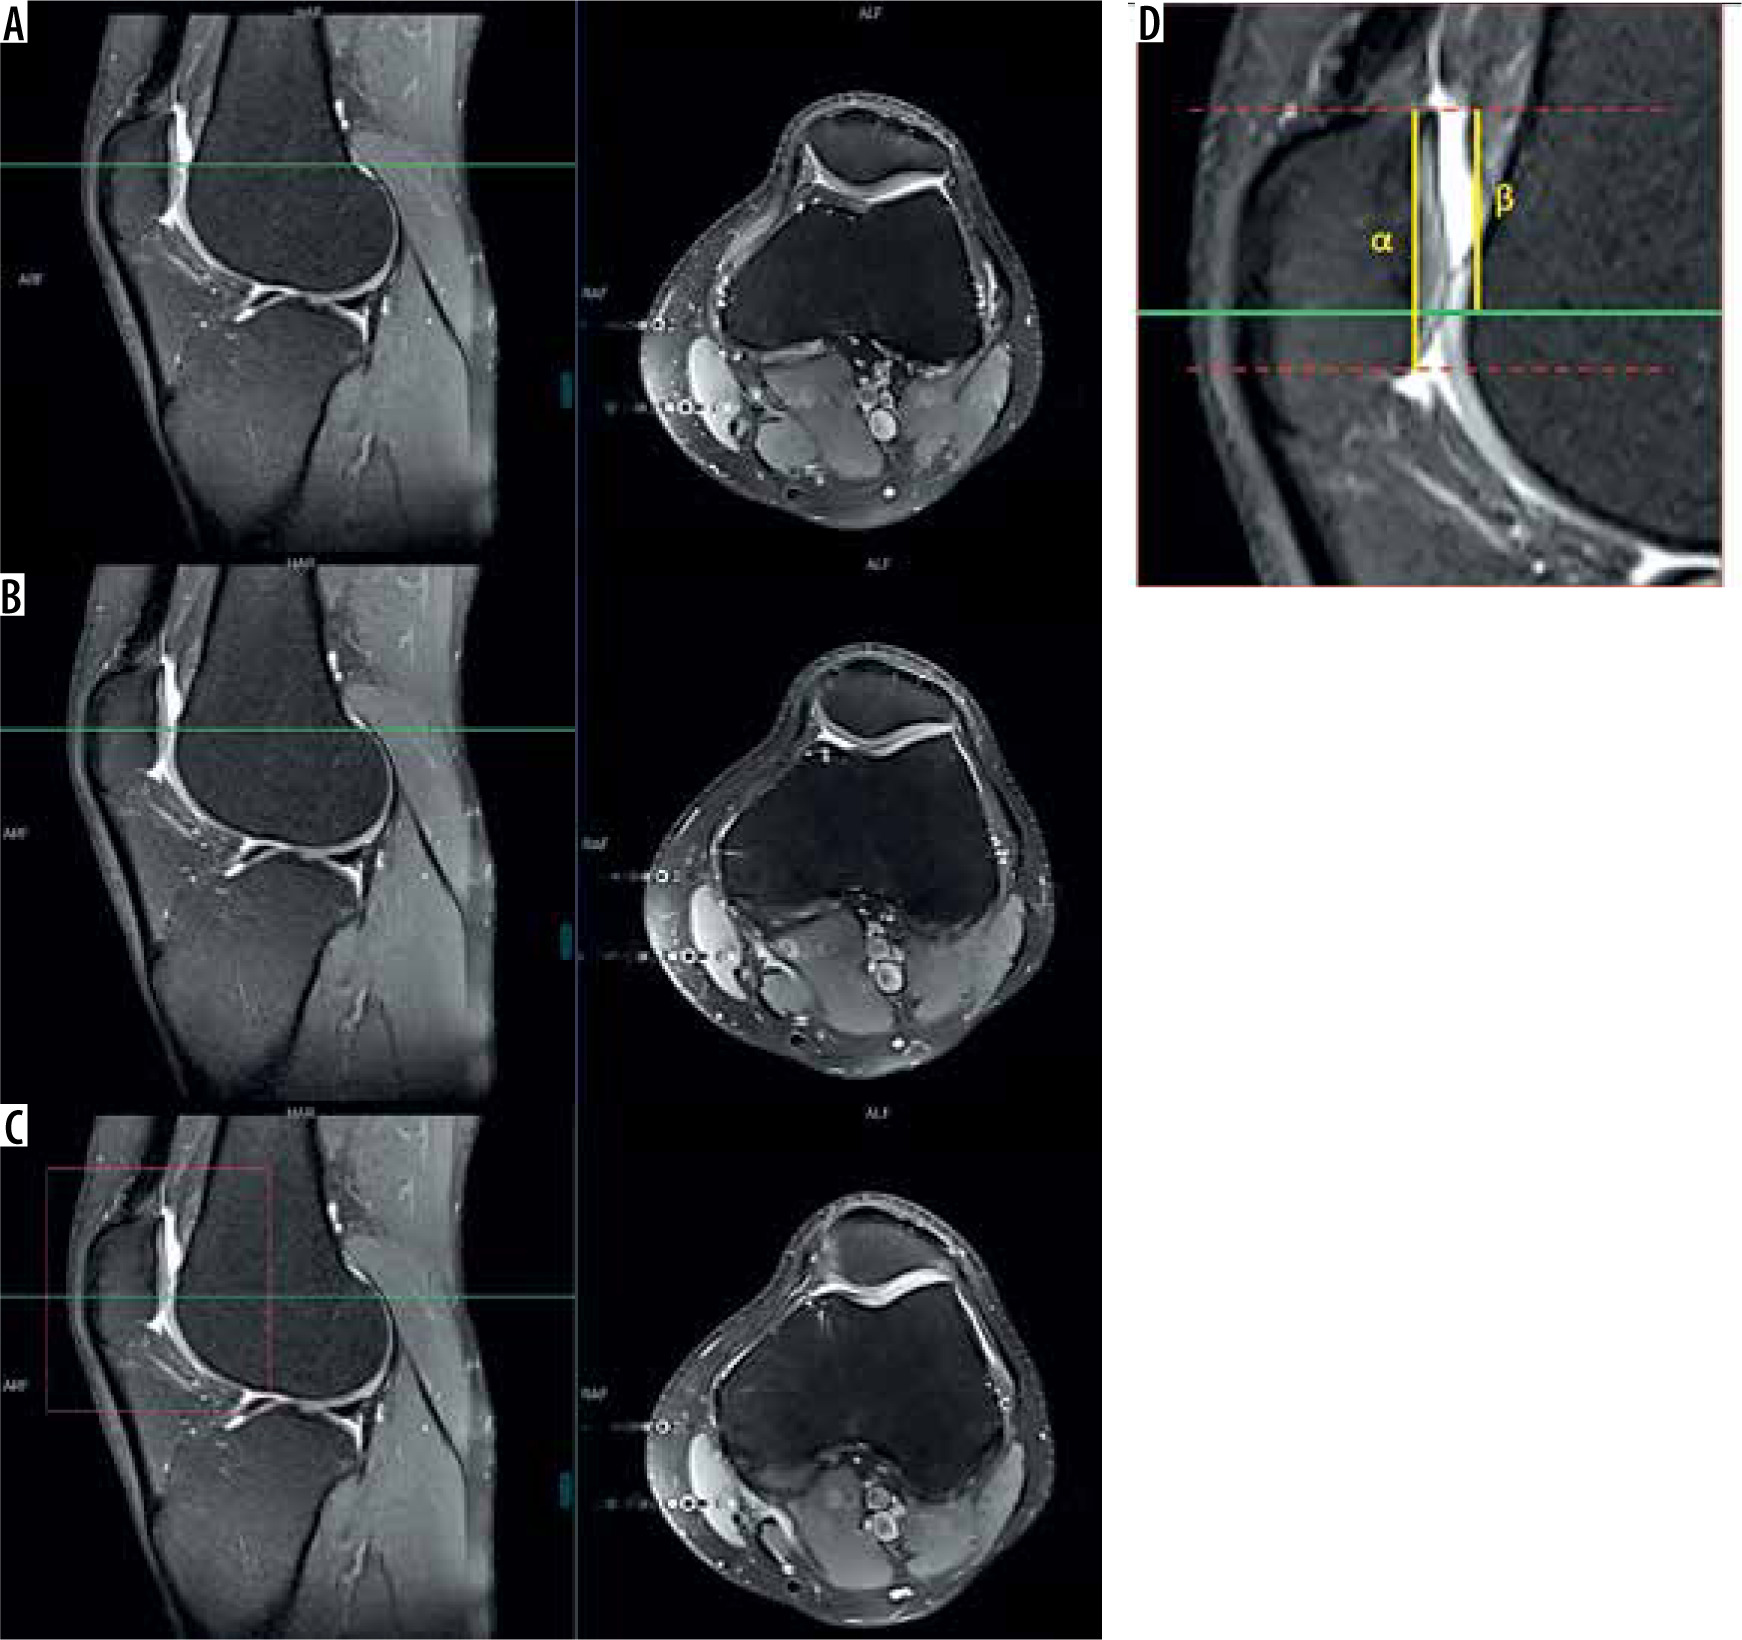
The most superior point of patella-entrance of femoral trochlea distance ratio (SP-ET index) was used to locate the vertical patellar position relative to the trochlea. The sagittal plane in which the greatest longitudinal diameter of the patella was viewed was used to measure the SP-ET index. The first (the most superior) axial plane in the craniocaudal direction, where the complete cartilaginous trochlea can be observed, was accepted to be the entrance of trochlea. The interval between the most superior edge of patella and the entrance of femoral trochlea (β) divided by the articular surface length of the patella (α) is calculated as the SP-ET ratio (Figure 3). Both reviewers measured each parameter (α and β) and noted the results to 2 decimal places because the PACS system used in this study has indicated every measurement result in this way.
Figure 3
A, B and C indicates consequent axial plane sequences with reference lines in the sagittal plane. In the most superior axial plane (A) trochlear cartilage was barely observed, and in the lower level, trochlear cartilage is not covering the whole articular surface as uncovered area is noted in the medial facet of the patella (B). The trochlear entrance was accepted to start from the axial plane in which the complete coverage of the trochlear cartilage was observed (C). This plane has been considered to be the reference line in the sagittal plane and the interval between this level and the uppermost level of the patella (β) divided by the distance representing the articular surface of the patella in the same sagittal plane (a) is accepted as the SP-ET index (D)
Statistical analysis
All statistical analyses were achieved using IBM SPSS statistics v22.0 for Windows. To determine the distribution characteristics of the data obtained, Shapiro-Wilk tests were carried out. Independent Student’s t-tests were carried out for age and mean values of SP-ET measurements to compare the study and control groups. Variance analyses were performed by Tukey’s honest significance difference test to find out the significant difference between groups regarding the Noyes classification. Intraclass correlation coefficient (ICC) values were presented for the alpha (a), beta (β), and SP-ET values to reveal agreement between reviewers. To represent the interobserver agreement levels, the classification of Koo et al. was used. According to these agreement levels, values less than 0.50 indicated poor, values between 0.50 and 0.75 showed moderate, values between 0.75 and 0.90 revealed good, and values greater than 0.90 indicated excellent agreement [15]. Data distributions of each reviewer were introduced with box-plot analyses. Spearman’s Rho test was used to analyse the correlation between SP-ET and CP grades for females, males, and for the total study population. Receiver operating characteristics (ROC) analysis was carried out to find out the optimal threshold values of SP-ET values to indicate the presence of CP. P-values less than 0.05 were considered to indicate the significance of the difference in all statistical analyses.
Results
The study included 171 females and 136 males, for a total of 347 knee MRIs of 307 patients (40 of them were bilateral), and CP was observed in 110 of them. There was a significant age difference between the patients with and without CP in the patient population (Table 1).
Table 1
Demographic data of the patient population
The mean and standard deviation of the β, a, and SP-ET values are presented in Table 2. Higher SP-ET values were measured with significant differences for patients with CP in comparison with control groups among females, males, and for all patients (Table 3).
Table 2
Measurement results of each reviewer (mm)
Table 3
SP-ET measurement results according to each reviewer
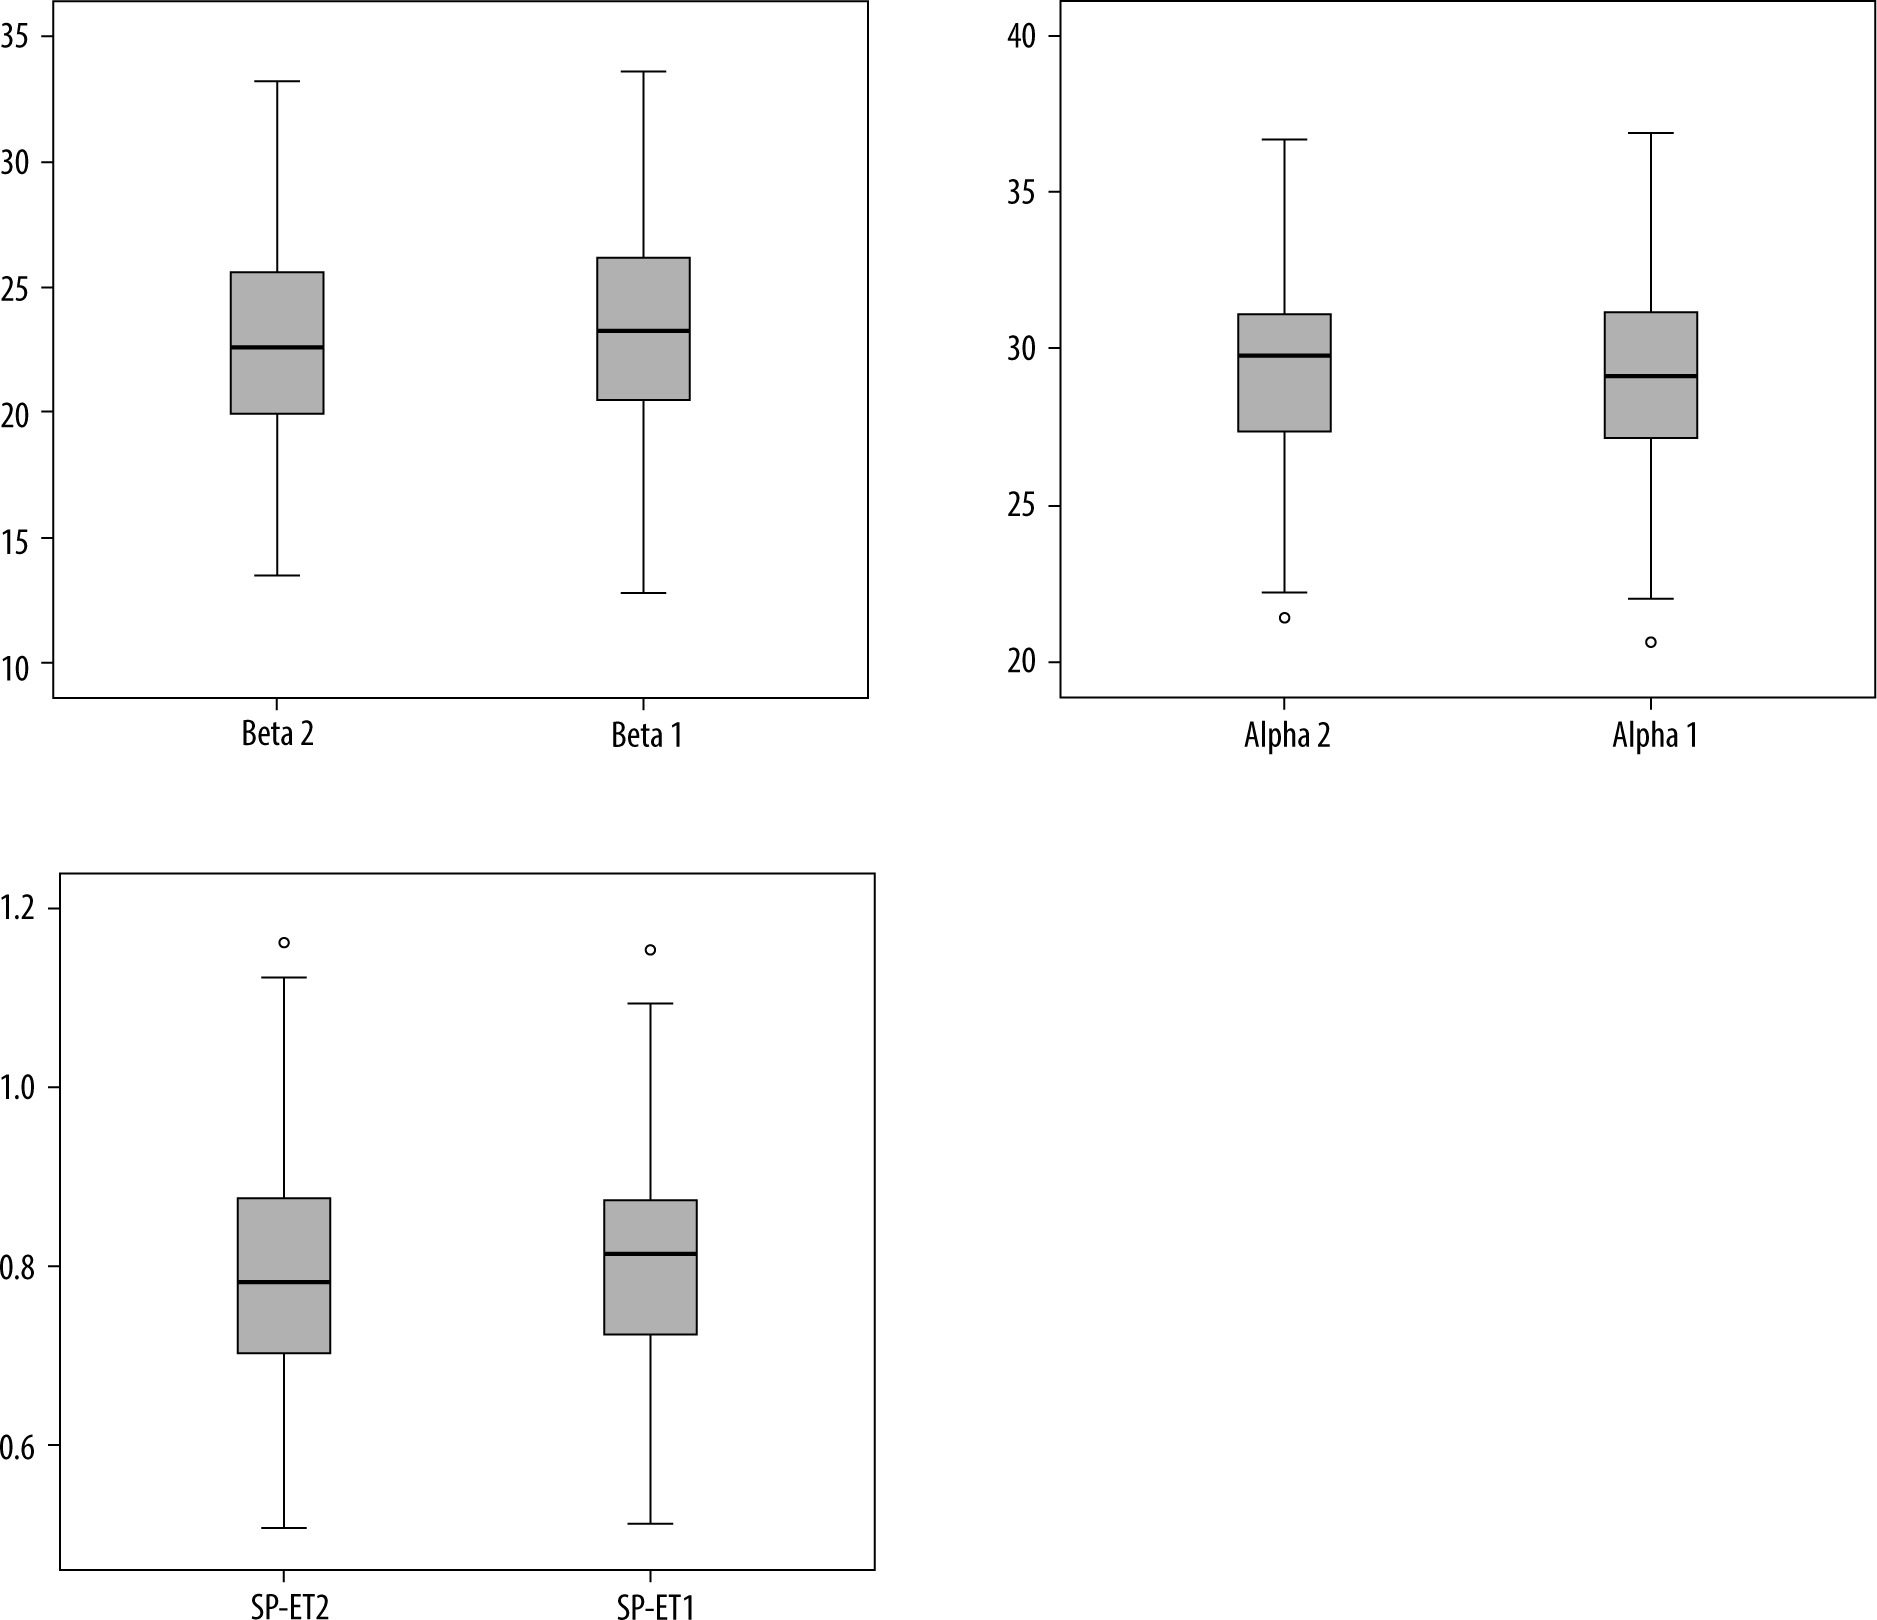
There were excellent agreements between reviewers regarding the β intervals, a values, and SP-ET ratios, and high ICC values were observed between reviewers (Table 4). The data distributions for each reviewer are presented with box plot graphics regarding the total patient population, females, and males (Figure 4).
Table 4
Interobserver differences between reviewers
| Data | Intraclass correlation coefficient | 95% confidence interval | |
|---|---|---|---|
| Lower bound | Upper bound | ||
| Beta (β) | 0.964 | 0.955 | 0.972 |
| Alpha (α) | 0.971 | 0.964 | 0.977 |
| SP-ET | 0.943 | 0.927 | 0.955 |
Figure 4
The box plot analysis indicating the data distributions for beta (β), alpha (a) and SP-ET values for reviewer 2 and reviewer 1 respectively
A variance analysis indicated that there was no significant difference among the different levels of chondral injuries for patients with CP regarding the SP-ET for both reviewers (Table 5). According to the Spearman’s Rho test, there was a significant, positive, and moderate level correlation between measured SP-ET values and CP grades for both reviewers (r = 0.594, p < 0.001 for reviewer 1 and r = 0.593, p < 0.001 for reviewer 2). A significant, positive, and high-level correlation was indicated for the females (r = 0.608, p < 0.001 for reviewer 1 and r = 0.613, p < 0.001 for reviewer 2) between SP-ET and different grades of the CP. However, the correlation was significant, positive, and moderate (r = 0.597, p < 0.001) for reviewer 1 while a significant, positive, and high correlation was calculated for reviewer 2 (r = 0.605, p < 0.001) between SP-ET and CP grades in the male group.
Table 5
Multiple comparisons between CP groups according to the modified Noyes classification regarding the SP-ET index
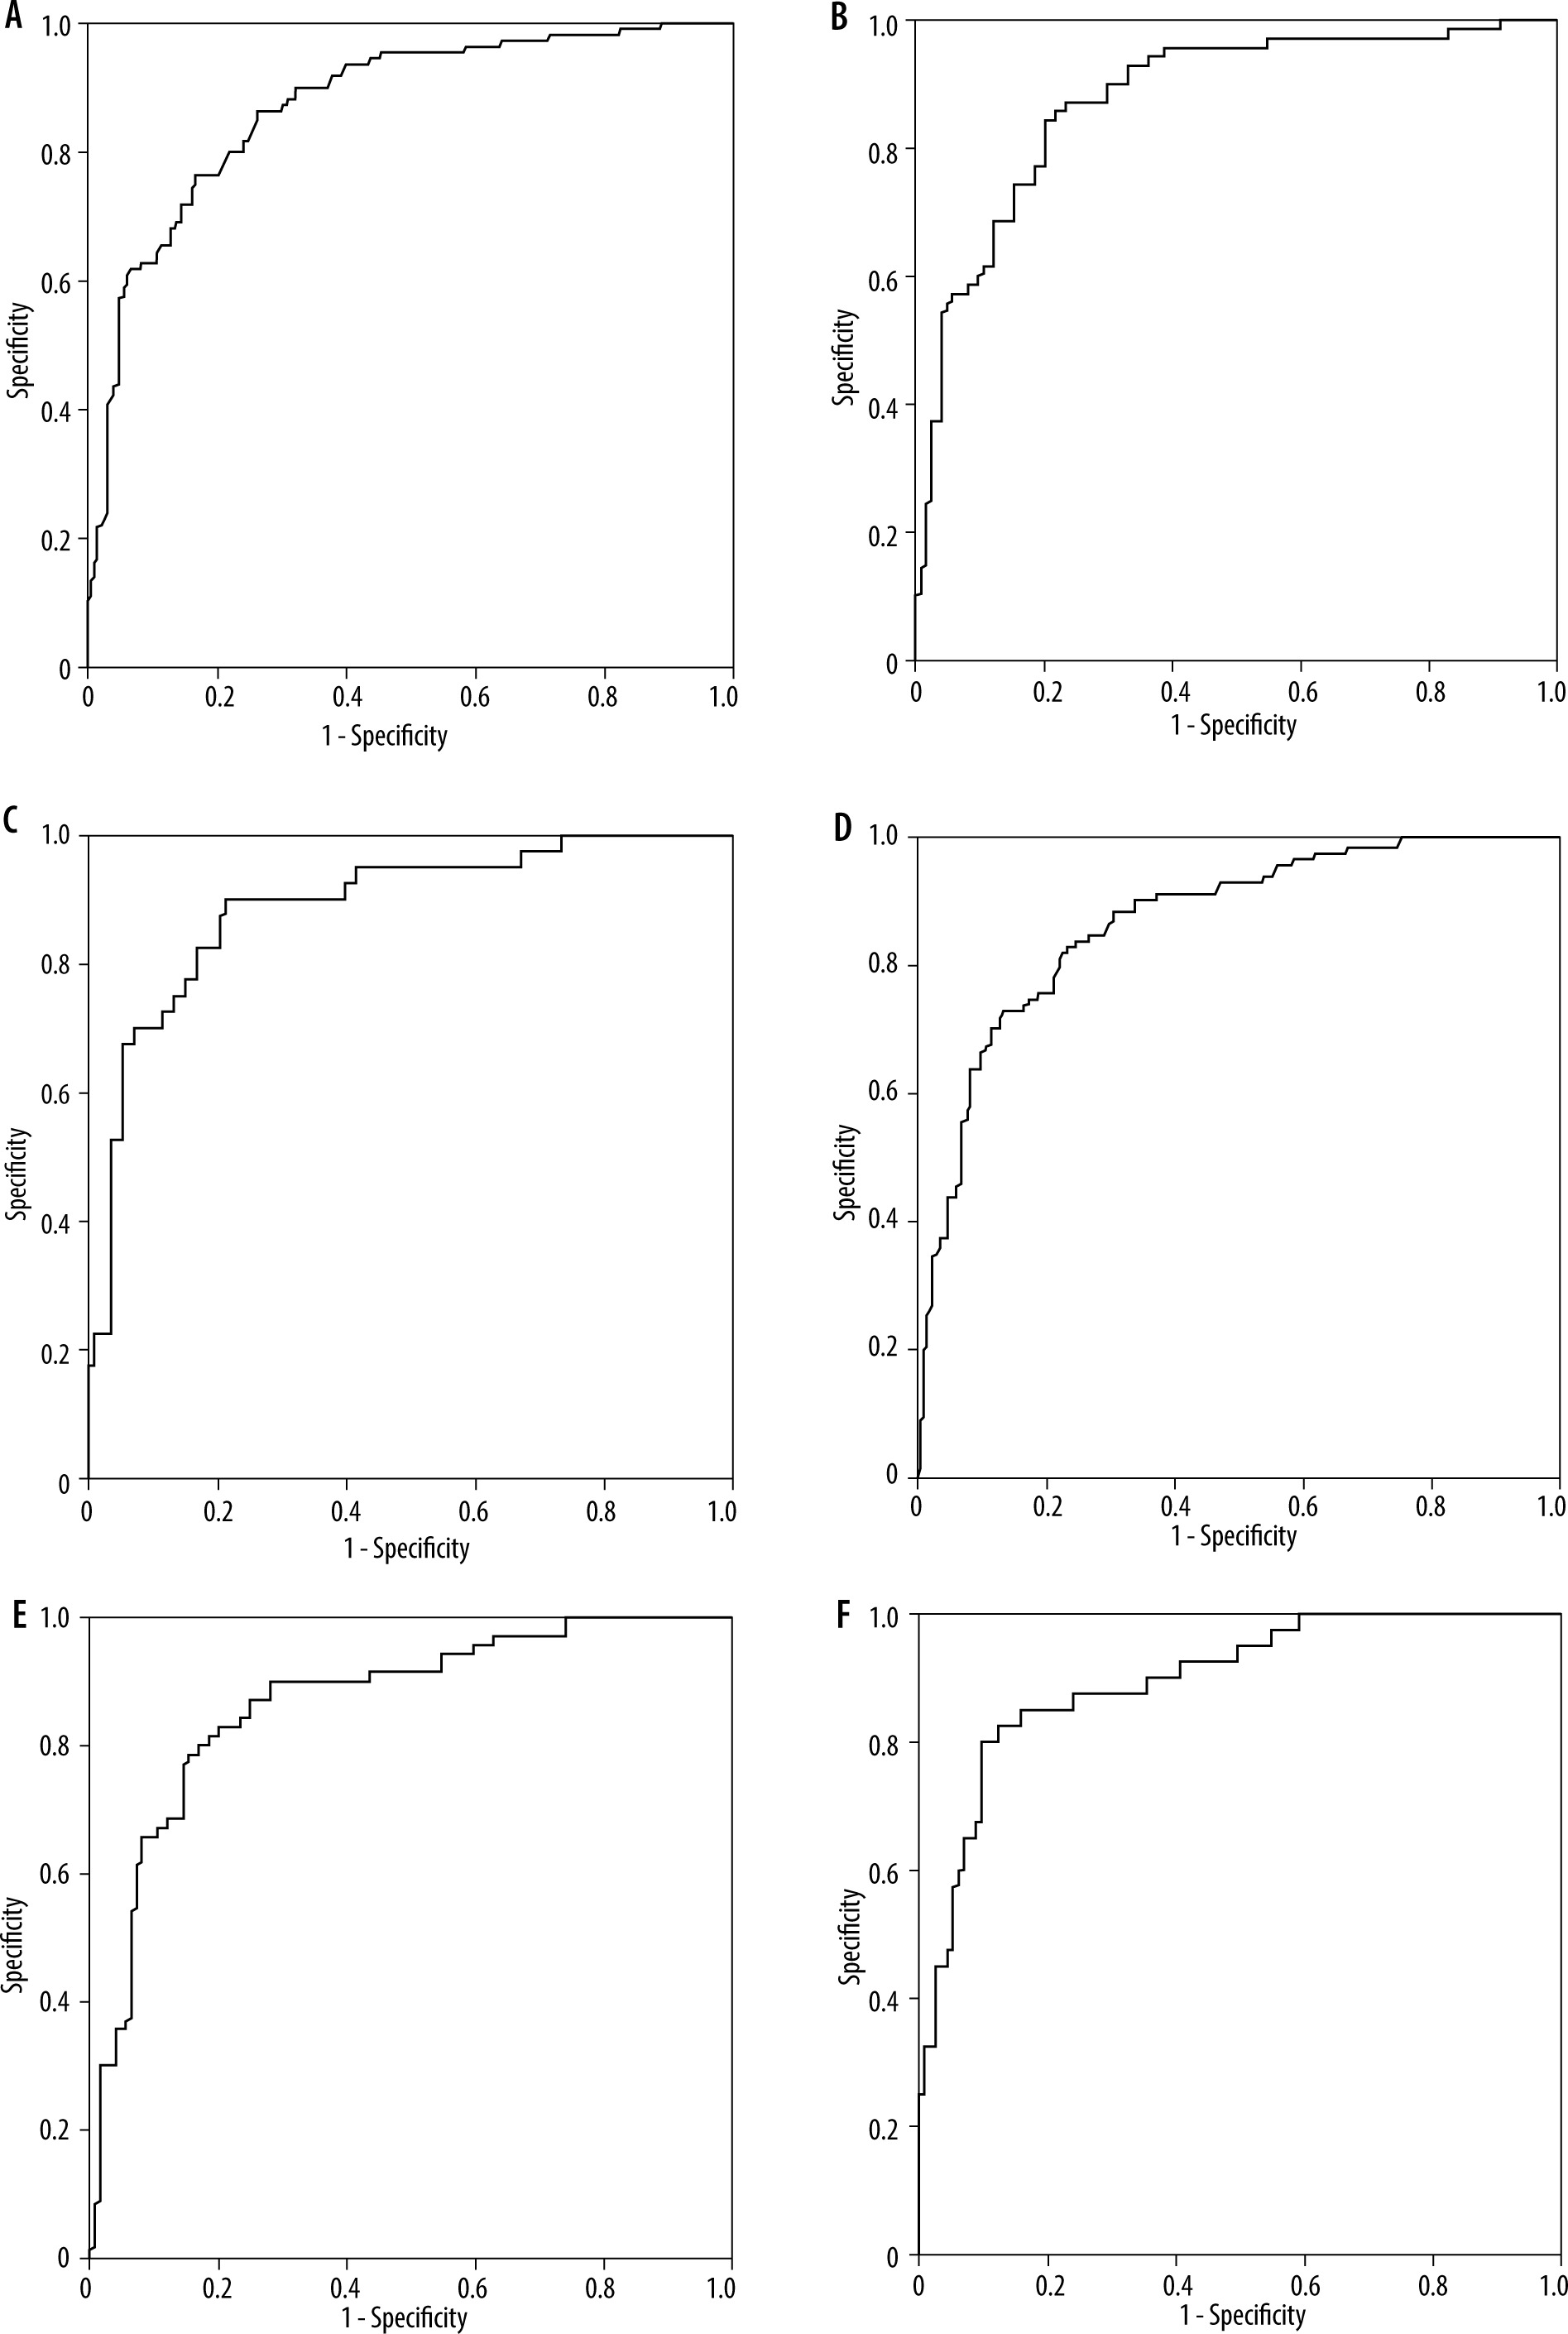
ROC analyses indicated an area under the curve (AUC) value of 0.874 for reviewer 1 and 0.868 for reviewer 2 for the whole group of patients. The highest sensitivity/specificity value obtained was 0.847 for reviewer 1 and 0.814 for reviewer 2 for the whole study population. This threshold level for reviewer 1 represented a sensitivity of 76.4% and a specificity of 85.5% to indicate the presence of CP. For reviewer 2, this cut-off value revealed a sensitivity of 82.7% and a specificity of 76.8% to depict the presence of chondral injury of the patella. Considering the sex differences, high AUC values were reached for the female and male groups for each reviewer (Figure 5).
Figure 5
The receiver operating characteristics (ROC) curves for reviewer 1 (A, B and C) and reviewer 2 (D, E and F). ROC analyses are shown for the total of patients (A and D), females (B and E) and males (C and F). The area under curves were 0.874, 0.878, 0.890, 0.868, 0.868, and 0.897 for A, B, C, D, E and F respectively
Discussion
The results of this study indicate excellent interobserver agreement between reviewers regarding the SP-ET index measurements. The current study results reveal effective threshold levels to indicate the presence of CP with high sensitivity and specificity. A significant, positive, and moderate level of correlation was found between the measured SP-ET values and CP grades for the whole study group in this investigation.
The effect of the patellofemoral malalignment on the chondral lesions of the patella was mentioned in previous studies [7,16,17]. The pathologic relationship between the patellar and trochlear articular surface caused by morphological alterations of the patellofemoral joint probably played a role in CP, as discussed in the previous literature [18-20]. A higher position of the patella was investigated regarding its influence on the occurrence of patellar cartilage injuries [16,17,19]. A higher patella interacts with more shallow areas of the proximal trochlear groove and causes reduced femoral stability [9]. A higher location of the patella might cause a failure of the patellar bone to engage the trochlear groove earlier than expected during the flexion of the knee [10]. This condition also leads to a decreased contact area between the patellar and trochlear articular surfaces [4,9]. The biomechanical effect of different patellar heights was analysed, and patella alta was found to be associated with the highest patellofemoral contact and shear force after cruciate retaining total knee arthroplasties in a computational study [21]. The patello-femoral contact force increases with increasing knee flexion. Patella alta results in a delay of this contact until deeper knee flexion, and maximum patellofemoral contact force and contact pressure increase with the higher position of the patella [22].
The Insall-Salvati index has been mentioned as a reliable method to indicate patellar location anomalies on sagittal cross-sectional planes [23]. Modified InsallSalvati ratio, Caton-Deschamps [24,25], patellophyseal index, patellotrochlear index [18,19], Koshino-Sugimoto [26], and Blackburne-Peel [25,26] are some of the other methods used in the assessment of position anomalies of the patella mentioned in previous studies. The usability of these methods and assessment of the patellar location on the craniocaudal axis are still matters of discussion in the literature.
The distance from the most superior point of the patellar chondral surface to the most superior point of the trochlear cartilage divided by the whole length of articular cartilage of the patella is known as the patellophyseal index, which is used in the assessment of patella height by some researchers [19,27,28]. This method has some similarities with SP-ET index; however, only one plane (the sagittal cross-sectional image with the greatest craniocaudal diameter of the patella) is required to perform the measurement, and this situation minimises the effect of axial patellar displacement. Therefore, this measurement technique was thought to have good applicability with the expectation of higher interobserver agreement in practice [12].
This new index, introduced by Li et al., was studied in relationship with CP in the current research. Higher SP-ET ratios were found in patients with CP compared with controls, as in their research. Relatively lower mean SP-ET values were obtained (0.89 and 0.75) compared with the study by Li et al. (0.933 and 0.802, respectively) for patients with and without CP. In their study, a high ICC interobserver value was found (ICC = 0.890), which reflects the good agreement. In the current research, the measurement results of one highly experienced and one resident radiologist (with 3 years of experience) were compared to understand the reliability and applicability of this method, and a higher agreement level was found (ICC = 0.943) in our study. There were almost parallel results obtained from each reviewer regarding the correlation analyses between the measured SP-ET values and different CP grades for females and the whole study population. Although the correlation coefficients were very close (r = 0.597 and r = 0.605), the reviewers indicated different levels of correlation for the male group.
This study has some limitations, and this research should be carefully examined considering these factors, which might have an effect on the results. First, this retrospective study used MRI-based data to determine the lesions of the patellar cartilage, and exclusions were performed using patient records and knee magnetic resonance images rather than histopathological results or surgical proof. Although patients with moderate and severe osteoarthritis were excluded from the study, the significant age difference between the study and control groups should also be accepted as another limitation. Third, the flexion angle of the knee on the images were underestimated because this was a retrospective study, and the reviewers used the routine MRIs of the patients and interpreted the images via a PACS system in the hospital records. Even though the knee MRIs were obtained with 3 mm slice thickness in the axial plane, it may not be possible to choose the trochlear entrance level with perfect accuracy because the first trochlear level fully covered with cartilage was accepted as the level to perform the SP-ET.
Conclusions
The SP-ET index was a good indicator of CP, and it was related with patellar chondral injuries. A significant, positive, and moderate level of correlation was found between SP-ET measurements and CP grades for the total study population in this research. There is little literature directly mentioning the usability, effectivity, and reliability of this index in relation to CP; hence, case-control studies would add value to the literature to reveal odds ratios and calculate the risk of higher SP-ET index to predict chondral injuries of the patella so that this index couod be used for preventive medicine.