


Introduction
Bone marrow lesions (BML) were originally known as ‘bone marrow oedema’ (BME) which was defined as a nonspecific pattern of ill-defined area of low signal intensity on T1-weighted magnetic resonance images and high signal intensity on T2-weighted or short-tau inversion-recovery images [1]. First, it was thought that there was an increased fluid in the bone marrow, but later histopathological studies have shown that variably there can be marrow oedema, necrosis, bleeding, fibrosis, ingrowth of fibrovascular tissue, lymphocytic infiltrates, and trabecular bone abnormalities [2-4]. BML can be caused by a broad spectrum of pathologies such as trauma, degenerative, inflammatory, ischaemic, infectious, metabolic/endocrine, iatrogenic, and neoplastic lesions [3]. With clinical findings, the differential diagnosis list can be narrowed, but it is still vital to distinguish if the BML is reversible because the treatment options vary from pharmaceutical agents to joint preserving surgeries. At this point, advanced imaging techniques become important. Even with the use of magnetic resonance imaging (MRI), the differential diagnosis between reversible and irreversible BML can be challenging because bone marrow oedema can obscure other subtle changes. Furthermore, signs that are characteristic of osteonecrosis appear in MR images when irreversible damage settles [5,6]. Thus, an early diagnosis of irreversible BML before well-known imaging findings appear is of great importance.
Radiomics is a non-invasive and quantitative imaging method that evaluates the size, shape, and first- and second-order texture features in radiological imaging [7]. First-order texture parameters depict the intensity distribution within the segmented image, while second-order parameters demonstrate the statistical relationships between voxels in 3-dimensional space [8]. Diagnostic capabilities of radiomics in subjects that are challenging to radio-logists have been demonstrated in previous literature [9].The aim of this retrospective study is to evaluate the diagnostic capability of radiomics analysis and machine learning based on MRI regarding discrimination of bone marrow lesions before irreversible joint damage occurs.
Material and methods
This study was approved by Ankara City Hospital Institutional Review Board (decision number: E2-21-841, decision date: 20/09/2021). Necessity of written consent was waived by the IRB due to the retrospective design of the study and the anonymization of patient data.
Study population
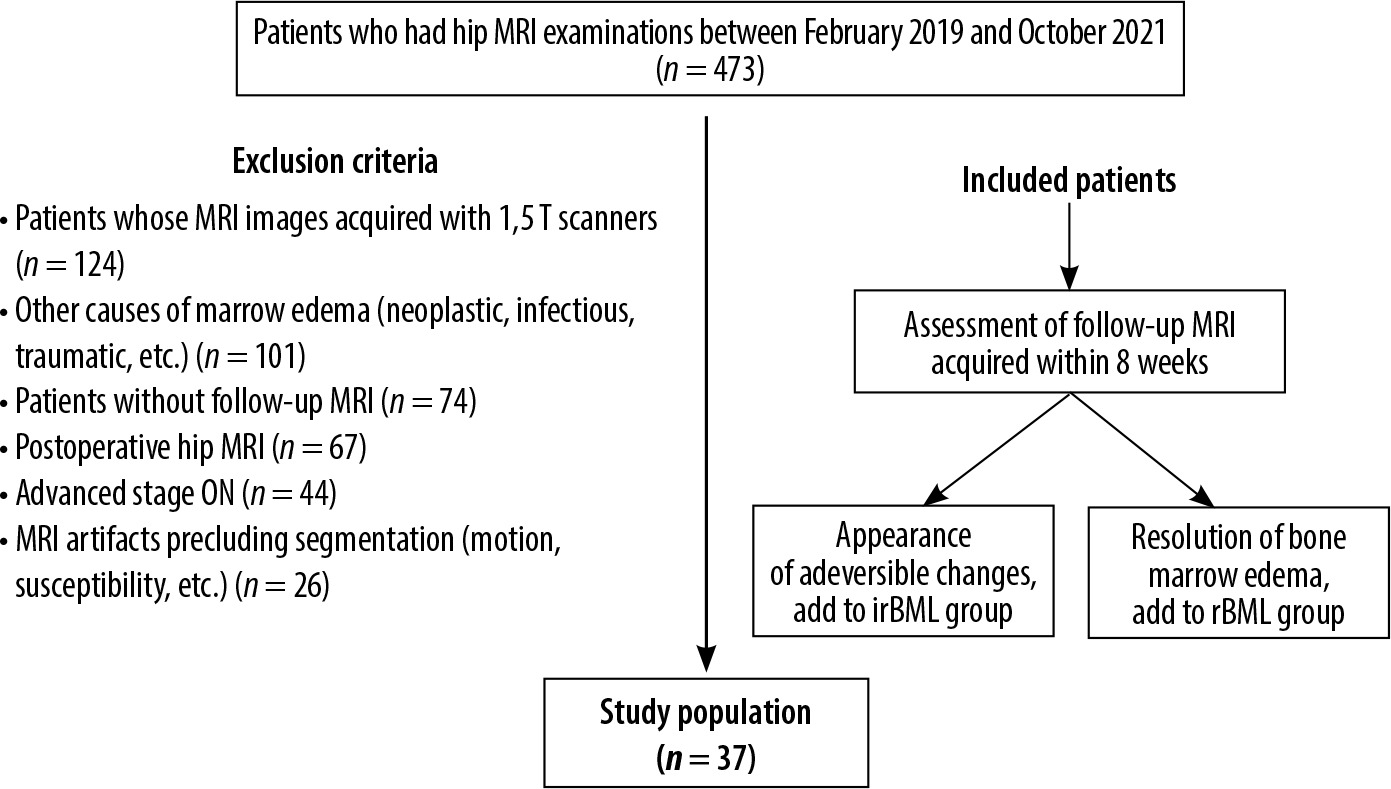
The institutional database was scanned for patients who underwent hip MRI imaging for differential diagnosis of BML of the femoral head. The follow-up protocol of our institution includes a second MRI, scheduled within 8 weeks of the first examination, which we used for the classification of patients. Patients whose images demonstrated resolution of oedema were included in the reversible group. Patients, whose images showed single- and double-line signs or crescent signs [5,6] were included in the irreversible group. Exclusion criteria were absence of follow-up images within 8 weeks, motion or susceptibility artifacts that hinder evaluation and segmenting process, bone marrow oedema related to another definitive diagnosis such as osteomyelitis, lymphoma, primary or metastatic bone masses, and the presence of clinical history preceding bone marrow reconversion. Patients who already had advanced stage osteonecrosis-related changes in first images were also excluded. The patient selection is summarized in Figure 1.
MRI acquisition and pre-processing
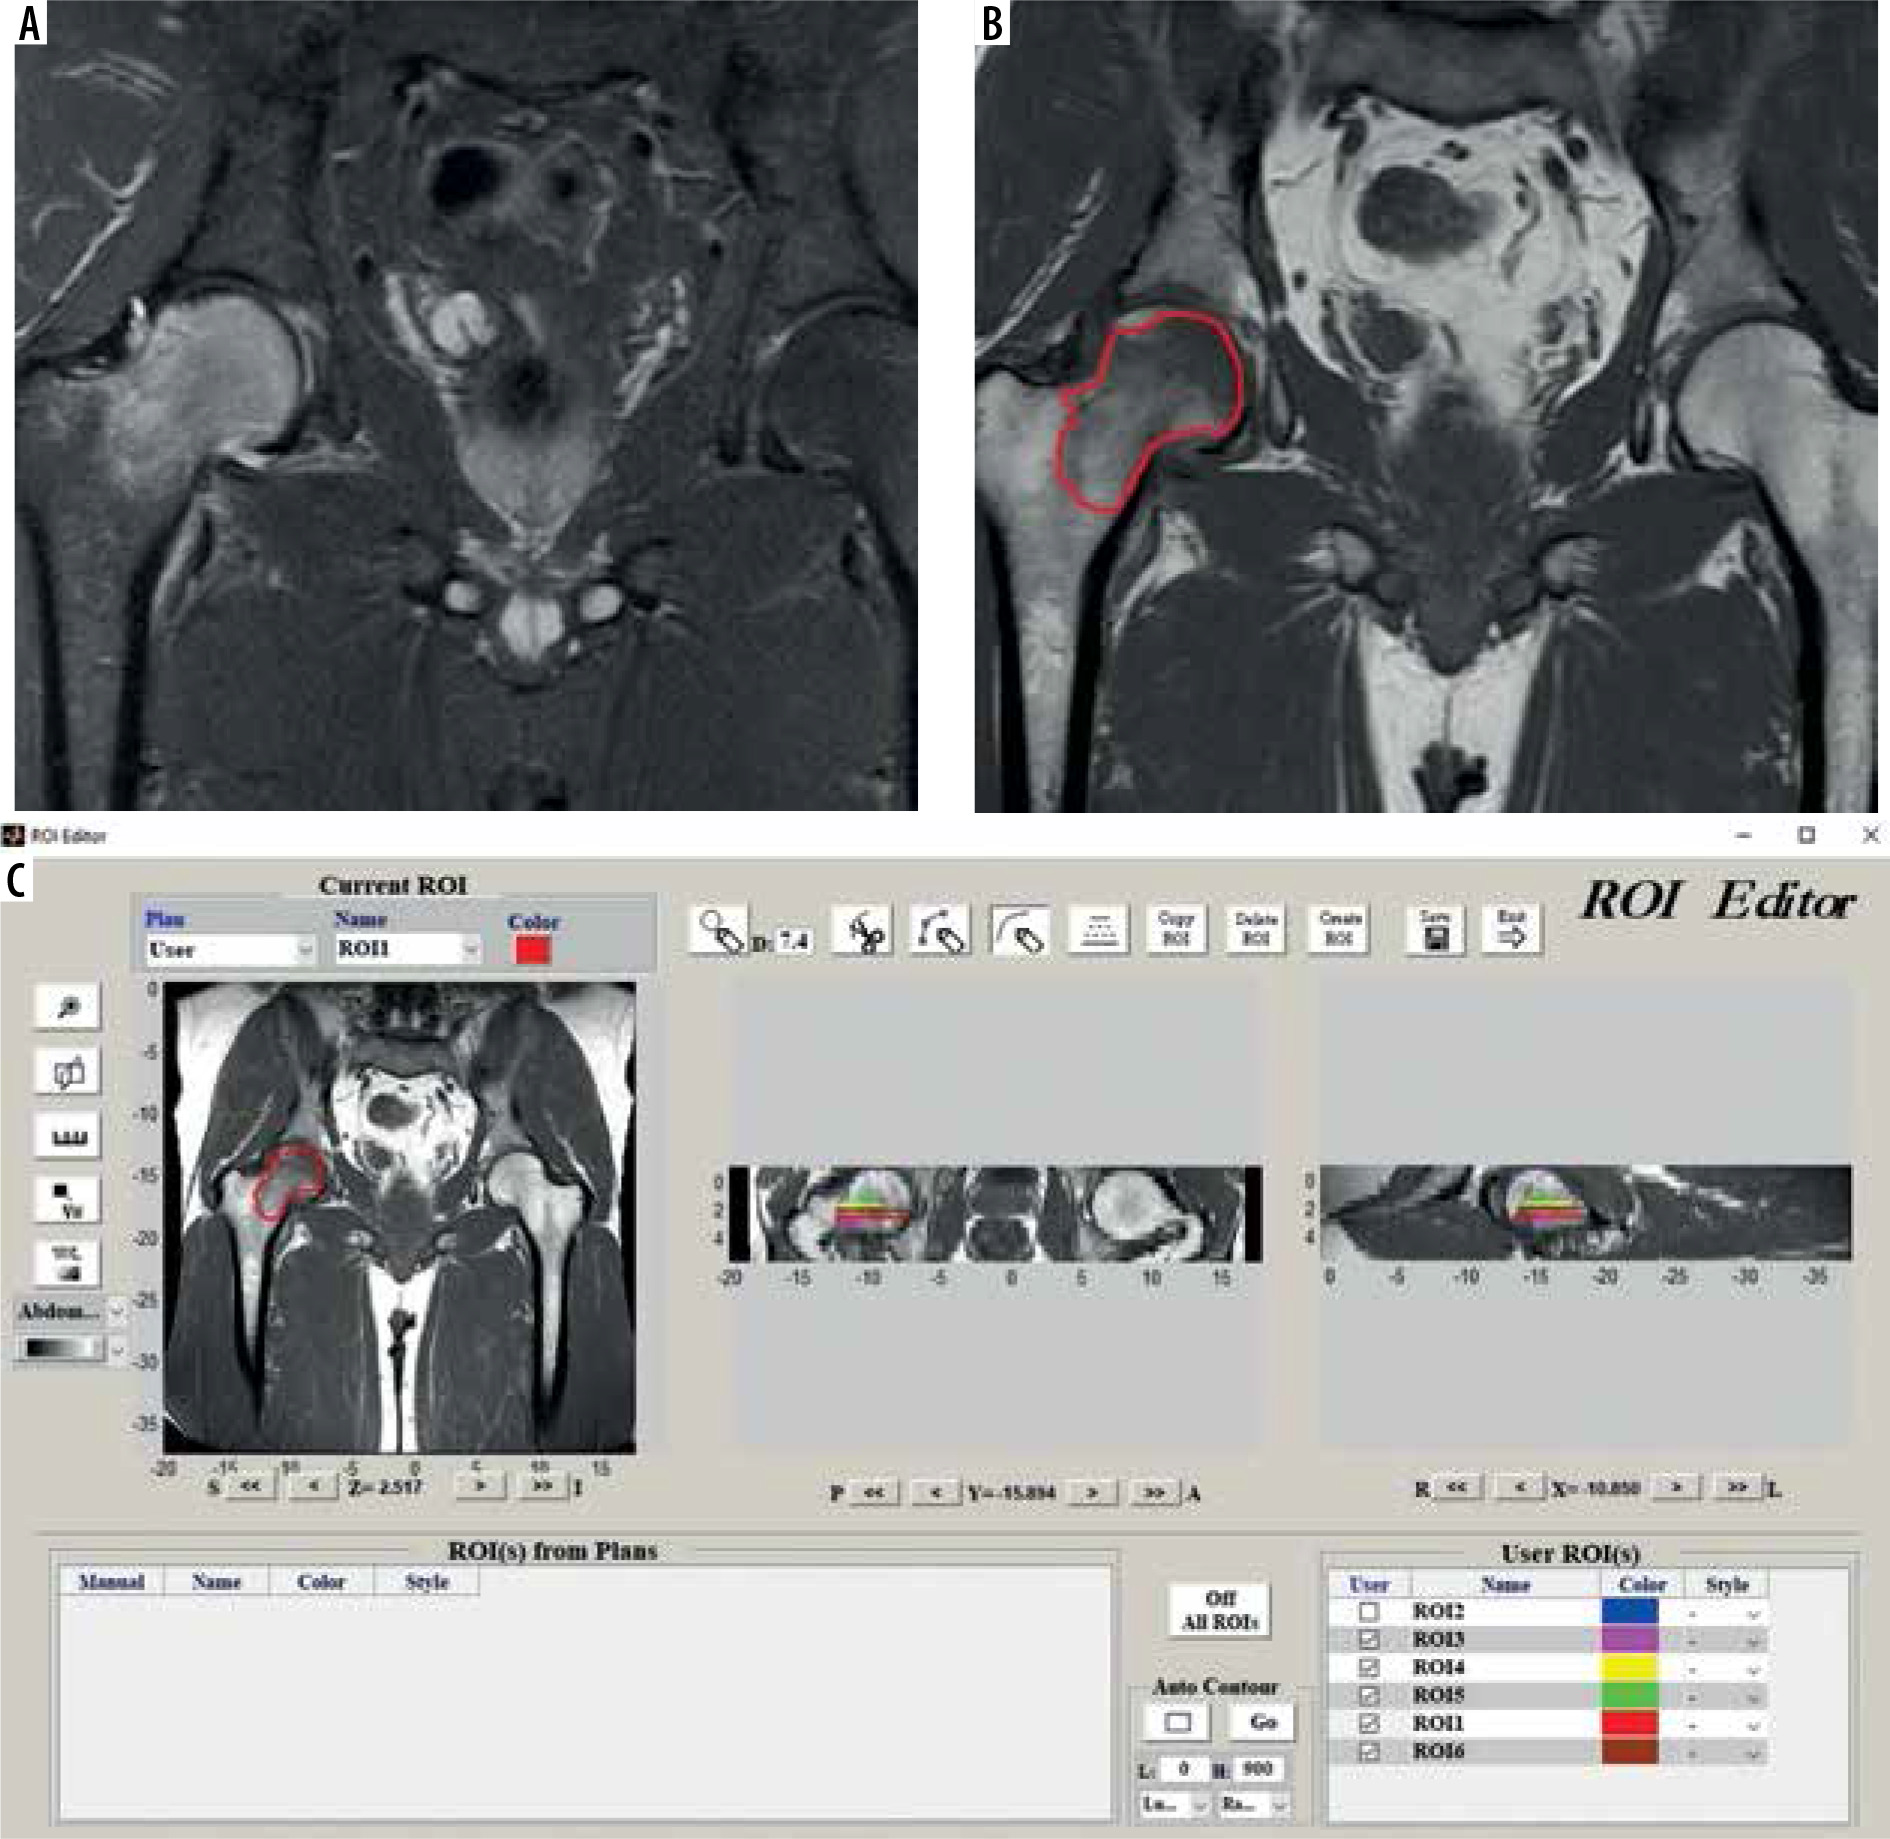
T1-weighted turbo spin echo images were utilized for analysis because radiomics features extracted from T1-weighted images were shown to be valuable tools in previous literature [10]. The images were acquired on a GE Signa Pioneer 3T scanner with a slice thickness of 4 mm, pixel size 0.57 × 0.57 mm, echo time of 12.4 ms, and repe-tition time of 688 ms. Relevant images were uploaded to IBEX software (University of Texas MD Anderson Cancer Center, Houston, TX, USA), and 2D segmentations were performed by 2 independent observers (H.B., 7 years of experience; B.A.R.M., 5 years of experience). Each lesion was segmented by choosing the largest single ROI per slice possible. In each section, the margins of the region of interest (ROI) containing the bone marrow oedema were determined manually using the free-hand method. Bone marrow oedema and normal marrow distinction was done based on the previous definition in the literature [1]. Because this definition includes an “ill-defined T1 hypointensity”, we used STIR images as a guide due to the conspicuity of oedema. Cortical bone, adjacent fat and muscle planes, and vascular structures were carefully excluded in each section while selecting the borders. We used 2D segmentation instead of 3D segmentation because the routine MRI protocol of our institution included only non-volumetric T1 sequences. An example of ROI acquisition is presented in Figure 2.
Figure 2
Depiction of segmentation process. A) Coronal STIR image ,which is not primarily used for segmentation but is used for guiding owing to conspicuity of marrow oedema in STIR images. B) Coronal T1 image that is segmented. C) Software interface during segmentation process. Please note depiction of multiple ROIs in coronal and sagittal images, which are serrated because the images are not volumetric
Texture analysis
Texture analysis was performed after the ROI of each lesion was obtained. The voxel size was re-sampled as 0.7 × 0.7 × 4 mm using the bi-cubic interpolation method. The number of bins for histogram preparation and grey-level discretization was set to 64.
The relationship of 2 neighbouring voxels, which forms the basis for the calculation of second-order parameters, was performed using offsets of one voxel and displacement vectors that isotropically separated from the centre voxel in 3D space as multiples of 45° in 13 different directions.
Because 2D ROIs were acquired, shape- and size-based parameters were not used for radiomics analysis.
After creating the presets, 74 radiomics parameters grouped as first and second order (Gray-Level Co-occurrence Matrix [GLCM], Grey-Level Run-Length Matrix [GLRLM], and Neighbouring Grey-Tone Difference Matrix [NGTDM]) were calculated using ROIs obtained by manual segmentation method.
Data analysis
Comparison of numerical variables among groups was done using the Mann-Whitney U (MWU) test.
The ability of the parameters to discriminate between the 2 groups was evaluated by receiver operating charac-teristic (ROC) analysis, calculating the area under the curve (AUC), sensitivity, and specificity. AUC values were reported with 95% confidence intervals and comparison to the AUC: 0.5 line. Sensitivity and specificity values were calculated for optimal thresholds, which were determined according to the Youden index.
Intraobserver reproducibility was assessed by Intraclasss Correlation Coefficient (ICC). ICC ≥ 0.75 was accepted as the cut-off for reproducibility [11].
Analyses were made using IBM SPSS v23 (IBM Corp, Armonk, NY), MedCalc v14.8.1 (MedCalc Software bvba, Ostend, Belgium), and XLStat statistical and data analysis add-on 2020.3.1 (Addinsoft, NY, USA) for Microsoft Excel 16.0.13029.
P < 0.05 was accepted as significant for all analyses.
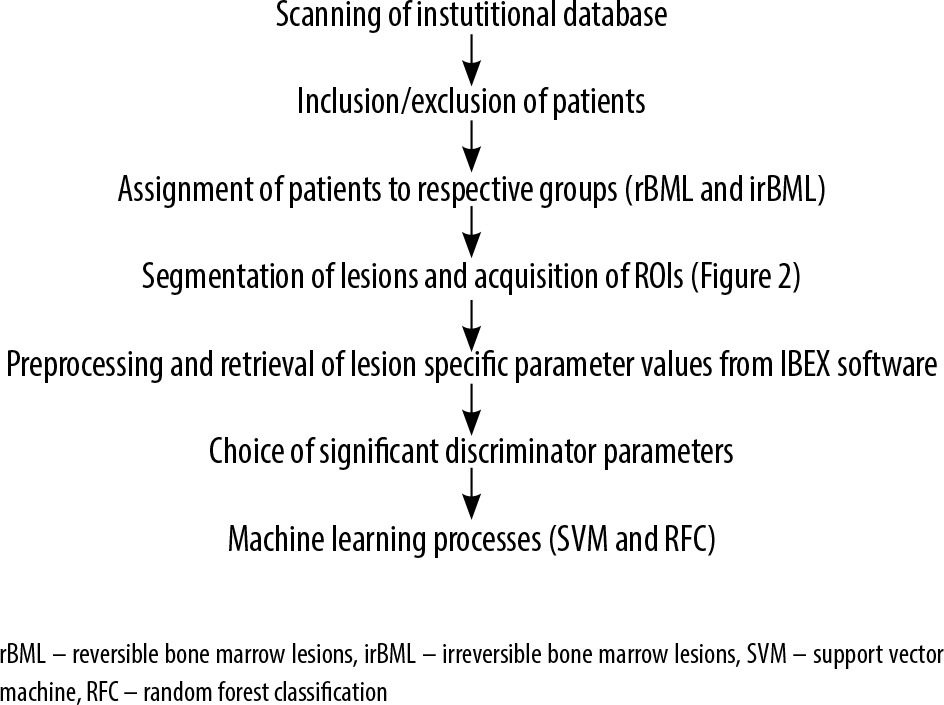
Figure 3 summarizes the flowchart of the study.
Machine learning
Support vector machine (SVM) [12] and random forest classifier (RFC) analysis [13] for machine learning were used.
Support vector machine
Parameters for SVM are as follows; power kernel, C value: 1.0, Tolerance: 0.1. Because radiomics parameter values have a considerable range, standardisation of values was performed as preprocessing. The study population was classified into training and validation sets regarding a ratio of 70:30. To diminish effects of variability and selection bias on estimates of performance, 1000-fold bootstrapping was performed similarly to the method proposed by Vrigazova et al. [14]. Area under the curve (AUC), and sensitivity and specificity of SVM were reported as mean with 95% confidence intervals.
Random forest classifier
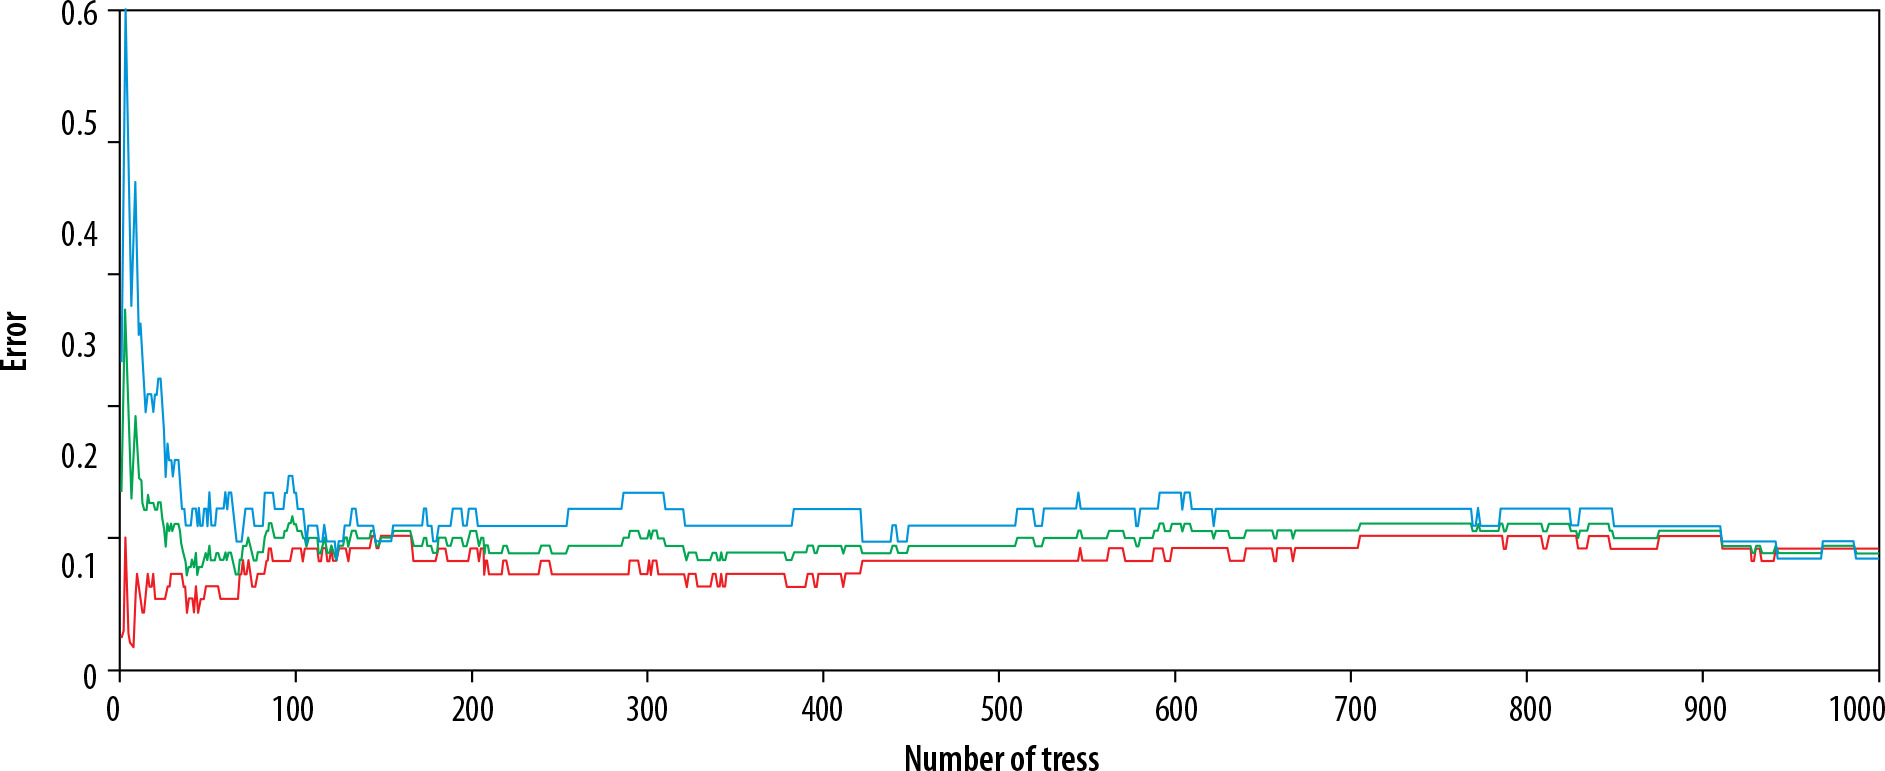
Parameters for RFC are as follows; method: bagging, sampling method: random with replacement, number of trees built: 1000. Maximum depth: 20. Diagnostic performance of RFC was reported with sensitivity, specificity, AUC, misclassification rate. An out-of-bag error evolution chart was supplied as well.
Results
Study population
A total of 37 patients were included. Seventeen demonstrated the aforementioned ON-related changes in follow-up images and were thus included in the irreversible group. Twenty demonstrated resolution of bone marrow oedema and thus were included in the reversible group. A total of 185 ROIs were attained from this population (mean = 5, range = 2-9 ROIs per patient). In total, 104 ROIs belonged to the reversible group and 81 ROIs belonged to irreversible group. Ten (27%) patients were female. The mean age was 45.7 ± 12 years. There was no significant difference regarding distribution of sex (p = 0.658) amongst the 2 groups. The reversible group was significantly younger (43.2 ± 7.1 vs. 49.6 ± 6.3, p = 0.028). Ten patients from the irreversible group and 10 patients from the reversible group had subchondral fractures that were visible on MR images. The mean interval between first and second examinations was 8.14 ± 0.36 weeks.
Inter-observer and Intra-observer reproducibility
Ten patients who produced 40 ROIs per observer during the segmentation process were chosen randomly. Then mean and range parameters from the first-order group were utilized for assessment of inter-observer correlation. According to both parameters, there was a significant correlation between the 2 observers (mean: ρ = 0.886, p = 0.02;range: ρ = 0.863, p = 0.024).
The same randomly chosen patients were used for assessment of intra-observer reproducibility. Two observers performed segmentation process twice. Then the “mean” and “range” parameters were utilized. According to both parameters, there was good intraobserver agreement for both observers. (Observer 1: mean ICC: 0.845 [range: 0.761-0.937], Observer 2: mean ICC: 0.867 [range: 0.777-0.940]).
Diagnostic performance of individual parameters
A total of 47 parameters had an AUC value significantly different from AUC:0.5 and were thus accepted as classifiers. AUC values ranged between 0.586 and 0.718. Their respective ROC values are presented in Table 1.
Table 1
ROC characteristics of individual parameters.
Diagnostic performance of machine learning
Support vector machine
Forty-seven parameters, listed in Table 1, were supplied to SVM. Sensitivity was found to be 91.3% (85.6-96.2%), and specificity was found to be 85.1% (80.1-89.7%) in the validation set. The AUC was 0.921 (95% CI: 0.888-0.964).
Random forest classifier
In total, 1000 trees were built with the aforementioned 47 parameters. The misclassification rate was 0.189. Sensitivity was found to be 84.8% (79.1-89.3%), and specificity was found to be 76.7% (70.3-82.4%). AUC was 0.811 (95% CI: 0.763-0.868). The out-of-bag (OOB) error evolution chart is shown in Figure 4.
Discussion
To the best of our knowledge, this is the only study that evaluates the diagnostic accuracy of radiomics in the discrimination of reversible and irreversible BMLs of the hip before irreversible changes occur.
TBMES is a transient, self-limiting condition without a known aetiology. Although some mechanisms such as neurogenic and vascular hypotheses have been proposed, the exact pathogenesis remains uncertain [15-17]. Clinical presentation of TBMES includes a sudden-onset hip pain, effecting mostly males between the 4th and 6th decade of life and rarely females in the 3rd trimester of pregnancy [18]. The treatment approach mostly includes partial weight-bearing and administration of analgesics and anti-inflammatory agents [18,19]. In line with this information, we thought that all the reversible BMLs in our study were TBMES. Contrarily, ON is a more common aetiology of acute hip pain than TBMES. However, ON is a progressive disorder mostly due to secondary local or systemic conditions. Therefore, early surgical intervention can result in joint preservation [18].
In current clinical practice, MRI findings describing bone marrow oedema in TBMES are low signal intensity on T1-weighted images, high signal intensity on short-tau inversion recovery (STIR) and fat-suppressed T2-weighted images, and delayed enhancement in contrast-enhanced images with the lack of additional subchondral changes [20-22]. The existence of subchondral low signal intensity regions > 4 mm thick and > 12.5 mm long on T2-weighted and contrast-enhanced T1-weighted images has been found to be associated with irreversible lesions such as ON. A subchondral low signal intensity band-like lesion on T1-weighted images and the double-line sign seen on non-fat-suppressed T2-weighted SE or TSE images have been highly diagnostic criteria for ON [5,6]. Recently, quantitative dynamic contrast-enhanced MRI with high temporal resolution demonstrated promising results in differentiating TBMES from ON [23]. Nonetheless, the differential diagnosis is sometimes challenging because bone marrow oedema is a common condition with both disorders, and imaging findings can be unclear.
Diagnostic performance of individual parameters was subpar in the present study. The highest AUCs that could be achieved were 0.718 (GlobalMin), 0.714 (ShortRunLowGreyLevelEmphasis), 0.712 (10Percentile), 0.710 (LongRunLowGreyLevelEmphasis), and 0.709 (LowGreyLevelRunEmphasis). GlobalMin and 10Percentile are first-order parameters which state that more hypointense voxels are abundant in the tissue that was sampled. In the case of T1 images, this could be translated as more non-fat voxels. Lower values of these parameters suggested a diagnosis of irreversible BMLs, and consequently more non-fat areas. The remainder of the aforementioned parameters belong to the GLRLM group. GLRLM parameters assess uniformity of neighbouring voxels that run along vectors. Thus, bigger values suggest voxels with similar intensities lie along a longer vector, which could be translated as a more homogenous structure. In our study, we found that ON images had lower values, which depict heterogenous organisation of voxel intensities. In conclusion, based on these findings, we speculate that BML of ON contains non-fat areas such as blood or necrotic materials contrary to TBMES, which lacks these components.
A recent study that assessed utility of radiomics and interpretation of conventional MR images by radiologists reported an AUC value up to 93.7% for machine learning techniques and 90.6% for musculoskeletal radiologists [24]. The authors reported that the diagnostic performance of radiomics was similar to MSK radiologists. However, points of the paper are well taken, included ON cases demonstrating signs such as band-like sign, single/double line signs, and crescent signs, which state that articular damage has already settled to some extent. Moreover, images were acquired with either 1.5T or 3T scanners. Because the field strength affects the signal properties of voxels, contrary to previous studies, we aimed for the utility of standardized and uniform hardware in order to eliminate the effect of field strength on the radiomics parameters.
Even though it has been suggested by some authors that BML is a late manifestation of ON which is secondary to subchondral fractures [18,25], our findings were not concordant with these statements. Despite showing BML on MR images, 7 of the 17 ON patients lacked a subchondral fracture on CT. Interestingly, 10 of 20 TBMES patients had a subchondral fracture, as well. There was no significant difference regarding parameters when patients with subchondral fractures were compared to those without visible fractures within their respective group (Table 2).
Table 2
Comparison of parameters between patients with and without subchondral fractures
Thus, we concluded that the presence of subchondral fractures does not cause a significant alteration in parameter measurements.
As stated before, propagation of BML in ON patients has been a dilemma [23,24,26,27], and we refrain from commenting further on this topic. Furthermore, it is worth noting that the presence of a subchondral fracture did not affect the radiomics parameters. The main purpose of our work is to suggest a ML-based model that differentiates irreversible BMLs from reversible BMLs before articular damage occurs.
The retrospective design of our study could be considered as a limitation. Second, due to partial missing data regarding patient characteristics, we failed to implement a clinical model that could have included known risk factors for ON such as history of corticosteroids, bisphosphonate, vasculitis, and chronic alcohol consumption. Throughout the study, we were careful to use the definition of irreversible or reversible BMLs instead of ON or TBMES as much as possible due to different opinions in the literature. This might be another limitation, but our aim in this study was to interpret the prognosis of BMLs observed at femoral head with ML, not to make a pathological diagnosis or staging the disease. Third, due to the limited sample size, we opted for an internal validation process. Notwithstanding that external validation produces more robust and generalizable results, our sample size was far from the minimum (at least 100 samples) or optimal (at least 200 samples) that were suggested in the current literature [28]. Also, we used 2D segmentation because the routine imaging protocol in our institution includes non-volumetric images only. This precluded utility of shape- and size-based radiomics parameters. Finally, evaluation of subchondral fractures with MR images could also be accepted as a limitation because CT has been shown to be more sensitive regarding this issue [18].
Conclusions
Our findings show that radiomics analysis could prove useful for discrimination of reversible and irreversible BMLs. While we achieved an AUC value of 0.921 for SVM and 0.892 for RFC, the specificity was rather low (85.1% for SVM and 76.7% for RFC). Thus, we are far from the recommendation of surgical intervention based solely on radiomics. Studies with larger sample sizes and pre-defined 3D protocols and models combined with clinical features could provide better diagnostic accuracy and guide the decision-making process for clinical management of patients with BMLs of the hip.