


Introduction
Brain tumours pose a huge economic and social burden on health care systems and hence are considered to be one of the important health problems and also a leading cause of mortality and morbidity in all age groups globally. The global burden of primary and secondary brain tumour has significantly increased in recent years [1]. The quality and expectancy of life in brain tumour patients can be improved by proper planning of treatment, radiotherapy and chemotherapy, and further monitoring.
Magnetic resonance imaging (MRI) is widely used in the diagnosis and follow-up of brain tumour patients due to its high sensitivity and its ability to exquisitely delineate anatomic relationships. Conventional structural MRI is used to characterize morphology of the mass lesion, and assess the extent of lesion and the mass effect. On conventional MRI, brain tumours display heterogeneous characteristics because the components within them have various degrees of cellular and nuclear pleomorphism, necrosis, mitotic activity, and vascular proliferation [2,3]. The accuracy of conventional MRI in grading brain tumours varies from 55% to 83.3% [4-6]. It is not sufficient to accurately characterize brain tumour only on the basis of conventional MR imaging. Also, in patients with high-risk lesions for biopsy or in tumours that are inoper-able, the lack of grading is a limitation of conventional MRI [6,7]. For such information, physiological imaging, such as perfusion methods, are ideally suited.
Perfusion studies help us to determine the areas showing neo-angiogenesis and vessel wall permeability, correlating with areas of maximal dedifferentiation. Multiple studies have also shown that perfusion MR techniques can noninvasively estimate tumour grade preoperatively [8] and directly demonstrate the regions of the tumour that are vascular, and help in guiding biopsy from the most suitable area, which in turn allows accurate detection of the degree of neoplasm. Various studies done previously have proven that the DSC perfusion MRI technique is effective in differentiating low-grade brain tumours from high-grade brain tumours [9-13]. ASL, being a comparatively new technique, does not require contrast administration for the evaluation of perfusion parameters, unlike the DSC perfusion MRI technique, which requires gadolinium-based contrast agent. The ASL perfusion technique is non-invasive and low-cost [14]. It uses arterial water as an endogenous tracer by magnetically labelling the blood water protons of cerebral arteries and provides quantification of cerebral blood flow [14]. Both high-grade tumours and low-grade tumours show increased blood flow in them; however, the blood flow increases with tumour grade.
Material and methods
Patient population
A cross-sectional study was conducted in the Department of Radiodiagnosis and Imaging of a tertiary care teaching institution after obtaining approval from Institutional Human Ethics Committee and research review board.
All consecutive patients with suspected intra-cranial neoplasm were evaluated during the study period. Patients with infarct, haematoma, infective and demyelinating lesions, or prior history of intra-cranial surgery, radiotherapy, or chemotherapy were excluded from the study.
Finally, 41 patients with histologically proven intra-axial brain tumours (31 males and 10 females with mean age of 40.61 ± 13.58 years, age range 18 to 86 years) who met our inclusion criteria were evaluated.
Magnetic resonance imaging acquisition and interpretation
Magnetic resonance imaging of the brain was performed on a GE DISCOVERY MR750W 3-Tesla MRI scanner with a 32-channel head coil. T1-weighted axial, T2-weighted axial, FLAIR axial, SWI axial, DWI axial, T1-weighted sagittal, and T2-weighted coronal MR images were obtained for conventional MR brain imaging. Parameters of conventional MR imaging were the following: T1-weighted axial, matrix = 205 × 256 (T2 weighted = 246 × 448); FOV = 230 mm; TR = 459 ms (T2 weighted = 4270 ms). Slices were taken with no overlapping cuts. Slice thickness was 3-5 mm according to the lesion. Plain study was done in all patients, followed by intravenous administration of gadodiamide (Omniscan; GE Healthcare) in a bolus of 0.1 mmol/kg with a power injector (Spectris Solaris; Medrad) at a rate of 3 ml per second and flushed with 10 cc of saline using 20 G intravenous catheter.
To obtain the DSC perfusion maps, repeated rapid imaging of the brain was performed during the first pass of contrast agent. This created a series of images with signal in each voxel of image representing intrinsic tissue T2* signal and generation of a signal intensity/time curve.
To obtain the ASL perfusion maps, a 3D pseudocontinuous ASL (PCASL) technique was employed. The arterial blood was tagged, and images were obtained. Then control images were obtained after a post-labelling delay, which was adjusted according to the age of the patient (Table 1). The labelled images and control images were then subtracted to obtain the perfusion maps.
Table 1
Post-labelling delay measurements according to age
| Age (years) | Time (ms) |
|---|---|
| 0-15 | 1025 |
| 16-40 | 1525 |
| 41-50 | 2025 |
| 51-75 | 2525 |
| > 75 | 3025 |
Magnetic resonance imaging scans of brain tumours were reviewed and evaluated. The conventional MRI features of the tumours were recorded, defining the morphological aspects of the tumours by their shape and contours, signal intensities on basic sequences (T1, T2, and FLAIR), and pattern of intravenous contrast enhancement.
Post processing of DSC and ASL perfusion data was done on an AW workstation to obtain rCBV (for DSC perfusion), rCBF, and CBF maps, respectively, for each patient. Three ROIs (regions of interest) were drawn in the region of the tumour showing the highest perfusion value. The ROI drawn were of approx. 4-7 mm2 in area. Care was taken to avoid the regions containing vessels, haemorrhage, calcification, necrosis, and cystic areas. To obtain normalized data, a ROI of the same size was placed in the region of the brain showing normal grey matter (GM) perfusion. Th average of the 3 ROI values was taken to obtain a mean value. The mean value was divided by the normal GM ROI to obtain a normalized value.
Histopathological analysis
All of the patients were followed up with their histopathological data (stereotactic biopsy or surgical resection). The lesions designated as WHO grade I and grade II were included under low-grade tumours. The lesions designated as WHO grade III, WHO grade IV, and metastasis were included under high-grade tumours.
Statistical analysis
Data were collected using preformed patient case data sheets. Collected data were entered into Excel sheets (Microsoft Excel version 16.51) and then transferred after data cleaning and rechecking to Epi Info software (Epi Info version 7.2) for analysis and the online receiver operating characteristics (ROC) software StAR [15].
Nominal data, such as lesion type, are presented using absolute frequencies and percentages. Metric data like perfusion parameters are presented using mean and standard deviation. Categorical variables such as lesion shape were compared between low-grade and high-grade tumours using chi-square/Student’s t-test. Differences in perfusion parameters between low-grade and high-grade tumours were calculated using Student’s t-test with value of p < 0.05 being considered statistically significant. To evaluate the diagnostic validity of perfusion parameters, the histological result was considered the reference. ROC analysis was performed to compare the diagnostic performance of different perfusion parameters. A feasible cut-off value of perfusion parameters for the differentiation of high-grade and low-grade tumours was found by using ROC analysis. Lesions with values equal to or less than the given cut-off value were considered low grade, and lesions with values greater than the given cut-off value were considered high grade. All the analyses were performed at a 5% level of significance.
Results
Among the 41 patients included, male predominance was noted in intra-axial brain tumours with 31 patients being male, and with a male-to-female ratio of 3.1 : 1. Among low-grade tumours, 12 patients (75%) were male, and among high-grade tumours, 19 patients (76%) were male.
Conventional MRI features
Most of the intra-axial brain tumours were supra-tentorial in location (92.6%). Among high-grade tumours, glioblastoma multiforme (GBM) was the most common type. Among low-grade tumours, diffuse astrocytoma was the most common type. Overall, brain tumours were found to most commonly involve the frontal lobe (43.9%). Our study included 25 cases of high-grade tumours and 16 cases of low-grade tumours. The mean largest dimension of the intra-axial tumours was 5.1 ± 1.75 cm.
High grade tumours included 13 cases of glioblastoma multiforme NOS (WHO grade IV), 4 cases each of anaplastic oligodendroglioma (WHO grade III) and anaplastic astrocytoma (WHO grade III), and one case each of anaplastic ependymoma (WHO grade III), anaplastic oligoastrocytoma (WHO grade III), brain stem glioma, and metastasis.
Low-grade tumours included 10 cases of diffuse astrocytoma (WHO grade II), 4 cases of oligodendroglioma (WHO grade II), and one case each of sub-ependymoma (WHO grade I) and DNET. The conventional MR imaging features of low-grade and high-grade lesions are summarized in Table 2.
Table 2
Conventional MR imaging characteristics of brain tumours
Quantitative parameters of perfusion MRI
The normalised perfusion values were obtained by obtaining ratio of lesion to normal grey matter perfusion parameter. The mean rCBV lesion/NGM on DSC was 0.99 ± 0.75 (range: 0.1-2.6) in low-grade tumours and 2.63 ± 1.38 (range: 0.7-5.7) in high-grade tumours. The mean rCBF lesion/NGM on DSC was 0.89 ± 0.70 (range: 0.1-2.5) in low-grade tumours and 2.16 ± 1.21 (range: 0.9-5.9) in high-grade tumours. The mean rCBF lesion/NGM on ASL was 0.91 ± 0.49 (range: 0.2-1.7) in low-grade tumours and 2.22 ± 1.24 (range: 0.6-5.7) in high-grade tumours. The representative cases of low-grade and high-grade brain tumours with DSC and ASL perfusion are shown in Figures 1-3.
Figure 1
A 48-year-old female with diffuse astrocytoma grade II in left fronto-temporo-insular region. A) Axial T1WI showing iso to hypointense mass. B and C) Axial T2W and FLAIR images respectively showing homogenous hyperintense mass without significant peri-tumoral edema. D) Post contrast T1W images show no enhancement. E and F) DSC perfusion images reveals that the lesion shows no evidence of increased perfusion on rCBV and rCBF perfusion maps with nCBV/NGM value = 0.1 and nCBF/NGM value = 0.1. G) ASL rCBF perfusion maps also showing no significant increase in perfusion with nCBF/NGM = 0.4
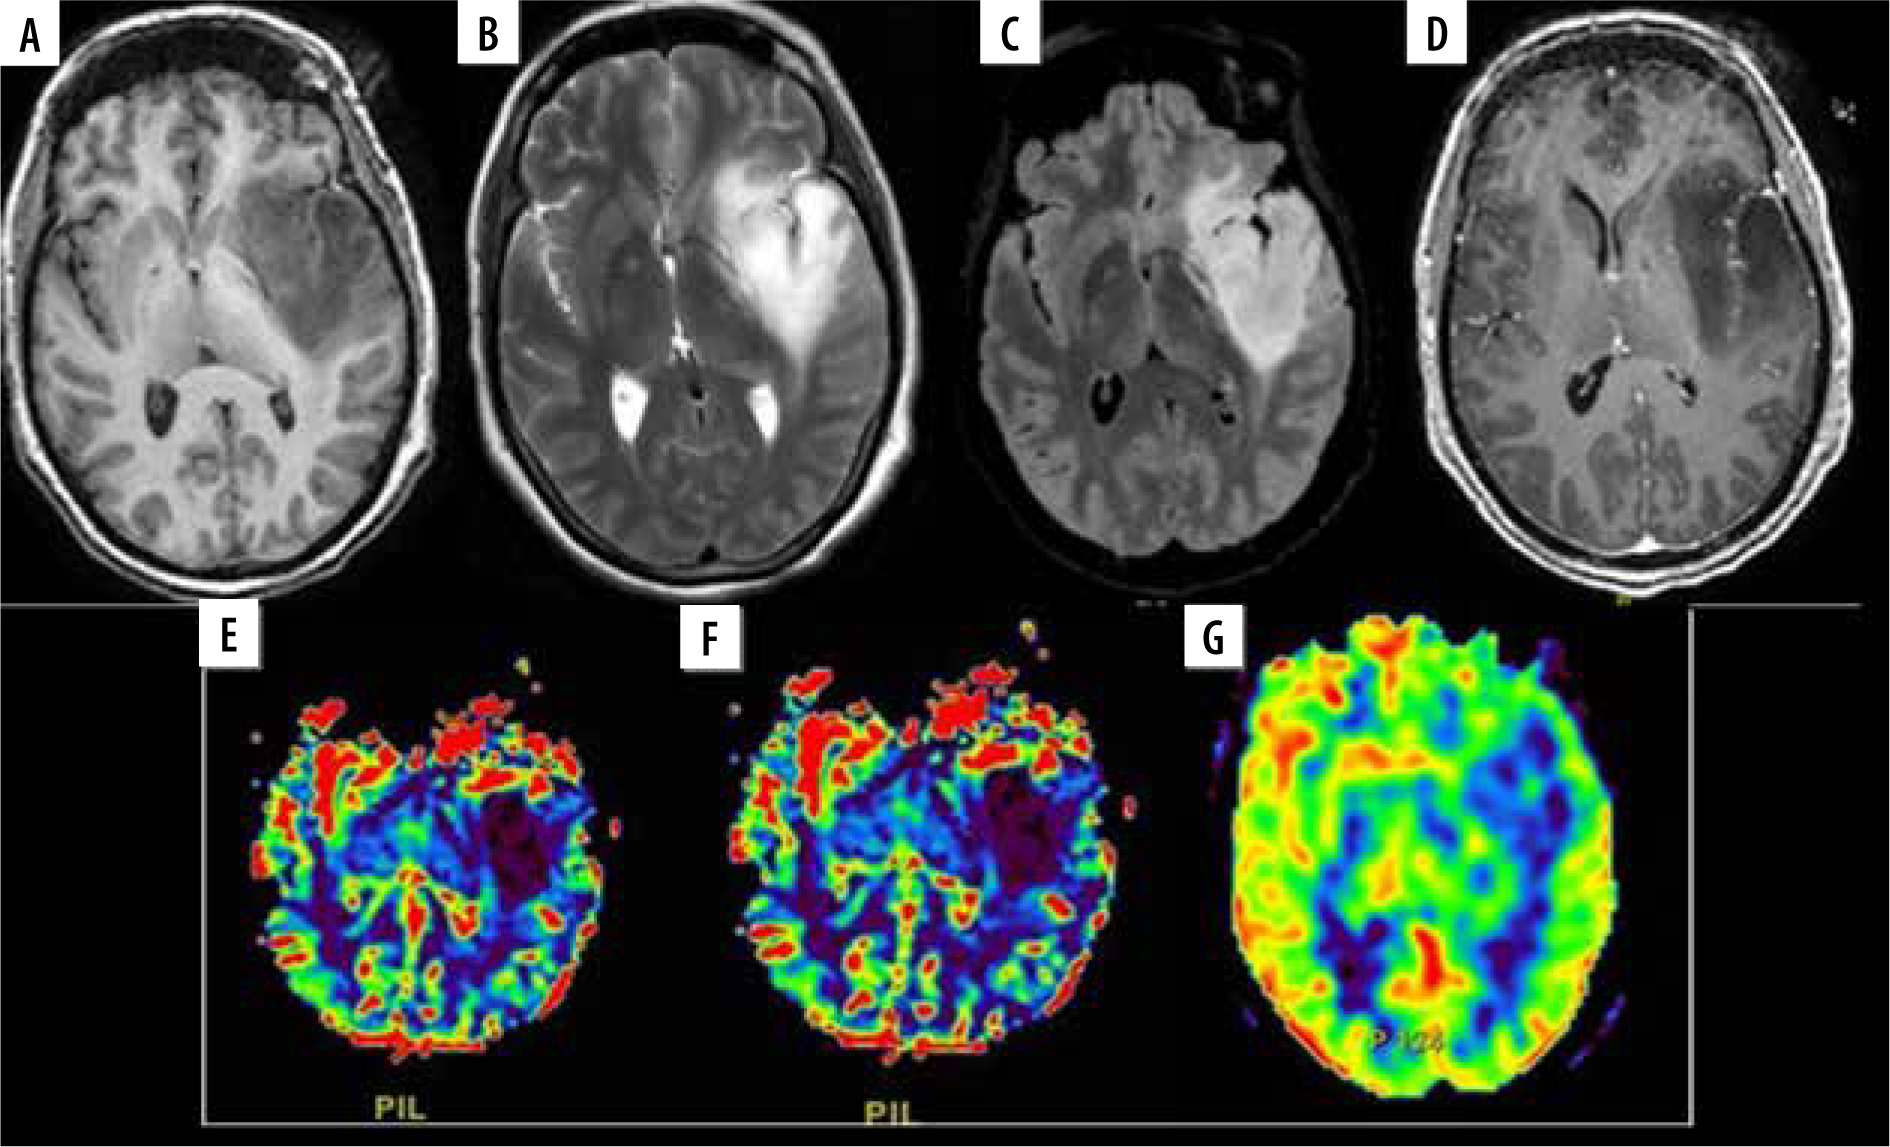
Figure 2
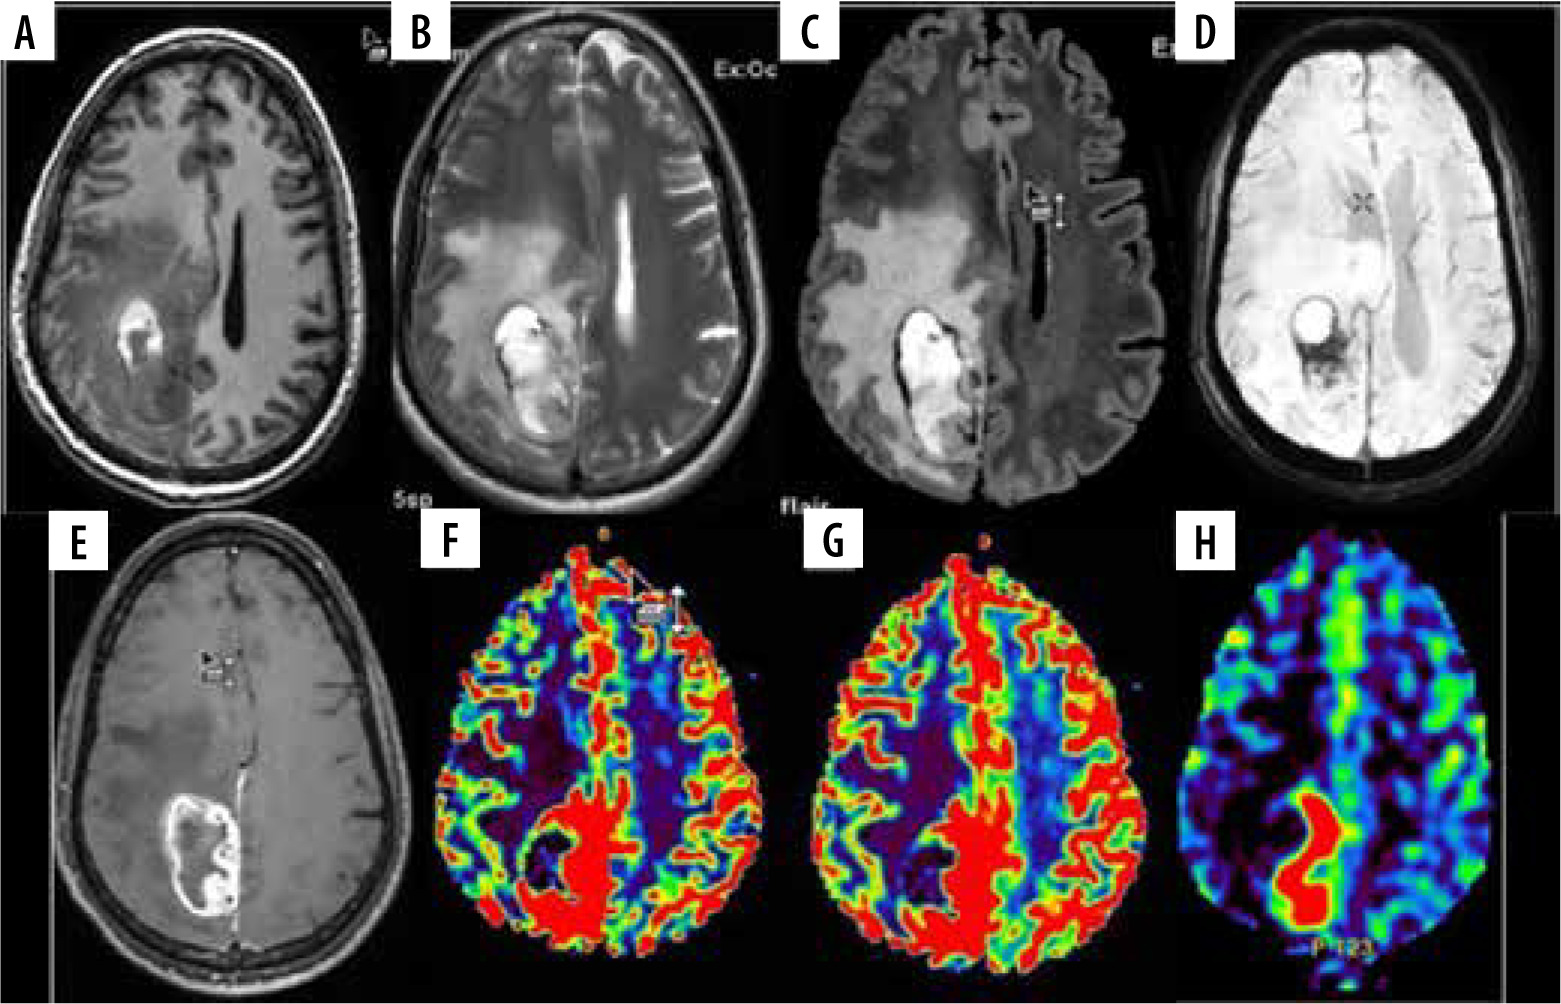
A 35-year-old female with anaplastic oligodendroglioma grade III in the right temporal lobe. A) Axial T1W image showing ill-defined iso- to hypointense mass; B and C) axial T2W and FLAIR images, respectively, showing ill-defined heterogeneous hyperintense mass with few cystic areas and mild peri-tumoral oedema. D) SWI showing areas of blooming which on phase correlation corresponded to haemorrhage. E) Axial T1W post-contrast images showing curvilinear peripheral enhancement. F and G) Axial DSC perfusion images reveal increased perfusion on rCBV and rCBF perfusion maps with nCBV/NGM value = 3.7, nCBF/NGM = 2.5; H) ASL rCBF perfusion maps also showing increase in perfusion with nCBF/NGM = 1.6
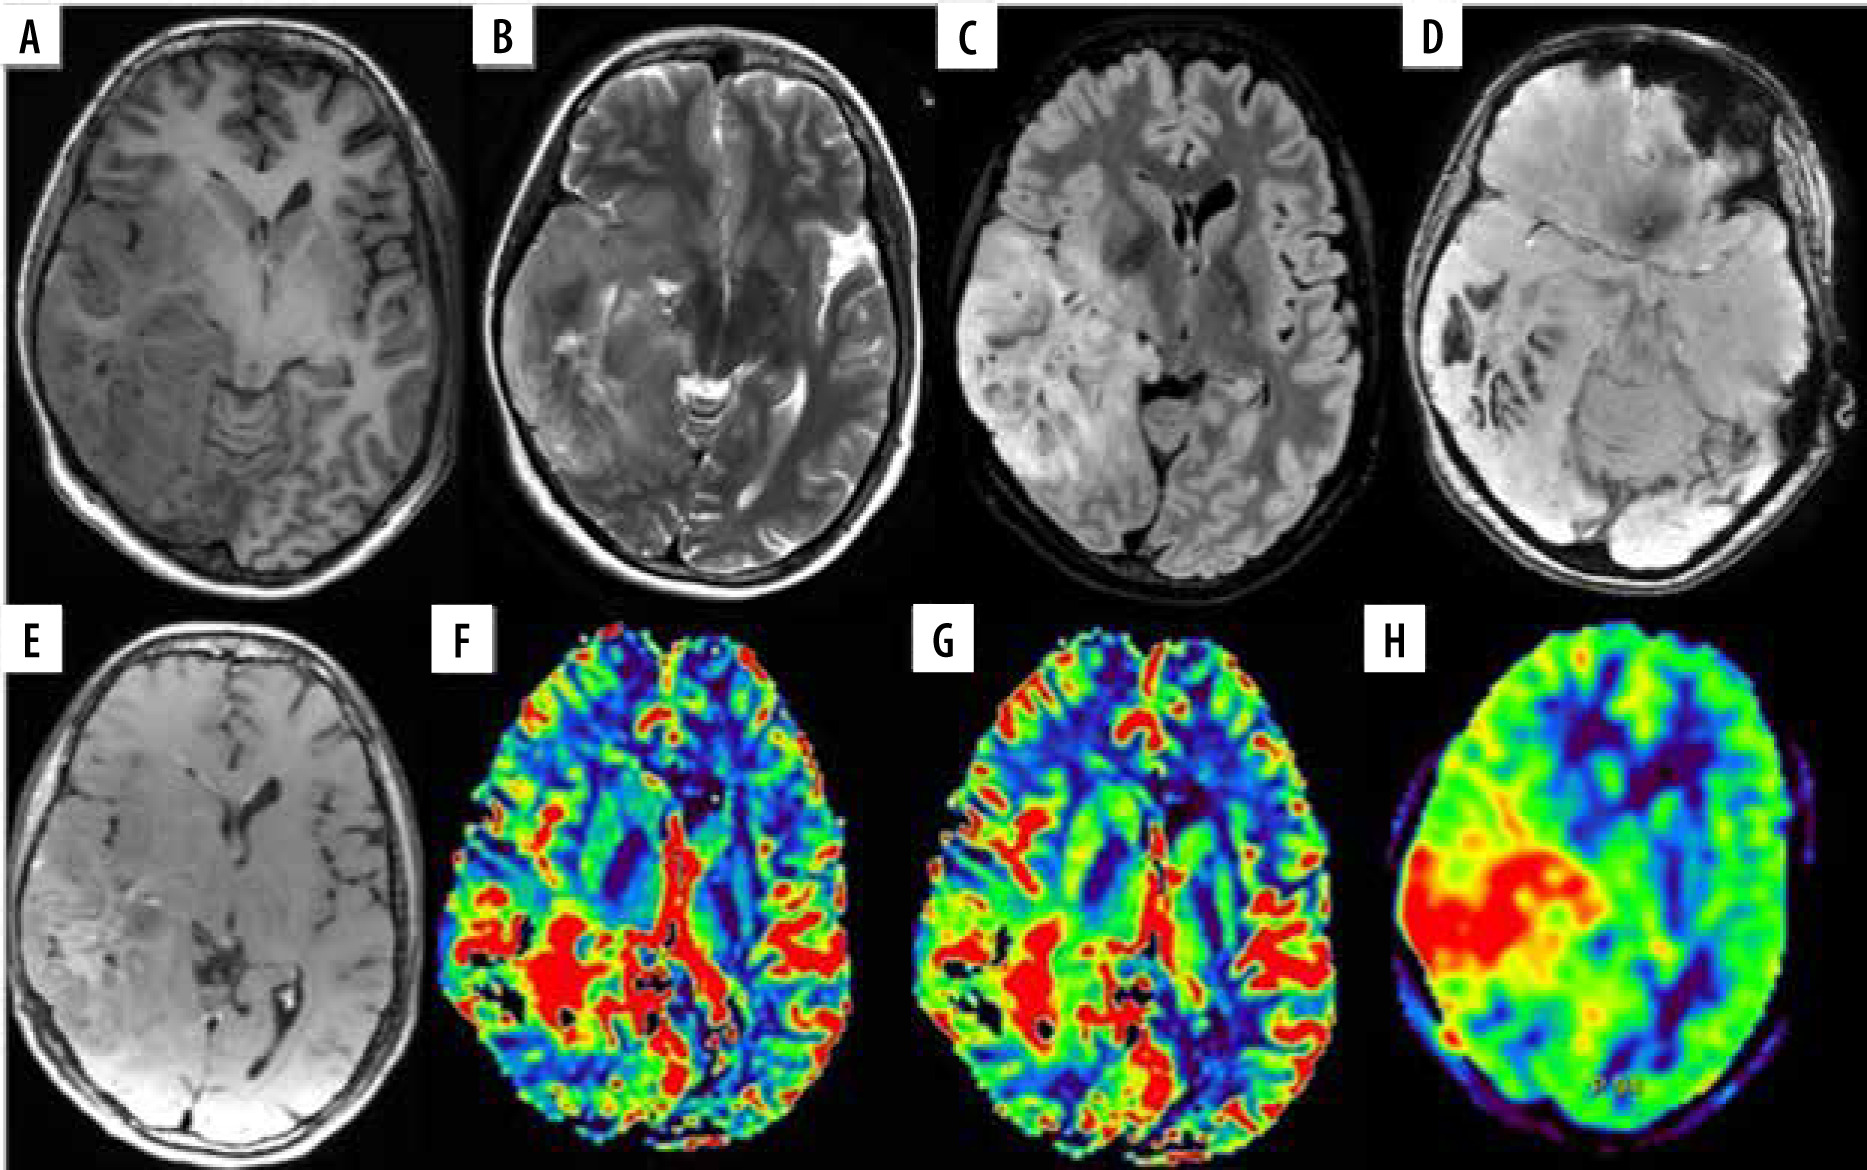
Figure 3
A 45-year-old male with glioblastoma multiforme NOS grade IV in right parieto-occipital region. A) Axial T1W image showing heterogenous iso- and hyperintense mass lesion with surrounding hypointensity. B and C) Axial T2W and FLAIR images, respectively, showing ill-defined heterogeneous hyperintense mass with significant peri-tumoural hyperintensity indicating oedema or infiltration. D) SWI showing areas of blooming which on phase correlation corresponded to haemorrhage. E) Axial T1W post-contrast images showing thick nodular peripheral enhancement. F and G) Axial DSC perfusion images reveal increased perfusion on rCBV and rCBF perfusion maps predominantly at medial and posterior aspect. nCBV/NGM value = 1.9, nCBF/NGM = 0.9; H) ASL rCBF perfusion maps also showing increase in perfusion at the same location as DSC perfusion with nCBF/NGM = 2.0
ROC curve analysis showed that the normalised perfusion parameters obtained by both ASL and DSC techniques were able to differentiate low-grade tumours from high-grade tumours. The area under the curve, cut-off values obtained, and their sensitivity and specificity for various perfusion parameters are summarized in Table 3.
Table 3
Summary of quantitative parameters of perfusion magnetic resonance imaging
Scatter plot analysis showed statistically significant strong correlation between normalised CBF obtained by DSC perfusion and ASL perfusion (Pearson’s correlation co-efficient – r = 0.79), normalised CBV by DSC and normalised CBF by ASL (r = 0.77), and normalised CBF and CBV by DSC (r = 0.89).
Discussion
Our study aimed at assessing the effectiveness of arterial spin labelling (ASL) perfusion MRI in assessment of tumour grade in comparison to dynamic susceptibility contrast (DSC)-enhanced perfusion MRI technique. Both high-grade tumours and low-grade tumours show increased blood flow in them; however, the blood flow increases with tumour grade. Our study also demonstrated that perfusion in tumours increases with tumour grade.
rCBV corresponds to the angiogenesis within the tumour part, which is important for tumour growth. Study done by Al-Okaili et al. showed that the grade of tumour corresponds to rCBV [16].
In a study done by Wolf et al. multi-slice (containing 12 image sections) CASL perfusion technique was performed on 3 T scanner and concluded that low-grade gliomas could be differentiated from high-grade gliomas pre-operatively [17]. In our study a PCASL multi-slice perfusion technique was used. The relatively newer 3D PCASL sequence incorporates high-field, parallel imaging along with background suppression and hence provides increased sensitivity [18]. This allows the ASL technique to shift from the research stages to its clinical usage [19]. Among the ASL and DSC perfusion maps, the slice in which the lesion was visible and showed the highest signal intensity was used for perfusion parameter evaluation. rCBV parameter obtained from the rCBV maps created by DSC perfusion maps is the most important value in perfusion MRI characteristics of tumours [11,20]. Knopp et al. found the mean rCBV value of 1.44 in low-grade gliomas and 5.07 in high-grade gliomas [21]. Law et al. found rCBV to be 2.14 in low-grade glial tumours and 5.18 in high-grade glial tumours [22]. Hakyemez et al. gave a cut-off value of rCBV of 2.0 to differentiate high-grade and low-grade glial tumours and reported an rCBV value of 1.16 for low-grade tumours and 3.32 for high-grade tumours [23]. Recently, studies have shown that the CBF value has similar diagnostic value as that of the CBV value [23,24]. The ASL technique is only able to measure rCBF and creates CBF maps. In both the perfusion techniques used, the post-processing algorithm differs, and hence these techniques give us different perfusion parameters [25-30]. DSC-MRI is primarily based on T2-weighted imaging and hence requires faster dynamic echo planar scan with parallel imaging to cover the whole brain. ASL perfusion MR provides CBF values by advanced post-processing algorithms and careful selection of arterial input function (AIF). Hence, normalisation of these parameters with grey matter (GM) was done in our study. Normalisation also avoids patient-dependent and age-related CBF variations (303), thus providing more consistent, comparable, and repeatable parameters. Our study showed that the AUC curves obtained by normalisation of rCBF and rCBV values by GM in DSC and normalisation of rCBF by GM in ASL techniques showed statistically significant higher area than rCBF of lesion obtained by DSC perfusion technique (p = 0.031 for rCBF/NGM ASL, p = 0.021 for rCBV/NGM and p = 0.044 for rCBF/NGM DSC).
In our study, the normalised rCBV values by GM obtained by DSC perfusion showed mean values of 0.99 for low-grade tumours and 2.63 for high-grade tumours. The normalised rCBV values by GM were found to be significantly higher in high-grade tumours compared to low-grade tumours (p < 0.001). In the present study, the normalised rCBF values by GM obtained by DSC perfusion showed mean values of 0.89 for low-grade tumours and 2.16 for high-grade tumours. These values on ASL perfusion were 0.91 for low-grade tumours and 2.22 for high-grade tumours. Furthermore, the normalized rCBF values by GM were found to be significantly higher in high-grade tumours than in low-grade tumours (p < 0.001 for DSC and ASL). Our study also demonstrated that there was strong correlation between normalised CBF obtained by DSC perfusion and ASL perfusion (r = 0.79), normalised CBV by DSC and normalised CBF by ASL (r = 0.77), and normalised CBF and CBV by DSC (r = 0.89).
Impaired blood-brain barrier and the reasons that impair magnetic field homogeneity are seen to have less of an influence on ASL perfusion maps when compared to DSC perfusion maps. In a recent study done by Jarnum et al. it was reported that rCBF values measured by both the methods give similar results; however, the ASL perfusion technique had lower susceptibility artifact scores [27]. Other studies done by Knutsson et al., Jiang et al., and White et al. have also compared ASL perfusion and DSC perfusion techniques and found a positive correlation between the results obtained by both methods [19,31,32]. Most of the studies have stated the opinion that ASL perfusion technique can be used as a non-invasive alternative to grade the tumours and assess perfusion parameters. Our study showed that the normalisation of rCBF values by GM revealed similar cut-off values on DSC (cut-off: 1.1) and ASL (cut-off: 1.3) techniques with similar specifi-city (68.75%), but with slightly higher sensitivity of DSC technique (sensitivity of DSC – 88% and ASL – 80%). Our study was also of the opinion that the perfusion values obtained by both the techniques are almost similar with almost similar sensitivity and specificity. Hence, ASL can be used as an alternative perfusion parameter in grading of brain tumours.
Zhang et al. concluded that rCBV > 1.75 is indicative of malignant growth [33]. Lev et al. concluded that a cut-off value of 1.5 showed 100% PPV between high-grade and low-grade gliomas [34]. In our study, at a cut-off of 1.7, normalised rCBV by GM measured by DSC perfusion showed sensitivity of 68% and specificity of 87.5%, normalised rCBF by GM measured by DSC perfusion showed sensitivity of 56% and specificity of 81.25%, whereas normalised rCBF by GM measured by ASL perfusion showed sensitivity of 64% and specificity of 93.75%.
A limitation of our study was the small sample size. Our study had an inadequate number of metastatic lesions to distinguish high-grade glial tumours and metastatic tumours. Furthermore, our patient collective contains a high relative number of high-grade brain tumours compared to low-grade brain tumours. This is due to the fact that our institution is a tertiary care centre, and many patients are referred either because of symptomatic brain tumours or for second-look examinations after imaging abnormalities were detected in other institutions.
Conclusions
Arterial spin labelling can be used as an alternative to DSC perfusion for evaluation of brain tumours, to distinguish high-grade tumours from low-grade tumours. The basic advantage of ASL perfusion MRI is that it does not require administration of a contrast agent and hence can be performed in patients with renal failure or in pregnant women, and it can be repeated if required. Normalised rCBF by GM obtained by ASL and DSC perfusion techniques had close cut-off values with similar specificity and near similar sensitivity. Normalisation of these values by GM gives us more reliable parameters, eliminating the different technical parameters involved in both the techniques.