


Introduction
Independent of overall obesity, abdominal obesity is a significant factor in the development of metabolic syndrome [1,2]. As a result, central fat deposits are a significant part of the pathogenesis of metabolic disorders. Abdominal adipose tissue is divided into visceral and subcutaneous adipose tissues, which have different metabolic risk profiles. The correlation between visceral adipose tissue and cardiometabolic risks is stronger than that between subcutaneous adipose tissue and cardiometabolic risks [3-5]. In addition, the actual visceral adipose tissue volume is a more accurate predictor of metabolic syndrome than the visceral adipose area [6]. When subcutaneous adipose tissue becomes saturated with fat, it is stored in the visceral adipose tissue [4].
In a recent cohort research with a 9.3-year follow-up, people in the medium and high tertiles of visceral fat had an increased risk of cardiovascular disease (CVD). Subcutaneous fat and CVD events, however, did not significantly correlate [7]. In addition, Wander et al. found a link between visceral fat and glucose intolerance [8]. Previous studies by Lee et al. and Sandeep et al. have shown a stronger relationship between visceral adipose tissue and metabolic syndrome (MS) [9,10].
Adipose tissue can be directly measured using magnetic resonance imaging (MRI), computed tomography (CT), and other imaging techniques – they are reference methods for evaluating abdominal adiposity. The correlations between the actual adipose tissue volume and other anthropometric indices have been studied using CT and MRI [11]. MRI-derived adipose tissue area is reported to be an accurate predictor of MS, with a stronger association with metabolic syndrome than the association of BMI with MS [12]. However, MRI is more expensive and time-consuming than CT. Because of its simplicity and accompanying low radiation dose, particular single axial CT images have been employed in various investigations to evaluate abdominal obesity [13]. The visceral fat area (VFA) measured using single axial CT is the basis for the diagnostic standards for abdominal obesity as described in previously mentioned studies [11-15]. However, singleslice imaging may not be as accurate as total volume imaging in detecting longitudinal changes in abdominal adiposity. Some validation studies have shown that measuring VFV using CT is feasible and highly accurate [11]. Studies on the links between actual fat volume and metabolic disorders are nevertheless scarce.
As a result, the goal of this study was to assess the relationship between visceral fat volume (VFV), subcutaneous fat volume (SVF), and total abdominal fat volume assessed using CT/contrast-enhanced CT (CECT) of the abdomen and pelvis, which is less expensive and takes less time to acquire images than MRI.
Material and methods
This cross-sectional study was conducted over a duration of 18 months (July 2021 – December 2022) at our institute (a tertiary care centre), and estimation of visceral fat, subcutaneous fat, and total fat volume using multi-slice CT (MSCT)/CECT scans of the abdomen and pelvis were performed. A total of 112 patients were included in the study, who were referred for CT abdomen for evaluation of abdominal pathologies. Patients were categorized as Group A and Group B as per the inclusion and exclusion criteria detailed below.
Inclusion criteria
All patients aged between 25 to 85 years with hyperinsulinaemia (the upper fourth of the fasting insulin level among nondiabetic subjects) or hyperglycaemia (fasting glucose ≥ 110 mg/dl) in addition to at least 2 of the following: waist girth ≥ 94 cm, dyslipidaemia (triglycerides ≥ 150 mg/dl or HDL cholesterol < 40 mg/dl), or BP ≥ 140/90 mmHg or taking anti-hypertensives [22] were included as cases and designated as Group A (i.e. those with metabolic syndrome).
Exclusion criteria
Patients without diabetes, hypertension, or dyslipidaemia (taken as individual parameters or a combination of 2) were considered as controls. These patients were categorized as Group B (i.e. those without metabolic syndrome). Patients with ascites or other causes of abdominal distention (e.g. tumours) and fat stranding (e.g. pancreatitis) were excluded from the study.
Methodology
These groups of patients were then subjected to CT scan/CECT, based on the requirements of the clinically suspected pathology, using a 128-slice MDCT scanner (Ingenuity Core 128 v3.5.7.25001; Philips Healthcare).
The studies were analysed by 2 radiologists, both experienced in abdominal imaging (3 and 10 years, respectively). Both radiologists were instructed to agree on a common segmentation technique to optimize results. Inter-rater correlation analysis was performed for a sample group, and there was no significant difference. In the pre-contrast CT scan, fat was identified as the pixels ranging from −250 to −50 Hounsfield units. The subcutaneous fat was described as the extraperitoneal fat between the muscles and the skin (Figure 1A). Visceral fat was defined as the intraperitoneal portion that had the same density as subcutaneous fat (Figure 1B). Total fat was the volume of fat combining the visceral and subcutaneous fat. A region growing segmentation algorithm was adopted. When an ROI was placed with the cursor over a certain grey-scale, the post processing software in the 128 slice MDCT scanner (Ingenuity Core 128 v3.5.7.25001; Philips Healthcare) was pre-programmed such that it selected all pixels in the grey level similar to the one selected. The software then provided the volume of the selected region – separate for the visceral and subcutaneous fat. The same is depicted in Figure 1.
Figure 1
Non-contrast abdominal computed tomography axial section at the level of L2-L3 intervertebral disc defining subcutaneous (A) and visceral fat (B) – blue coloured area
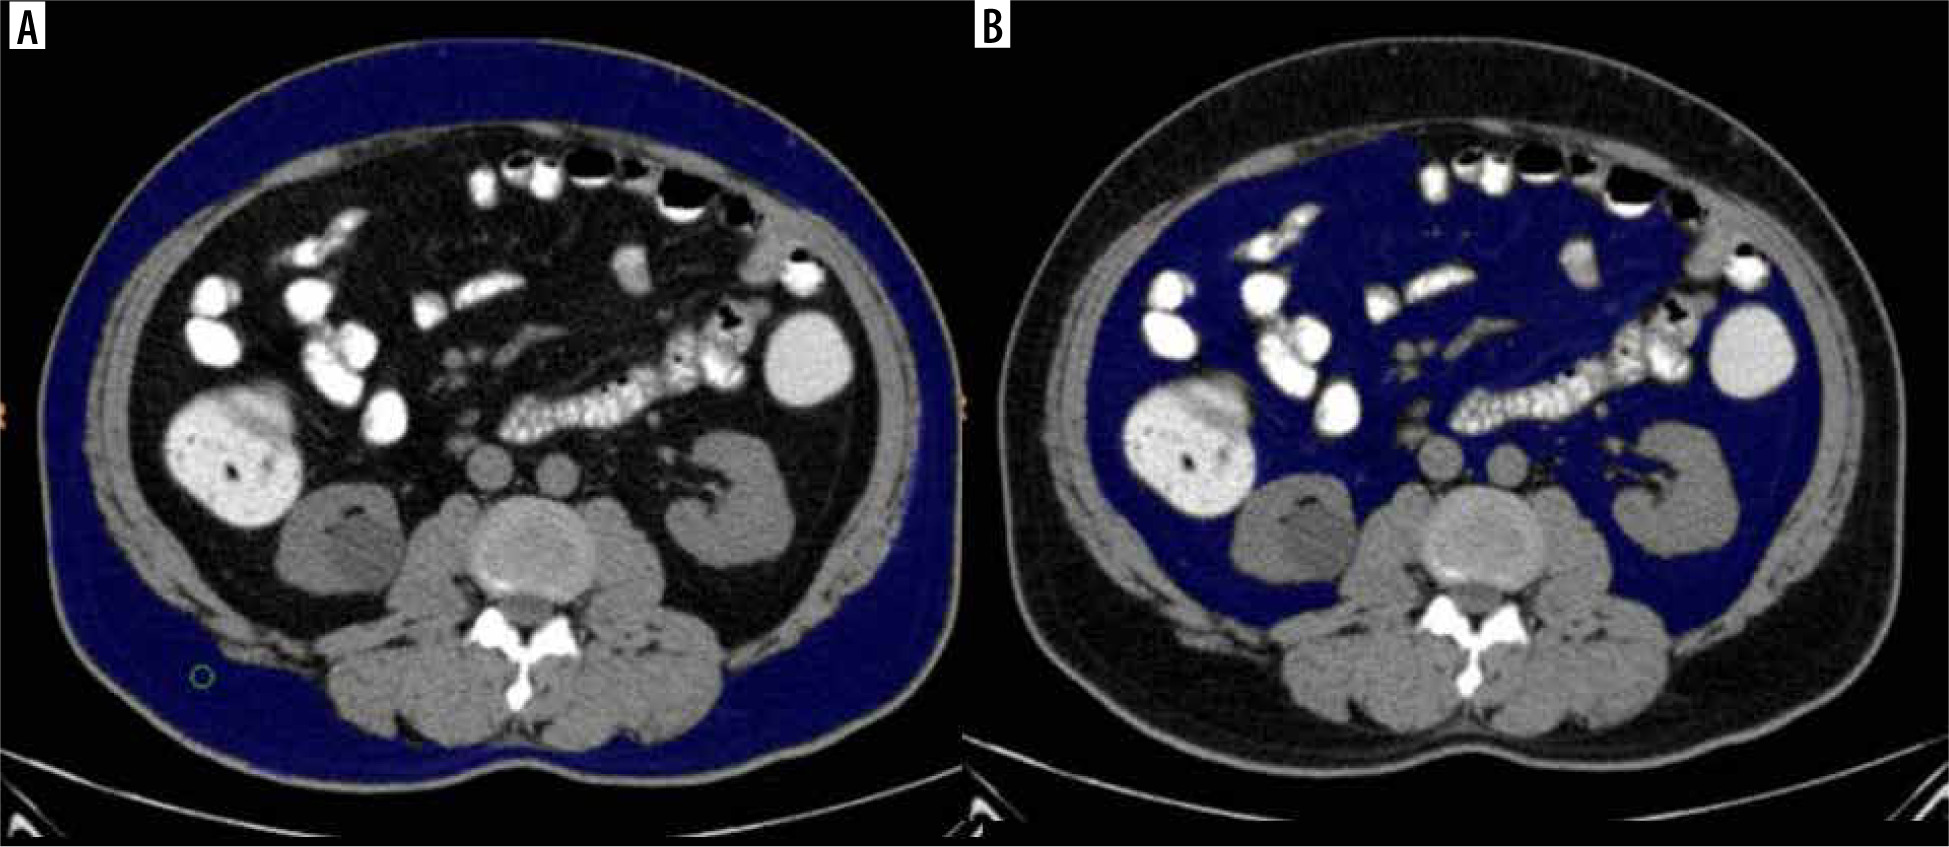
Calculation of the subcutaneous fat volume (SFV), total fat volume, and visceral fat volume (VFV) was done at the L2-L3 intervertebral disc level. These parameters were further correlated with the presence of metabolic syndrome based on the clinical criteria.
Sample size calculation
The sample size estimated based on the effect size of the volume between the group as 0.57, a error as 5%, and power as 80% was 51 in each group. Because the volume difference was never studied, we considered the effect size of the area difference as the proxy for the volume also. The effect size for the area difference between metabolic syndrome and non-metabolic syndrome was calculated by considering the standard deviation of VFA in those with metabolic syndrome and those without metabolic syndrome as 63.4 and 42.1, respectively, and measuring mean differences of at least 30 cm2 of VFA between them.
Statistical analysis
Data were entered into Microsoft Excel, and statistical analysis was done using IBM SPSS (Statistical package for social sciences) Statistics V20.0 (IBM corp., released 2011). Statistical analysis was performed using the independent sample t-test and Pearson’s correlation test.
This study was approved by the Institutional Ethics Committee (reference number JSS/MC/PG5156/2020-21 dated 22.01.2021).
Results
In the present study, a total of 112 study subjects satisfying the inclusion criteria were enrolled at our institute and referred for CT/CECT of the abdomen and pelvis. We evaluated the role of visceral fat volume (VFV), subcutaneous fat volume (SVF), and total abdominal fat volume quantified using CT/CECT of the abdomen and pelvis in correlation with metabolic syndrome.
The mean age of Group A was higher (60.91 ± 12.23 years) than that of Group B (50.12 ± 16.30 years). An independent sample t-test was applied to compare the mean difference between the groups, which showed a statistically significant difference between the groups (p = 0.001).
An overall male predominance was observed in the collected sample (n = 69; 61.6%) as compared to females (n = 43; 38.4%). The χ2 test was applied to find the association with gender, and no statistically significant correlation was obtained between gender and the χ 2 test results (χ 2 = 2.01, p = 0.155).
Mean height was slightly higher in Group B (1.66 ± 0.09 m), whereas mean weight and BMI were higher in Group A (71.83 ± 10.43 kg and 26.81 ± 3.87 kg/m2, respectively). However, no statistically significant difference was found between the groups according to an independent sample t-test (p ≥ 0.05) (Table 1).
Table 1
Comparison of the mean parameters between the groups using independent sample t-test
| Groups | n | Mean | SD | p-value | |
|---|---|---|---|---|---|
| Height (m) | A | 53 | 1.65 | 0.081 | 0.69 |
| B | 59 | 1.66 | 0.089 | ||
| Weight (kg) | A | 53 | 71.83 | 10.43 | 0.55 |
| B | 59 | 70.59 | 11.48 | ||
| BMI (kg/m2) | A | 53 | 27.28 | 3.52 | 0.506 |
| B | 59 | 26.81 | 3.87 |
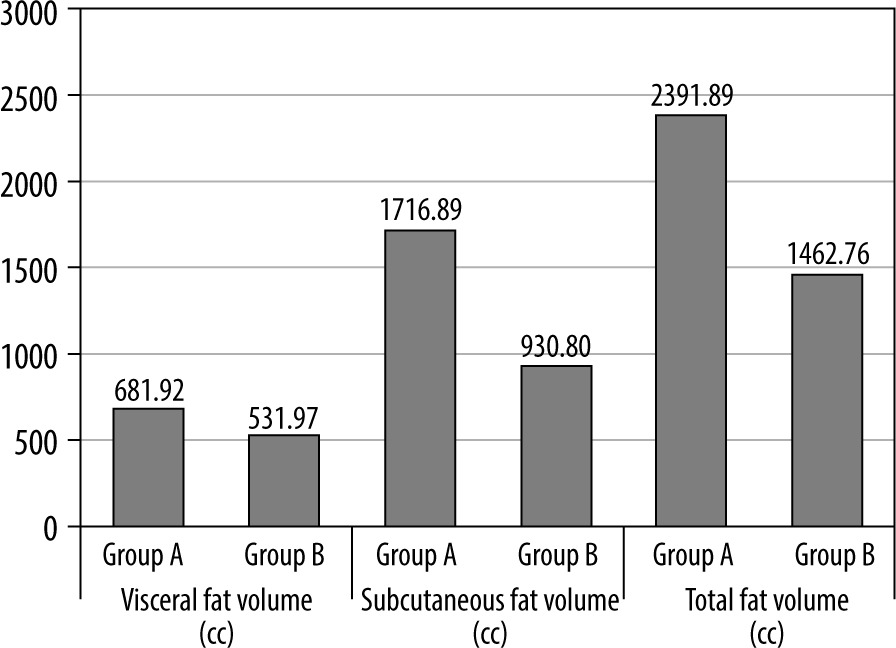
VFV, SFV, and total fat volume (TFV) were found to be higher in Group A (681.92 ± 92.58 cc, 1716 ± 85.01 cc, and 2391.89 ± 290.23 cc, respectively). An independent sample t-test was applied to compare the mean difference in visceral fat volume, subcutaneous fat volume, and total fat volume between the groups. Independent sample t-test showed a statistically significant difference between the groups (p =0.001) (Table 2 and Figure 2).
Table 2
Comparison of the mean parameters between the groups using independent sample t-test
Figure 2
Graph demonstrating comparison of the mean parameters between the groups using independent sample t-test
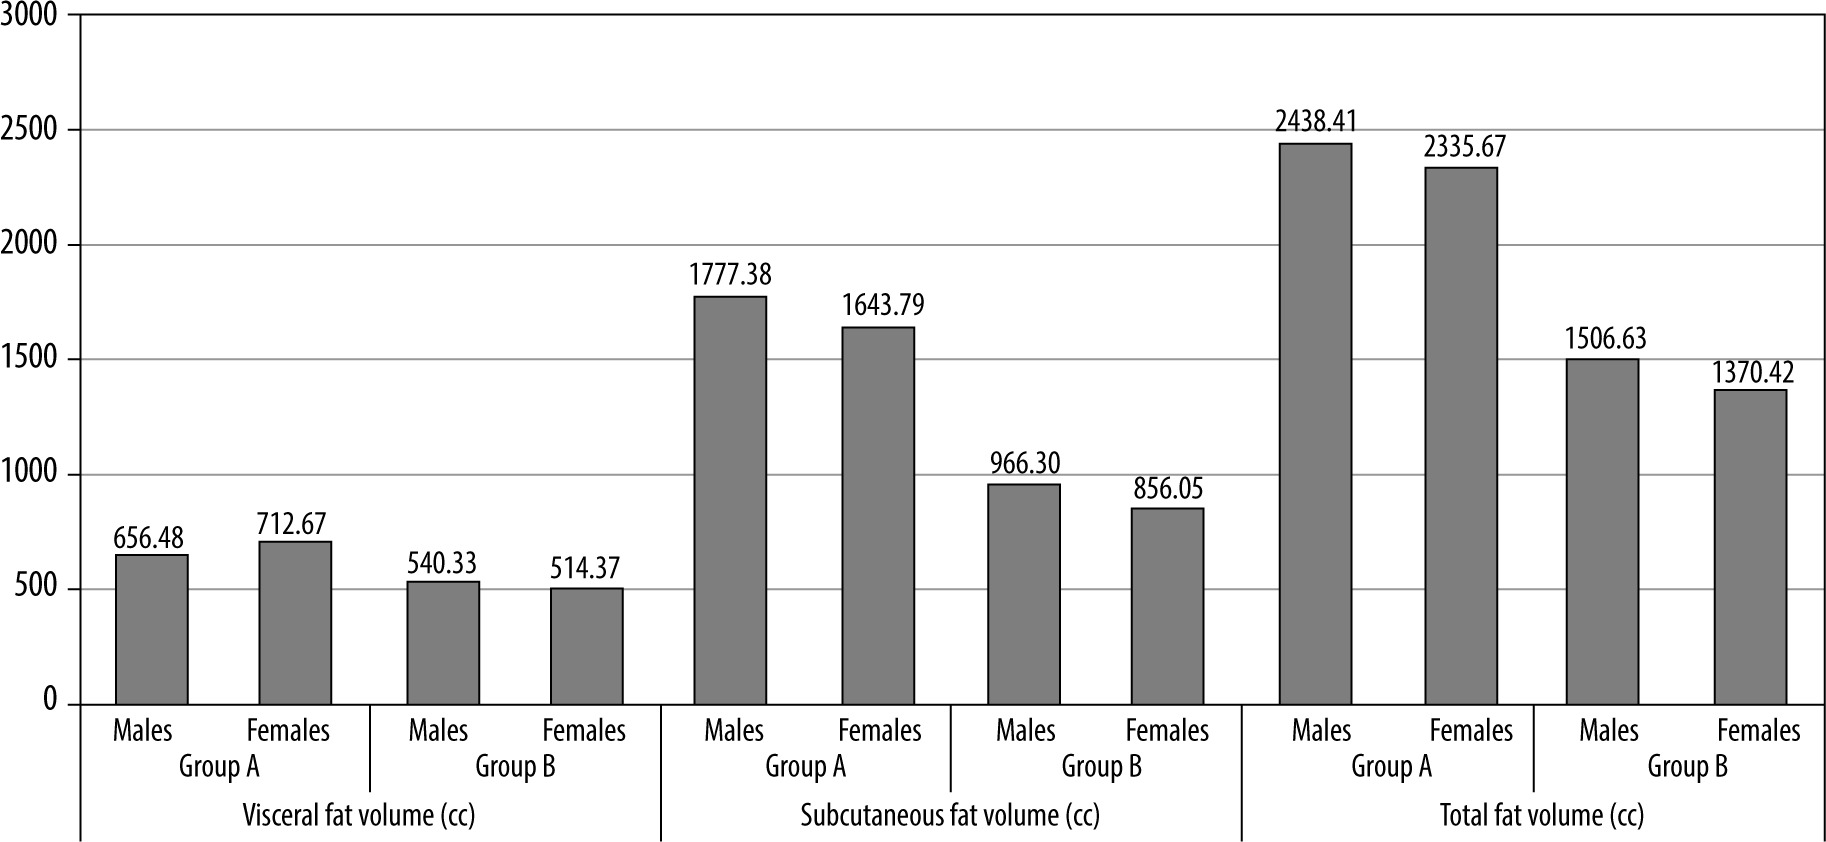
In Group A, females had a higher visceral fat volume (712.67 ± 76.6 cc), whereas in Group B, males had a higher visceral fat volume (540.33 ± 106.45 cc). Subcutaneous fat volume was higher in males in both groups, i.e. 1777.38 ± 303.09 cc in Group A and 966.30 ± 232.82 cc in Group B. Total volume was higher in males in both the groups: 2438.41 ± 315.31 cc in Group A and 1506.63 ± 322.32 cc in Group B. An independent sample t-test was applied to compare the mean difference in visceral fat volume, subcutaneous fat volume, and total volume within the groups between genders. Independent sample t-test showed a statistically significant difference between the genders in Group A (p = 0.026) with respect to visceral fat volume (Table 3 and Figure 3).
Table 3
Comparison of the mean parameters within the groups between gender using independent sample t-test
Figure 3
Graph demonstrating comparison of the mean parameters within the groups between gender using independent sample t-test
The total fat volume, subcutaneous fat volume, and visceral fat volume were all greater in Group A in both males and females. The mean difference in visceral fat volume, subcutaneous fat volume, as well as total volume within the gender across the groups were compared using an independent sample t-test. Males and females in both groups saw a statistically significant difference, according to an independent sample t-test (p = 0.001) (Table 4 and Figure 4). Table 5 shows the correlations between BMI and VFV, and between SFV and TFV based on Pearson’s correlation analysis. There was no correlation between BMI and either VFV, SFV, or TFV.
Table 4
Mean parameters based on gender between the groups using independent sample t-test
Table 5
Pearson’s correlation between BMI and visceral fat volume, subcutaneous fat volume, and total fat volume
| Groups | BMI vs. | |||
|---|---|---|---|---|
| Visceral fat volume | Subcutaneous fat volume | Total fat volume | ||
| A | r-value | 0.198 | 0.149 | 0.176 |
| p-value | 0.156 | 0.287 | 0.207 | |
| B | r-value | 0.129 | -0.014 | 0.035 |
| p-value | 0.332 | 0.918 | 0.795 | |
Figure 4
Graph demonstrating comparison of the mean parameters based on gender between the groups using independent sample t-test
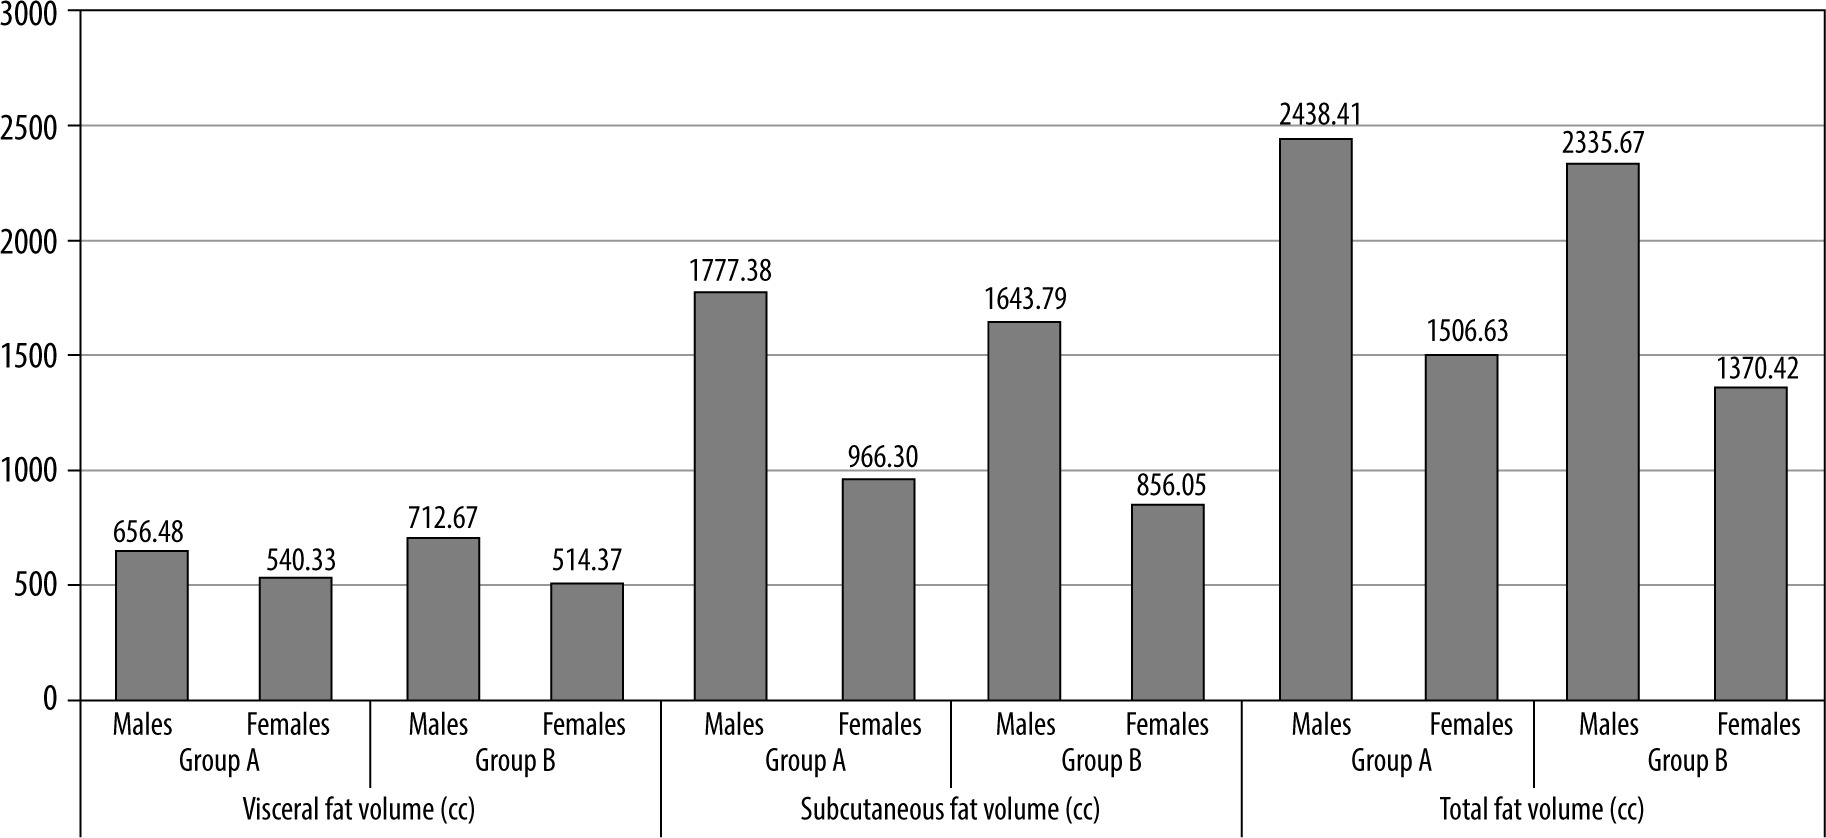
Figure 5
A 55-year-old old male patient with hypertension and diabetes with waist circumference of 95 cm and BMI of 31. Axial sections of abdominal CT showing (A) subcutaneous and visceral fat distribution, (B) subcutaneous fat volume (blue coloured area), and (C) visceral fat volume (blue coloured area). In this case: VFV 930 cc, SFV 1835 cc, and TFV 2765 cc
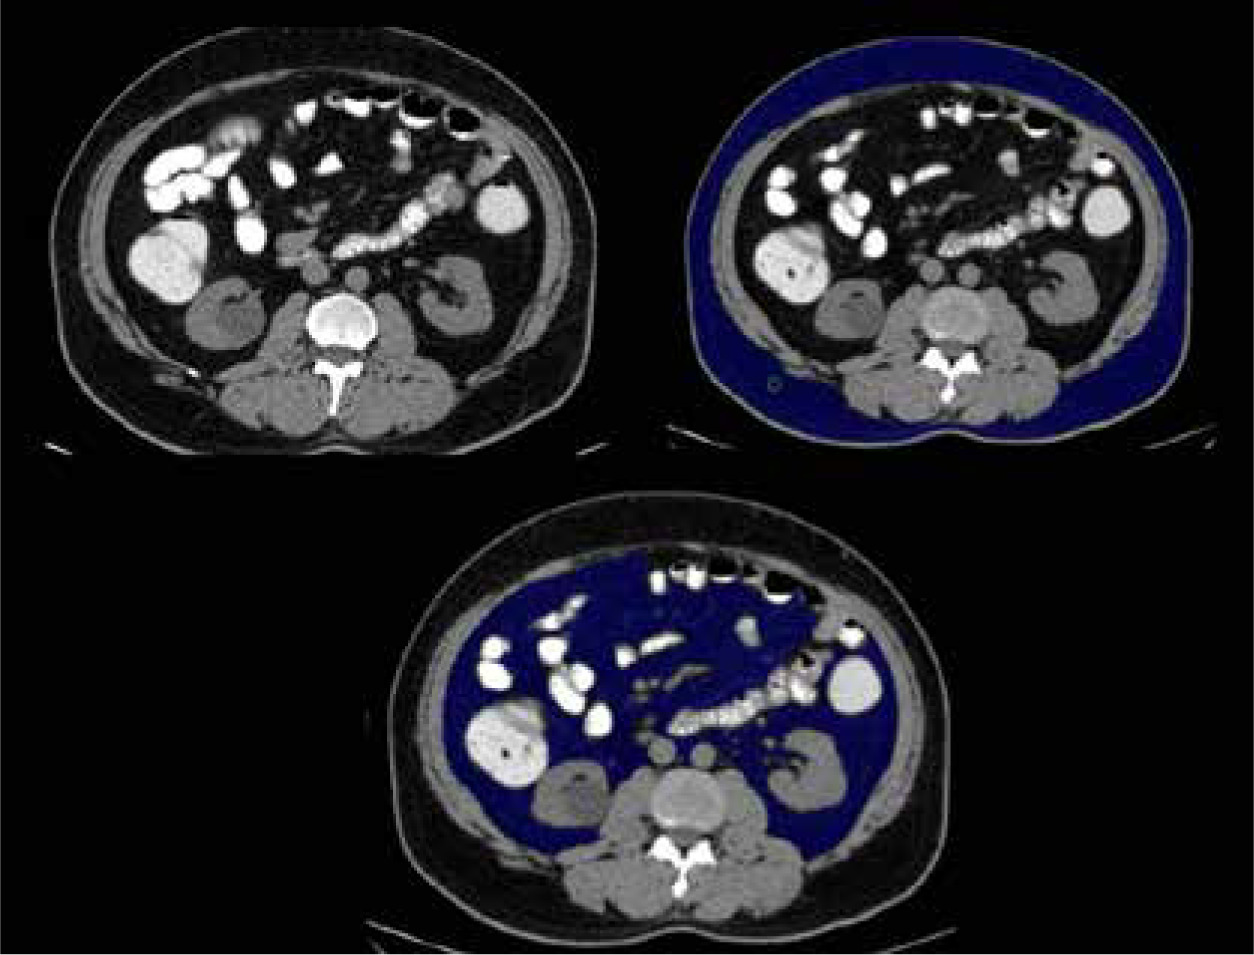
Figure 6
A 54-year-old female patient with hypertension and dyslipidaemia with waist circumference of 95 cm and a normal BMI of 23. Axial sections of abdominal CT showing (A) subcutaneous and visceral fat distribution, (B) subcutaneous fat volume (blue coloured area), and (C) visceral fat volume (blue coloured area). In this case: VFV 731 cc, SFV 1755 cc, and TFV 2486 cc
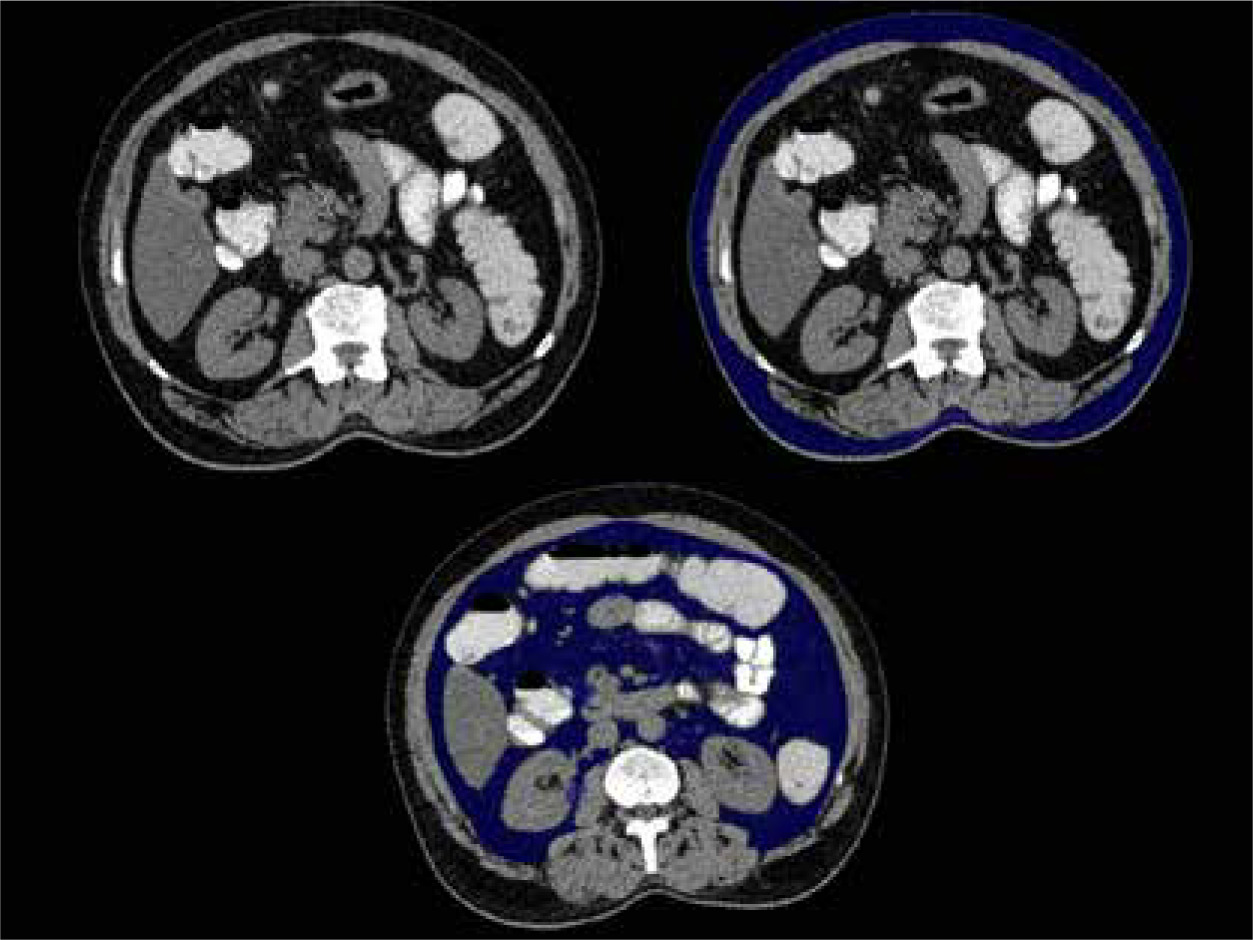
Figure 7
A 47-year-old male patient without hypertension/diabetes/dyslipidaemia with waist circumference of 86 cm and normal BMI of 20. Axial sections of abdominal CT showing (A) subcutaneous and visceral fat distribution, (B) subcutaneous fat volume (blue coloured area), and (C) visceral fat volume (blue coloured area). In this case: VFV 550 cc, SFV 1220 cc, and TFV 1770 cc
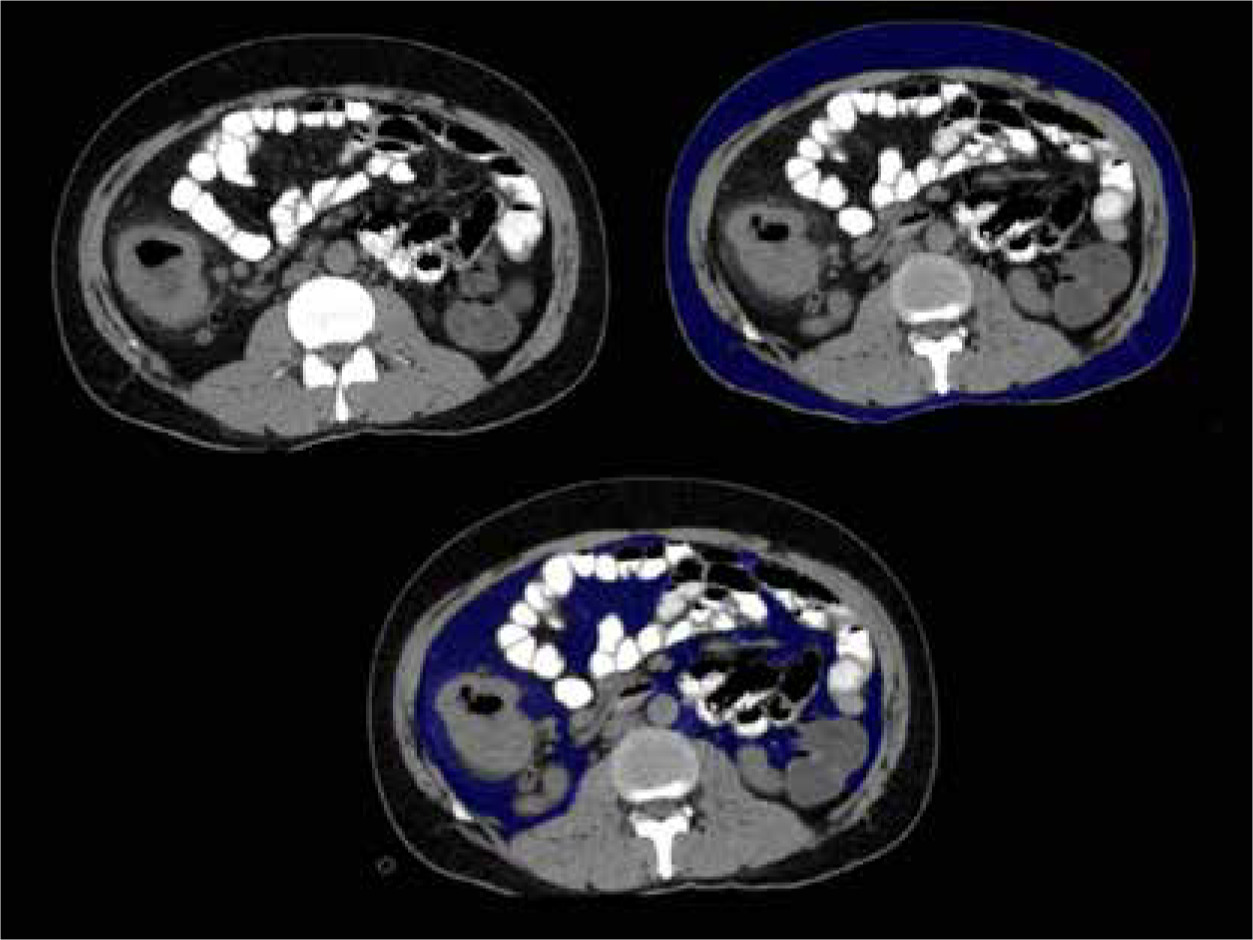
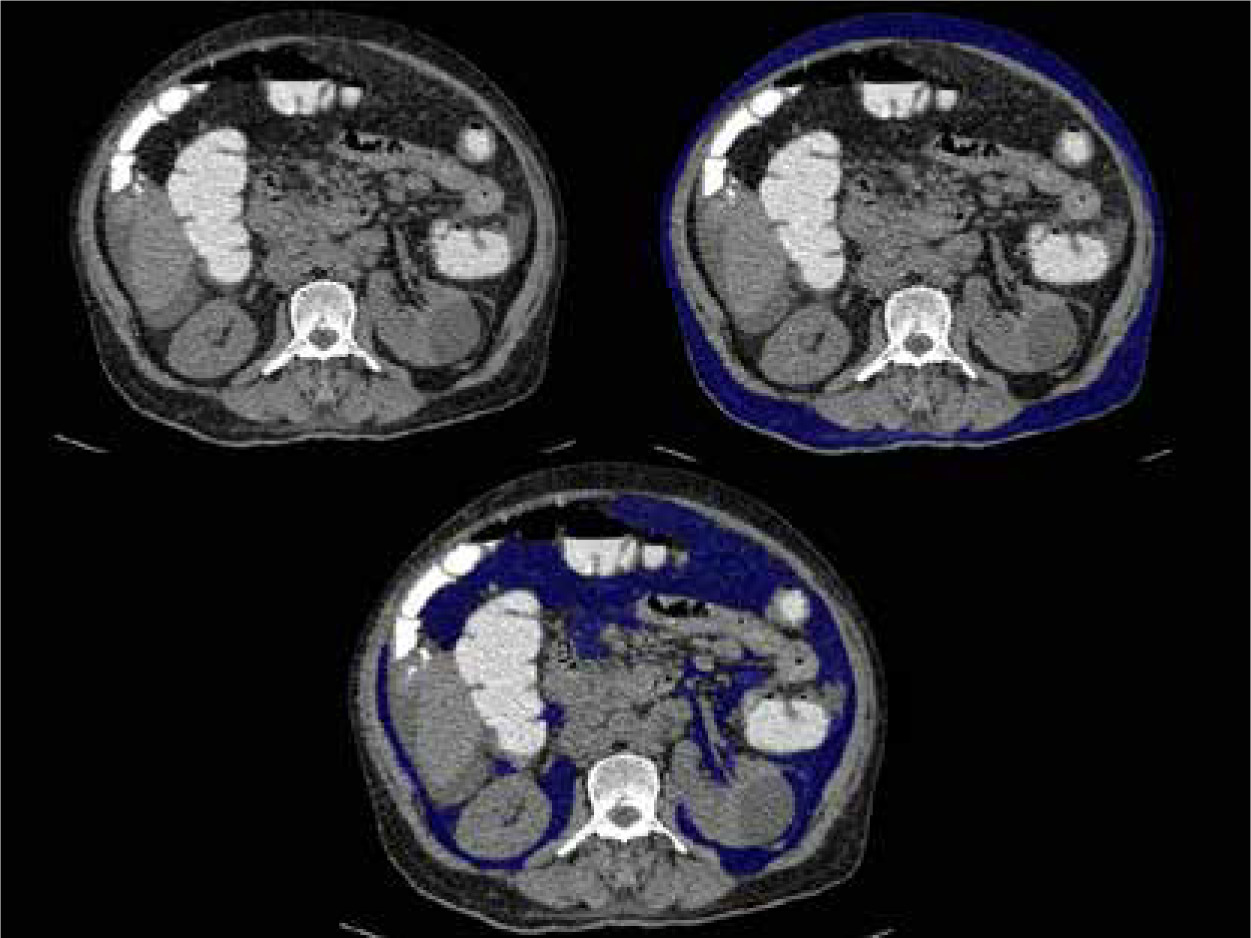
Figure 8
A 35-year-old female patient with hypertension and diabetes with waist circumference of 96 cm and increased BMI of 32. Axial sections of abdominal CT showing (A) subcutaneous and visceral fat distribution, (B) subcutaneous fat volume (blue coloured area), and (C) visceral fat volume (blue coloured area). In this case: VFV 595 cc, SFV 711 cc, and TFV 1305 cc
Discussion
According to the National Cholesterol Education Program Adult Treatment Panel (NCEP ATP) III definition, metabolic syndrome is present if 3 or more of the following 5 criteria are met: waist circumference over 40 inches (101.6 cm) in men or 35 inches (88.9 cm) in women, blood pressure over 130/85 mmHg, fasting triglyceride level over 150 mg/dl, fasting high-density lipoprotein cholesterol level less than 40 mg/dl (men) or 50 mg/dl (women), and fasting blood sugar over 100 mg/dl [16]. When excessive visceral fat has accumulated around the abdomen to a point that it is likely to have a detrimental effect on health, the disease is referred to as abdominal obesity. Cardiovascular disease, Alzheimer’s disease, as well as other metabolic and vascular disorders, have all been closely associated with abdominal obesity. Waist circumference, visceral and central abdominal fat, and type 2 diabetes are strongly correlated. Unlike subcutaneous fat, which is found beneath the skin, and intramuscular fat, which is found interspersed in skeletal muscle, visceral fat, often referred to as organ fat or intra-abdominal fat, is found inside the peritoneal cavity, packed in between internal organs and the torso. Mesenteric, epididymal white adipose tissue, retroperitoneal, and perirenal fat are some of the adipose depots that make up visceral fat. Previous studies suggested that this compound has a protective effect on glucose metabolism [17,18]. Contrarily, other data suggest a link between subcutaneous fat deposition and harmful cardiometabolic risk factors, such as diabetes [19,20].
In the abdominal cavity, there are distinctions between visceral adipose tissue (VAT) and subcutaneous adipose tissue (SCAT), including morphological, cellular, molecular, physiological, clinical, as well as prognostic differences [21]. Anatomically, VAT is mostly found in the mesentery and omentum. In comparison to SCAT, VAT is more cellular, vascular, and innervated, contains more immunological and inflammatory cells, has a lower potential to differentiate into preadipocytes, and contains a higher proportion of large adipocytes [21]. In the present cross-sectional study, a total of 112 study subjects were divided into 2 groups: metabolic syndrome patients – Cases (n = 53), and non-metabolic syndrome patients – Control (n = 59). They were evaluated for the quantification of visceral, subcutaneous and total abdominopelvic fat volume on CT, and its correlation with metabolic syndrome.
Waist circumference or BMI, commonly used as indicators for predicting metabolic risk, are powerful and convenient tools to use, but they vary widely according to the individual’s body frame size and provide little or no information regarding the relative distribution of body fat, especially visceral adiposity [22,23]. Obviously, there were some limitations in using waist circumference and BMI as a representative index to predict cardiovascular and metabolic risks. Using waist circumference as an index for the diagnosis of metabolic syndrome might be problematic, particularly in patients with normal waist circumference and BMI with metabolic risk factors. For these reasons, visceral fat area (VFA) may be a substitute for measuring the body’s visceral adipose tissue accurately [24].
In our study, visceral fat volume, subcutaneous fat volume, and total fat volume were found to be higher in metabolic syndrome patients, i.e. 681.92 ± 92.59 cm3, 1716.20 ± 285.00 cm3, and 2391.89 ± 290.23 cm3, respectively. Similarly, the visceral fat volume in the study by Jongjirasiri et al. [25], in which the abdominal fat volumes were calculated between the uppermost part of the liver and the lowermost part of the pelvis or the level of the femoral head, was 6495 ± 2069 cm3 for men and 4964 ± 1255 cm3 for women, which was significant. The mean subcutaneous volume was 9177 ± 2434 cm3 in males and 8631 ± 1656 cm3 in females, which was statistically significant.
The increase of visceral fat is frequently cited as a risk factor for cardiovascular conditions, including diabetes mellitus. Accumulation of visceral fat, which is closely associated with insulin resistance, is one of the main characteristics of metabolic syndrome. In an abdominal CT scan at the umbilical level, visceral fat accumulation is often identified as a waist circumference ≥ 85 cm in males and ≥ 90 cm in women, which corresponds to a VFA of 100 cm2 [26]. Men were found to have levels of 118.8 cm2 and women had values of 82.6 cm2, according to a longitudinal study that evaluated the best cut-off value of VFA for predicting type 2 diabetes in 13,004 Koreans [27]. Another 10-year, longitudinal study found that incident diabetes patients with metabolic syndrome had a baseline intra-abdominal fat area (IFA) of 102.7 cm2 while those without incident diabetes had a baseline IFA of 74.3 cm2. Additionally, after controlling for the identified components, a 1 SD increase in IFA was linked to a 1.65-fold increase in the risks of developing diabetes over a 10-year period [28].
In the present study, the measured VFV, SFV, and TFV showed a significant difference between both genders and between metabolic syndrome patients and non-metabolic syndrome patients. The primary finding of this study was the significant correlation between VFV in both genders and between groups, which was both robust and positive. The possibility of significant gender interactions between VFV, SFV, and metabolic syndrome was found in prior studies [29-31]. In our study significant correlation between the VFV and metabolic syndrome was found in female patients. The cause of gender differences is uncertain; nonetheless, it can be related to the high amount of hepatic free fatty acid delivery resulting from lipolysis from VFV that has been observed in women more than in men [32].
It is commonly recognized that central obesity and diabetes are related. In the present study, we did not find any correlation between BMI and VFV, SFV, or TFV. An increase of 1 SD in the intraabdominal fat region raised the risk of type 2 diabetes up to 1.65-fold in a 10-year longitudinal study on the development of the disease; however, changes in body weight were not related to type 2 diabetes risk (odds ratio, 0.95; 95% CI: 0.66-1.35) [28]. Another longitudinal cohort study found that the risk of developing diabetes rose 1.48-fold for every 1 SD rise in visceral fat in the L2 to L3 region (measured using CT); an incease in subcutaneous fat did not, however, raise the incidence of diabetes in either sex; these connections only existed among males.
In the VACATION-J study [33-36] and the Amagasaki Visceral Fat study [37,38] Ryo et al. [37] showed that a reduction in accumulated visceral fat (measured by CT) attained within a year correlates with a reduction in the number of metabolic risk factors (hypertension, dyslipidaemia, and hyperglycaemia) [33,39] and an increase in serum adiponectin levels [40]. When risk factor-focused “Hokenshido” program was performed for a 4-year follow-up of cardiovascular events in 3228 employees (men 2486, women 742), the cumulative incidence of cardiovascular events in those subjects who showed visceral fat reduction was significantly lower (20.7 ± 16.1 cm2) than in those who showed an increase in visceral fat (12.7 ± 14.6 cm2) (p = 0.0049) [41].
We discovered an association between mean VFV, SFV, and TFV with respect to hypertension, diabetes, and dyslipidaemia, which was greater in patients with metabolic syndrome than in the control group. When predicting several metabolic risk variables in individuals with metabolic syndrome, the diagnostic value of VFV was higher in women than in men; likewise, the diagnostic value of SFV as well as total abdominopelvic fat volume was higher in men in both groups. The mechanism behind this sex-specific result is unclear. Further studies are required to elucidate the causality of this finding. So far, to our knowledge, no other studies have shown VFV, SFV, and total abdominopelvic volume to be valuable indicators in predicting metabolic risk components in both sexes regardless of age and BMI.
Limitations
For the rising incidence of metabolic syndrome, the sample size is inadequate for extrapolation to the general population. Secondly, selection bias in cases and controls was observed in our study because patients were randomly selected while undergoing abdominal CT imaging for other clinical indications. Thirdly, the volume of various types of fat was calculated and represented from a section of the abdomen and not from the entire volume of fat.
Conclusions
Usage of abdominal CT, a routinely performed imaging modality, as a tool for the risk assessment of development of metabolic syndrome is unexplored. Because BMI is not accurate for calculating the risk of metabolic syndrome, visceral, subcutaneous, and total fat volume calculation using CT is a better parameter to assess the same. The radiologist can thus work in conjunction with the clinician for early and efficient detection and treatment of this health condition.