


Introduction
Virtual endoscopy is a postprocessing method using three-dimensional multi-detector computed tomography (MDCT), which produces views of the inner surfaces of the human body like those produced by fibreoptic endoscopy [1].
It has been estimated that 80-90% of patients with cirrhotic liver disease (CLD) have oesophageal varices. The development of variceal bleeding occurs at a rate of 10-30% each year [2]. Variceal bleeding can be a major cause of cirrhosis-related morbidity and mortality [3].
Cirrhosis and its consequences have been steadily growing as causes of death. Eastern countries are undergoing a cultural-lifestyle change, with the adoption of western cuisine, sedentary habits, and alcohol intake providing the foundation for a spectrum of liver illnesses [3,4]. Over and above viral causal reasons, this trend includes an increase in total cases of alcoholic liver disease (ALD) and non-alcoholic fatty liver disease (NAFLD), including biochemical, clinical, and ultrasonic parameters, elasto-graphy, and video capsule endoscopy, although all have limited sensitivity [5].
To evaluate and categorise patients who require medical or endoscopic band ligation to prevent oesophageal variceal bleed, a less invasive, less expensive, better tolerated, and more sensitive modality is required, as well as to reduce the use of invasive procedures in the follow-up of patients who do not require endoscopic variceal band ligation [6-8]. Diagnostic possibilities have improved with developments in MDCT and 3D imaging techniques, and it is now possible to see intra-oesophageal varices as well as other CLD-related characteristics and consequences [9,10]. Our goal was to see how effective MDCT virtual oesophagography is at detecting oesophageal varices and grading low- and high-risk varices in patients with chronic CLD. Other non-invasive methods of variceal detection exist. Baveno VI guidelines suggest that patients with liver stiffness < 20 kPa and platelets more than 150,000/μl do not require endoscopy. In such patients, spleen elastography appears to be a promising non-invasive method of detection [11].
There was statistically significant agreement between the methods in grading of oesophageal varices (weighted k = 0.913, p ≤ 0.001). CT virtual oesophagography can be an alternative noninvasive procedures to grade oesophageal varices.
Material and methods
After the approval of the Institutional Ethical Committee, this prospective cross-sectional study was conducted in the Department of Radiodiagnosis in association with the Department of Gastroenterology. The study was conducted over a period of 18 months from July 2020 to January 2022. The sample size was calculated to be 62 patients. Patients were recruited on basis of inclusion and exclusion criteria after obtaining informed consent.
Inclusion criteria
The inclusion criteria were: 1) chronic CLD patients planned/referred for CT scan of the abdomen and chest in the radiology department; 2) patients who had undergone optical endoscopy with documented oesophageal varices and were referred for CT scan for evaluation of other complications of CLD.
Exclusion criteria
The exclusion criteria were: 1) patients who did not give written informed consent; 2) age < 18 years; 3) pregnant females; 4) patients with active gastrointestinal haemorrhage; 5) history of endoscopic/any other invasive mana-gement of varices; 6) patients with history of adverse reactions to iodinated contrast agents; 7) patients with any kind of nasogastric tube in situ; 8) patients with deranged kidney function test.
All patients enrolled in our study were informed about the methodology of the study. Written informed consent was obtained from all patients. Prior to scan, patients underwent preparation and counselling about the procedure. Patients were put in a supine position with their arms above their head. A scout image was obtained from 2 cm above the apex of the lung up to the pubic symphysis.
All patients underwent CT scan (128-slice Somatom Definition Flash, Siemens Healthcare, Forchheim, Germany) before and after the injection of non-ionic contrast medium. After completion of the non-enhanced scans, an intravenous (IV) bolus injection of non-ionic iodinated contrast material was administered at a dose of 1.5-2 mg/kg with a maximum of 150 ml as a total dose at a rate of 4 ml/s through a 20-gauge IV catheter inserted into an antecubital vein using an automatic injector (IMAXEON SALIENT). The scanning delay was determined for each patient as per the protocol described below using bolus tracking software after achieving enhancement of the descending aorta up to 100 HU.
The protocol for the chest and whole abdomen included a non-contrast scan followed by arterial phase imaging of the upper abdomen, portovenous phase imaging of the upper abdomen, and the third acquisition in the venous phase including the chest and whole abdomen. Arterial, portal, and venous phases were acquired with an automatic time delay of 20, 35, and 55 seconds post-contrast injection, respectively.
The protocol for oesophageal distention included 10 mg of butyl scopolamine (Buscopan) administered intravenously to facilitate oesophageal hypotonia around 10 min before acquisition. After a non-contrast scan the patient was given two 5 g packets of effervescent powder with a small amount of water just before the start of contrast CT acquisition, to obtain oesophageal distension to avoid the oesophageal walls apposing each other and a collapsed oesophageal wall mimicking an abnormal thickening. The patients were asked not to belch during or after administration. Oesophageal distension was achieved in the post-contrast scan itself as part of the routine examination protocol. No separate CT acquisition was performed for variceal evaluation.
After completion of the study, a high-resolution dataset with a 0.7-mm reconstruction interval was transferred to a reporting workstation (Syngo Via Advanced Multi-modality workstation, Siemens, Germany) equipped with dedicated 2D and 3D software (CT colon, VB 30 version) tools, which allow processing of multiplanar reconstructions (MPRs) and volume renderings (VRs) by using surface-shaded transparent and virtual endoscopy modes. CT examination was reviewed by a fellowship-trained abdominal radiologist with 6 years of experience.
Previous study showed that the thickness of normal or unaffected oesophageal wall approximate to 3 mm indicated good oesophageal distension. Because the distended phase was acquired after intravenous contrast administration, the variceal vein would be differentiated from normal mucosal folds, owing to venous enhancement. Effervescent tablets will produce gaseous distension, just enough to distend the oesophagus. Carbon dioxide insufflation used in endoscopy has the same mechanism of distension. Avoiding forced distension will prevent varices from collapsing. Normal mucosal folds in the oesophagus are due to contraction or normal tone of muscularis. Folds can be present along the entire length of the oesophagus, while portal hyper-tension varices are more common in the lower oeso-phagus [12]. Another difference between folds and varices is the presence of discrete enhancement in the venous phase. In a previous study by Kim et al., a diameter of 3 mm was considered as an appropriate threshold [13].
The dynamic endoscopic examination of the oesophagus was performed by a gastroenterologist with 5 years of experience. The endoscopy procedure and the findings were recorded by the same investigator.
Endoscopy examinations were done as per recommendations in Baveno VI group. Surveillance endoscopy is done 2-yearly and annually in patients with ongoing persisting liver insult, who have no varices or small varices, respectively. After the liver insult factor is removed, surveillance endoscopy should be done 3-yearly in patients with no varices and 2-yearly in patients with small varices. All patients with suspected cirrhosis undergo screening gastroscopy, as well [14].
Both the investigators, the radiologist, and the gastroenterologist performing the endoscopy were blinded to each other’s findings. Both the examinations were done with interval of 1 to 2 days.
We determined the grade of EVs at MDCT and upper gastrointestinal (GI) endoscopy using the classification system according to the criteria proposed by the Japanese Society for Portal Hypertension [15].
The absence or presence of EVs as well as the size, shape, course, and occupancy were parameters used in the grading. The grading system was as follows: grade 0 – no EV detected; grade 1 – a small EV that runs straight; grade 2 – a moderate-sized EV that had a beaded or tortuous appearance and occupied less than one-third of the oeso-phageal lumen; and grade 3 – a large EV that had a coiled or tumour-like appearance and occupied more than one-third of the oesophageal lumen [15].
Results
The green cells on the diagonal represent cases where both the methods were in agreement (Table 1). The red shaded cells represent cases where the 2 methods disagreed. The 2 methods agreed in 87.1% of the cases and disagreed in 12.9% of the cases. There was substantial agreement between the 2 methods, and this agreement was statistically significant (Cohen’s k = 0.616, p ≤ 0.001).
Table 1
Comparison of oesophageal varices using computed tomography (CT) virtual oesophagography with oesophageal varices using upper gastrointestinal (GI) endoscopy (n = 62)
The diagnostic performance of CT virtual oesophagography in predicting oesophageal varices in the present study were as follows: sensitivity: 86%, specificity: 90%, PPV: 98%, NPV: 56%, and diagnostic accuracy: 87%.
The green cells on the diagonal represent cases in which both the methods agreed. The red shaded cells represent cases in which the 2 methods disagreed (Table 2).
Table 2
Comparison of grade of oesophageal varices with computed tomography (CT) virtual oesophagography and upper gastrointestinal (GI) endoscopy (n = 62)
Table 3
Presence of perigastric varices/paraesophageal varices/collaterals, splenomegaly/ascites, and liver space occupying lesions (SOL) in different grades of oesophageal varices
The 2 methods agreed in 77.4% of the cases and disagreed in 22.6% of the cases. There was statistically significant agreement between the 2 methods (weighted k = 0.913, π ≤ 0.001).
The disagreements observed between the 2 methods were as follows:
1 (1.6%) case classified as absent by upper GI endoscopy was classified as grade I by CT virtual oesophagography;
7 (11.3%) cases classified as grade I by upper GI endoscopy were classified as absent by CT virtual oesophago-graphy;
1 (1.6%) case classified as grade II by upper GI endoscopy was classified as grade I by CT virtual oesophagography;
3 (4.8%) cases classified as grade II by upper GI endoscopy were classified as grade III by CT virtual oesophagography;
2 (3.2%) cases classified as grade III by upper GI endo-scopy were classified as grade II by CT virtual oeso-pha-gography.
Discussion
In our study there was statistically significant agreement between the grading of oesophageal varices done on CT virtual oesophagography and upper GI endoscopy with a k-value of 0.913 and p-value < 0.01. The result of this study was consistent with a previous similar study done by Kim et al. [6] on patients with cirrhosis. In their study, it was observed that CT oesophagography and upper GI endoscopy “shared close correlation and substantial agreement”. However, the k-value observed in their study was 0.805, whereas in our study a higher degree of agreement was observed between the 2 modalities, with a k-value of 0.913. This could be attributed to the fact that we had more patients with higher grades of varices (grade II and III) which are more easily detected on CT oesophagography.
In our study, amongst the various grades of oesophageal varices, maximum agreement between CT oesophagography and upper GI endoscopy was observed in grade III oesophageal varices, with a k-value of 0.829. This could be attributed to the fact that grade III varices are tortuous, very prominent, and many have tumour-like configuration rendering them highly conspicuous on virtual CT oesophagography (Figure 1). In a similar study by Kim et al. a k-value of more than 0.81 was considered to represent almost perfect agreement, values of 0.61-0.80 were considered to represent substantial agreement, and values of 0.41-0.60 were considered to represent moderate agreement between CT oesophagography and upper GI endoscopy. We followed the same k-value ranges for classifying agreement between upper GI endoscopy and virtual CT oesophagography.
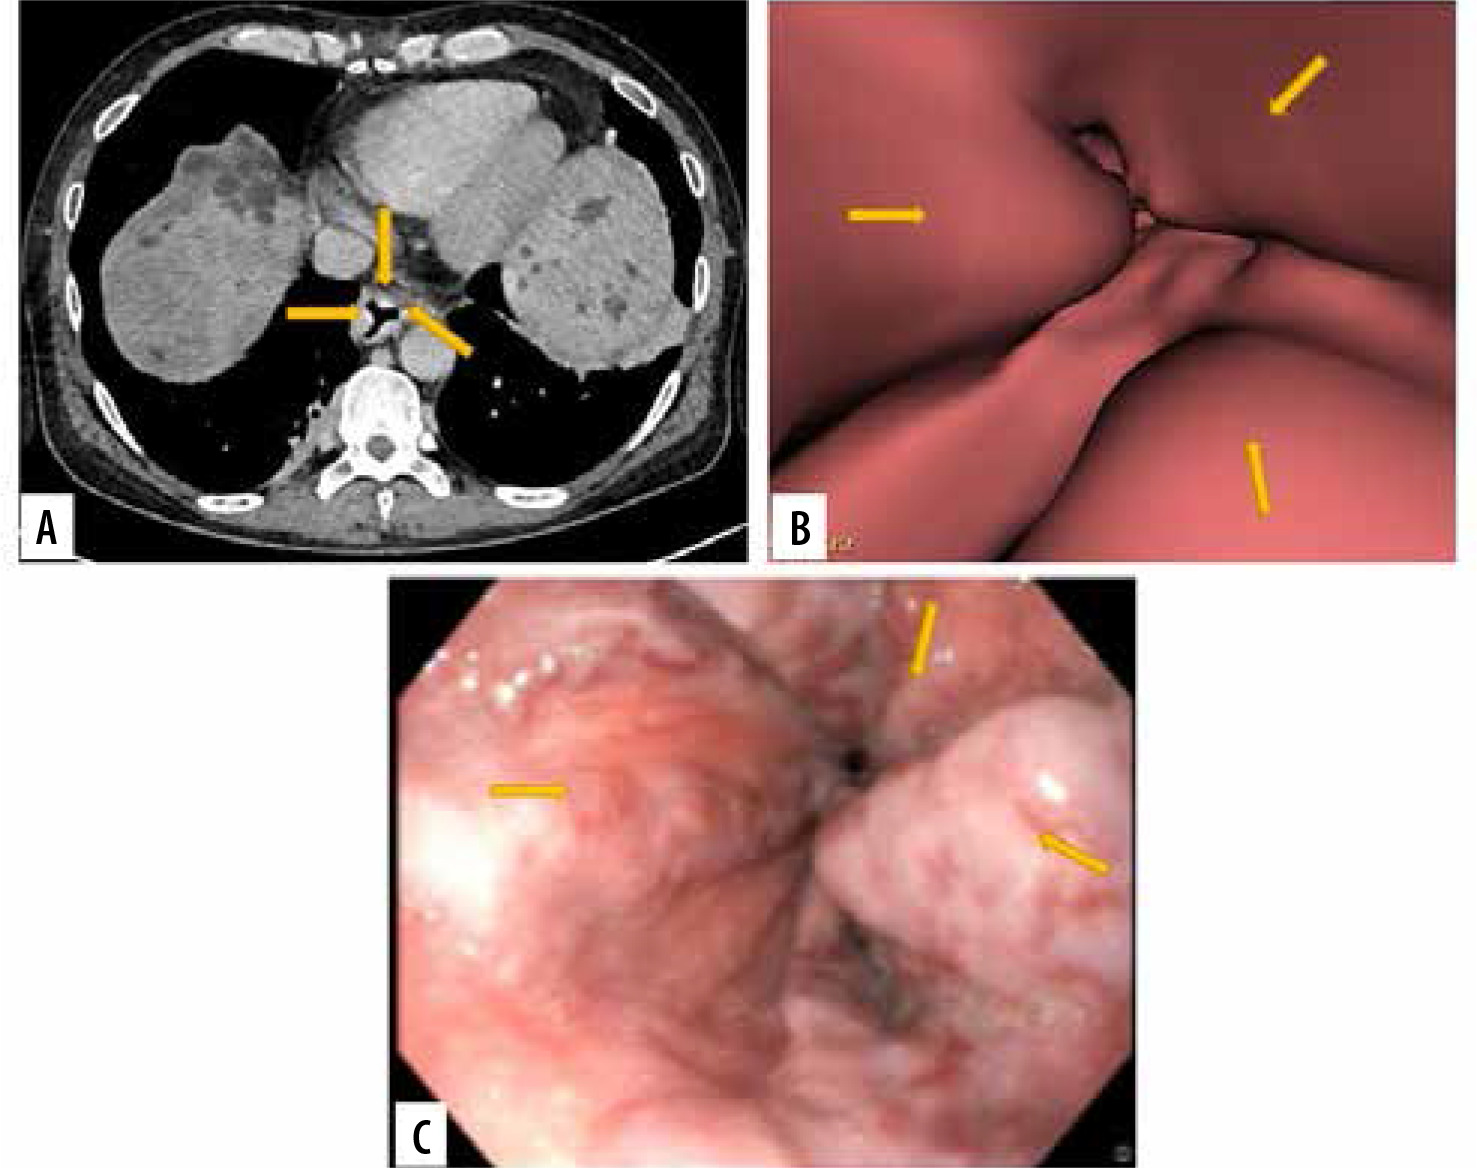
Figure 1
Images of grade III oesophageal varices in the lower oesophagus in a 66-year-old man with cirrhotic liver disease. A) Transverse computed tomography (CT) images demonstrate enhanced oesophageal varices but do not show morphologic characteristics of tortuous appearance of oesophageal varices. B) Virtual endoscopic CT images demonstrate tumour-like varices (arrows) with tortuosity in the lower oesophagus occupying less than one-third of the lumen of the oesophagus. C) Upper gastrointestinal endoscopic image confirms grade III oesophageal varices
For grade II and absent oesophageal varices, the k-values were 0.7779 and 0.611, respectively, falling under the cate-gory of substantial agreement between the 2 modalities (Figure 2) AWWA.
Figure 2
Images of grade 0 oesophageal varices in the lower oesophagus in a 52-year-old man with cirrhotic liver disease. A) Transverse computed tomo- graphy (CT) images show no oesophageal varices. B) Virtual endoscopic CT images demonstrate no varices in lower oesophagus. C) Upper gastrointestinal endoscopic image confirms grade 0 oesophageal varices

In our study, however, the agreement between the CT oesophagography and upper GI endoscopy for detection of grade I oesophageal varices was poor, with a low k-value of 0.102. This could be attributed to fact that grade I varices are not as prominent as higher grades of varices and can be inconspicuous on CT. Furthermore, the oral effervescent powder used in our study caused belching in some patients during CT oesophagography, as a result of which good oesophageal distension was not possible, rendering grade I varices difficult to detect. Moreover, there were very few cases with grade I varices in our study (Figure 3). We had 8 cases of grade I varices (detected on upper GI endoscopy), out of which one was misdiagnosed as absent varices. One was misdiagnosed as grade II varices on CT. The presence of beading in varices is used to distinguish grade I varices from grade II (Figure 4). Beading is difficult to detect on CT. Another drawback of CT was associated radiation exposure. CT assessment also provides information about liver parenchyma, the presence of liver nodules, and lesions. Extra-oesophageal features of portal hypertension, which increase the risk of oesophageal variceal bleeding, can also be evaluated simultaneously in the same sitting while the patient is undergoing CT oesophagography.
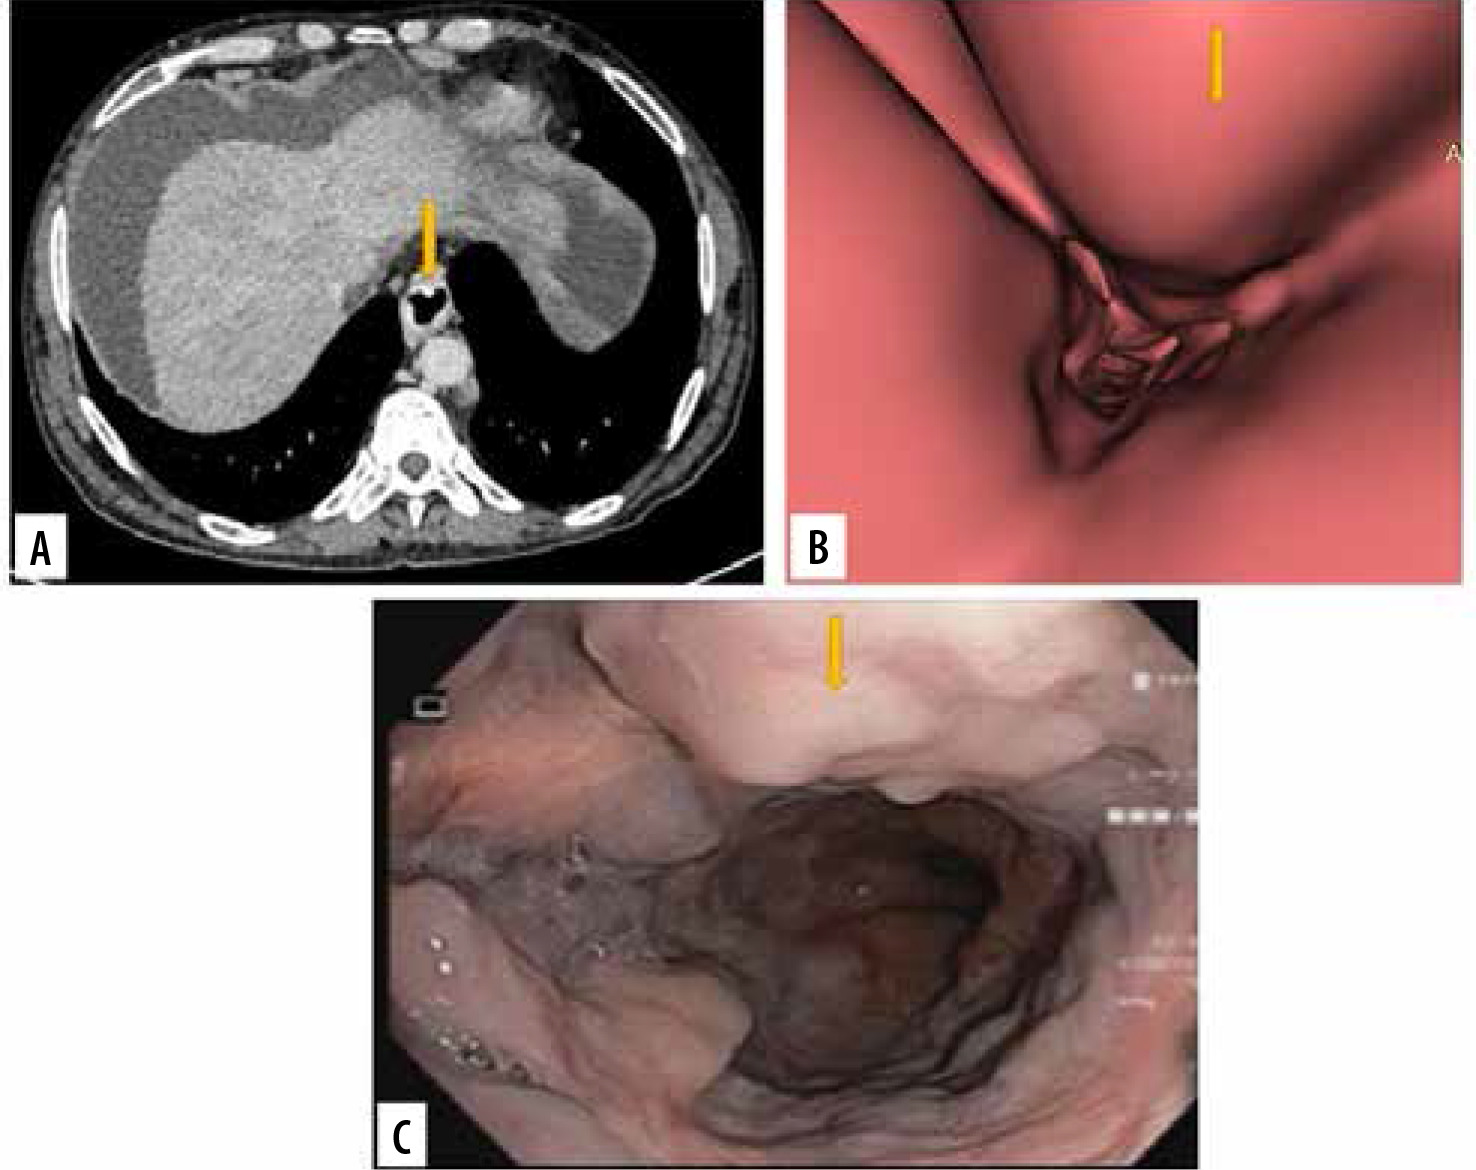
Figure 3
Images of grade I oesophageal varices in the lower oesophagus in a 66-year-old female with cirrhotic liver disease. A) Transverse computed tomography (CT) images demonstrate enhanced oesophageal varices without any definite morphologic characteristics. B) Virtual endoscopic CT images demonstrate straight varices in the lower oesophagus. C) Upper gastrointestinal endoscopic image confirms grade I oesophageal varices
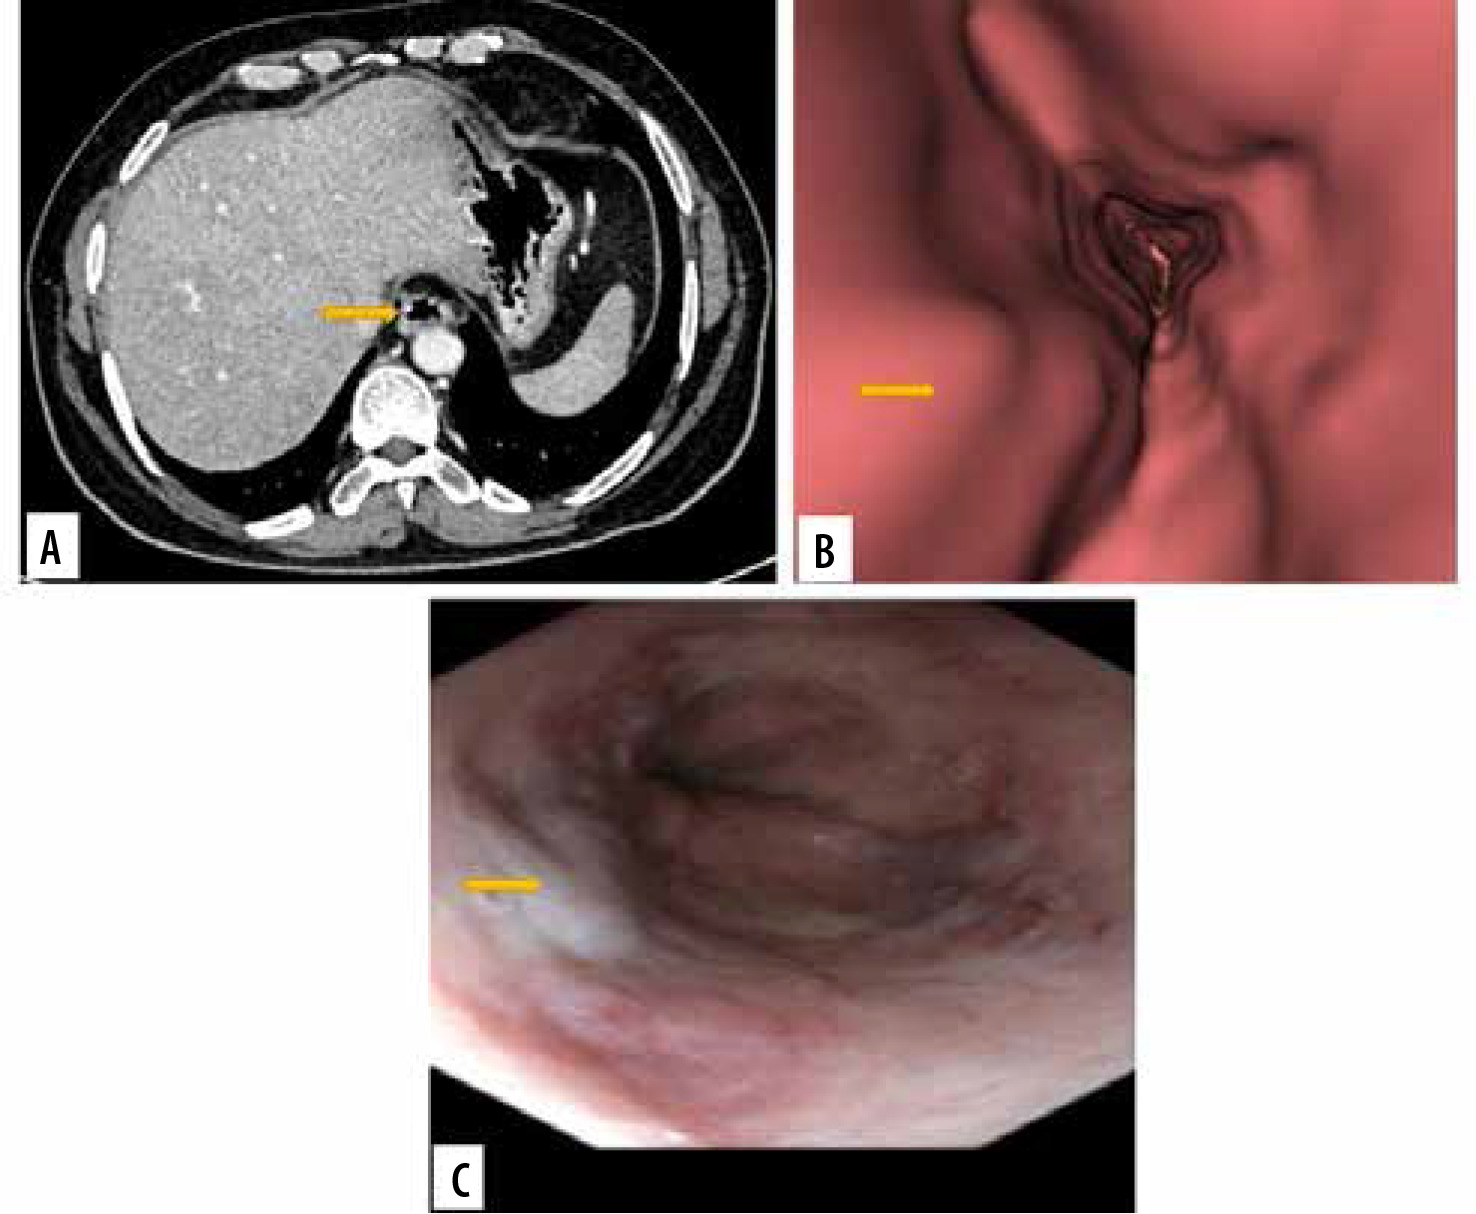
Figure 4
Images of grade II oesophageal varices in lower oesophagus in a 20-year-old man with cirrhotic liver disease. A) Transverse computed tomography (CT) images demonstrate enhanced oesophageal varices without any definite morphologic characteristics. B) Virtual endoscopic CT images demonstrate tumour-like varices (arrow) with tortuosity in the lower oesophagus occupying less than one-third of the lumen of the oesophagus. C) Upper gastrointestinal endoscopic image confirmed grade II oesophageal varices (arrow)
Overall, the CT oesophagography had good sensitivity and specificity in diagnosing oesophageal varices, with sensitivity ~ 86% and specificity ~ 90%. Agreement between the 2 modalities for high-risk varices was significant. For grade I varices the agreement was poor. However, grade I varices are low risk and do not tend to bleed commonly.
Oesophageal endoscopy, despite carrying a risk of being an invasive procedure, offers the advantage of therapeutic and curative possibility for bleeding or high-risk varices at the same time. Such high-grade varices, after detection on CT, would further require endoscopy for curative purposes. Hence, virtual endoscopy cannot obliviate the need for endoscopy in patients with oesophageal varices.
CT virtual oesophagography is a non-invasive procedure; therefore, compliance of patients was very good. It can be performed in patients with potential contraindications for endoscopic examination. Our results were significant compared to previous studies. A study by Moftah et al. also found that CT oesophagogram was a good tool for screening and grading of oesophageal varices. They also agreed that oesophagography can complement but not replace endoscopic examination. Examination of liver parenchyma in the CT esophagogram study also proved to have high cost-benefit ratio in their study and prevent repeat CT examination for liver status [15]. CT can also predict severity of varices based on surrogate imaging markers such as diameters of the splenic vein, portal vein, and left gastric vein. These markers are indirect indicators of deranged portal circulation and may predict future risk. Hence, haemodynamic evaluation as a whole is an advantage of CT over endoscopy [16,17].
Conclusions
In our study, the diagnostic performance of oesophageal varices detection by CT virtual oesophagography was good, with sensitivity: 86%, specificity: 90%, PPV: 98%, NPV: 56%, and diagnostic accuracy: 87%. There was substantial agreement between the 2 methods, and this agreement was statistically significant (Cohen’s k = 0.616, p ≤ 0.001). CT virtual oesophagography can effectively rule out grade III varices.
The non-invasive nature and ability to detect and diagnose other stigmata of chronic cirrhotic liver disease add an extra edge to CT oesophagography.
The diagnostic capability for grade I varices may be improved by using better methods of oesophageal distention, such as air insufflation.
Based on our findings, we conclude that the current study has the potential to change the way chronic cirrhotic liver disease illness is managed, as well as generate similar medical research endeavours. A multicentric study with large number of patients is needed to improve the experience with this modality.