


Introduction
The recent pneumonia outbreak originating from Wuhan, China in December 2019 is caused by the SARS-CoV-2 virus, and the resultant infection is known as new coronavirus disease (COVID-19) [1]. As of 20 July 2021, more than 190 million confirmed COVID-19 cases have been reported by the World Health Organization (WHO), claiming a death count of above 4 million [2].
Diagnosis of COVID-19 is confirmed by a real-time reverse transcription-polymerase chain reaction (RT-PCR) assay. Novel coronavirus-induced pneumonia (NCP), the main pathological feature of COVID-19, being responsible for respiratory failure and death in COVID-19 patients, is mainly identified by imaging [3]. Computed tomography (CT) has been the most widely recommended imaging method for screening suspected patients of COVID-19. It typically shows bilateral basal and peripheral pulmonary lesions [4,5]. However, it has downsides that cannot be overlooked, including the need for decontaminating equipment with each use, high price, and radiation exposure.
In recent years there has been growing interest in using lung ultrasound (LUS) as a bedside and easily reproducible imaging modality for identifying lung abnormalities. It is also a safe, non-ionizing, accurate, and not costly diagnostic tool. Several studies have shown the high accuracy of LUS in detecting bacterial and viral pneumonia and acute respiratory distress syndrome [6-8]. It has been suggested that LUS is a sensitive and relatively specific test to diagnose COVID-19 and to determine its outcome in all ages and during pregnancy [9,10]. It is more sensitive than a chest radiograph, without X-ray base imaging drawbacks and limitations, and offering portability and ease of sterilization [11-15]. Some studies showed that LUS findings are consistent with CT scan results and can be used interchangeably for COVID-19 diagnosis.
In the present study, we aimed to investigate the accuracy of LUS to diagnose COVID-19 and to determine its outcome. LUS-CT agreement in scoring lung abnormalities was also assessed.
Material and methods
Participants
This cross-sectional, observational study was carried out on 50 RRT-PCR-confirmed COVID-19 patients referring to our tertiary teaching health centre from 21 September to 21 October 2020. Demographic data and relevant medical history of patients, including age, sex, and comorbidities (diabetes mellitus [DM], hypertension [HTN], cardiovascular disease [CVD], cerebrovascular accident [CVA], cancer, and immunodeficiency) were extracted from electronic and paper records in an encrypted manner. Lab data (including haemogram, C-reactive protein [CRP], erythrocyte sedimentation rate [ESR], and lactate dehydrogenase [LDH]), and COVID-19-related symptoms (including fever, fatigue, dyspnoea, cough, myalgia, nausea, vomiting, diarrhoea, loss of consciousness, and sore throat) were also recorded. All patients underwent detailed and systematic LUS and chest CT exam on the first day of admission. The study was approved by the regional bioethics committee, and written informed consent was obtained from all subjects before enrolment.
Chest computed tomography acquisition/interpretation
All chest CT scans were performed in maximum inspiration tolerated by the patients, with the patient centred inside the CT gantry in a supine position, with raised arms. No contrast medium was administered. All chest CT scans were performed using a 16-slice multidetector scanner (Toshiba Alexion, TSX-034A, Canon, Japan). CT parameters were as follows: tube voltage of 120 kVp; tube current of 100-120 mAS with automatic exposure control; Pitch factor of 1-1.5; slice thickness of 1.0-3.0 mm; reconstruction interval of 1.0-3.0 mm; and a sharp reconstruction kernel (lung kernel).
All CT images were independently reviewed by 2 competent radiologists, experienced in thoracic imaging (with 7 and 6 years of experience), blinded to the patients’ clinical condition and LUS findings. The CT images were evaluated on lung (width, 1500 HU; level, –600 HU) and mediastinal (width, 400 HU; level, 40 HU) windows, and were interpreted and reported according to the Fleischner Society Glossary [16]. Radiologists assigned a score (from 0 to 5) to any lobe of either lung of each patient, based on the extension of airspace opacities [17,18] as follows: Score 0 no lobar involvement; score 1 – < 5% lobar involvement; score 2 – 5-25% involvement; score 3 – 25-50% involvement; score 4 – 50-75% involvement; and score 5 – 75% or greater involvement. The CT severity score for each patient was defined as the sum of all these scores, ranging from 0 to 25, with a higher score indicating greater severity. Moreover, the presence of pleural effusion in each side, regardless of its volume, was determined.
Lung ultrasound acquisition/interpretation
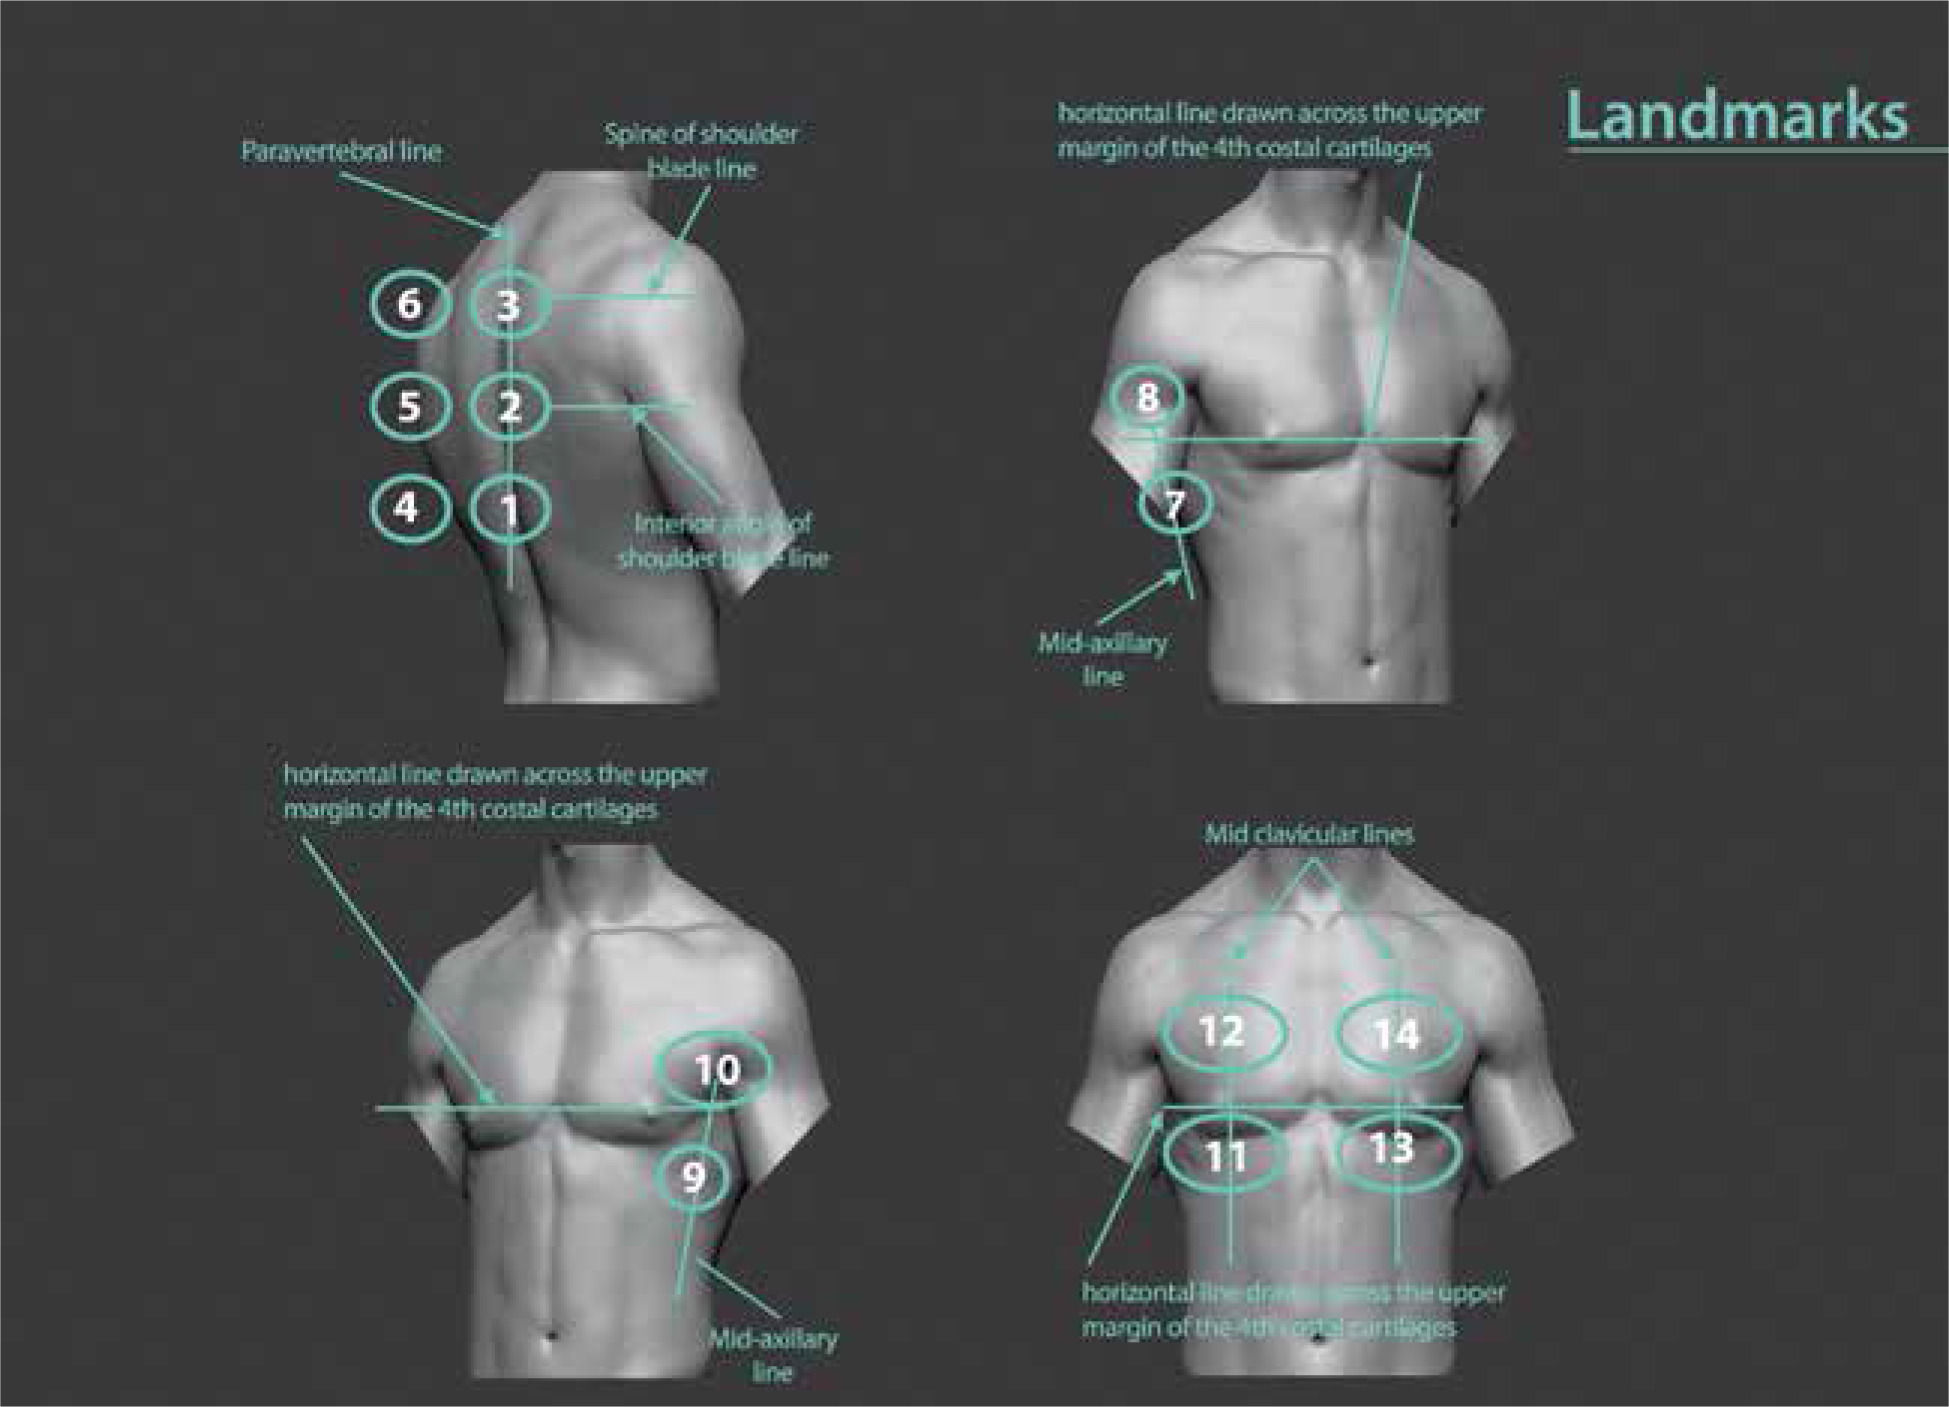
LUS was performed by a trained radiology resident blinded to clinical data and CT findings, according to the international guidelines for the indications of LUS in COVID-19 patients [19]. We made 2 minor modifications to the mentioned guideline according to what was recommended in an article commentary [20]. Instead of the inter-nipple line, the upper margin of the 4th costal cartilage was set as a landmark to separate upper and middle regions. The T10 vertebra was also considered the landmark for posterior lower regions instead of the so-called curtain sign (Figure 1).
Figure 1
Schematic presentation of recommended sequenced lung ultrasound examination, which was followed in our study. 1: right posterior lower, 2: right posterior middle, 3: right posterior upper, 4: left posterior lower, 5: left posterior middle, 6: left posterior upper, 7: right lateral lower, 8: right lateral upper, 9: left lateral lower, 10: left lateral upper, 11: right anterior lower, 12: right anterior upper, 13: left anterior lower, 14: left anterior upper
Cine loops from each area were saved in an encoded form, not recognized by interpreters (the same 2 radiologists who analysed the CT images). Patients underwent an LUS exam using a linear transducer, with a frequency of 7-8 MHz; a single focal point was set on the pleural line [21] in an intercostal approach to cover the most expansive lung area possible with a single scan. Three possible abnormalities were considered and scored [19]): (i) single or multiple foci of non-confluent (skipped) B-line (score: 1), (ii) diffuse confluent B lines (score: 2), and (iii) parenchymal consolidations with air or fluid bronchograms causing pleural interruption (score: 3). Non-confluent (skipped) and confluent B lines were differentiated based on Szabo et al. [21]. Each region’s scores were reported and analysed separately.
CT scan was considered as the gold standard modality of diagnosis, and LUS images were compared to CT findings to test their accuracy. CT/LUS findings were considered compatible in accordance with the following [22]: normal CT correlating with normal LUS, ground-glass opacity (GGO), interlobular septal thickening, or crazy paving pattern in CT with B-line (of any type) in LUS, and consolidation in CT with consolidation in LUS.
Statistical analysis
We presented data as mean ± standard deviation (SD) or median (interquartile range [IQR]) for continuous variables and frequency (%) for categorical variables. We used the independent sample t-test to compare the means of normally distributed continuous variables. A c2 test was used to analyse differences among categorical variables. Pearson correlation was used to find association between continuous variables. The model performance was assessed using the area under the curve (AUC) of the receiveroperating characteristics and measures of diagnostic accu-racy, such as sensitivity and specificity. The optimal cut-off point of the model was determined using the Youden index, calculated as (sensitivity + specificity – 1) [23]. Data were analysed by SPSS v. 22.0 (IBM Inc., Chicago, Ill., USA), and the significance level was defined as a p-value of 0.05 or lower.
Results
This was a cross-sectional, observational study conducted in a tertiary care teaching referral centre on 50 RT-PCR-confirmed hospitalized patients with a mean age of 54.60 ± 19.93 years, 26 (52%) of whom were female. Demographic, clinical, and laboratory data are shown in Table 1. The most common comorbidities recorded were hypertension (34%) and diabetes mellitus (26%), and participants most frequently presented on-admission with dyspnoea (70%), fever (64%), and myalgia (64%). The mean value of CT and LUS severity scores (CT-SS and LUS-SS) were 11.80 ± 3.89 (ranging from 2 to 20) and 13.74 ± 6.43 (ranging from 1 to 29), respectively. LUS-SS was significantly higher in females (p = 0.016), and in patients with dyspnoea (0.048), HTN (p = 0.034), immunodeficiency (p = 0.034), room air SpO2 ≤ 93 (p = 0.02), and pleural effusion in LUS (p = 0.036). LUS-SS positively correlated with age (r = 0.427, p = 0.002), ESR (r = 0.530, p = 0.000), and WBC count (r = 0.285, p = 0.045), and negatively correlated with oxygen saturation in room air (r = –0.405, p = 0.004).
Table 1
Demographic, historical, clinical, and laboratory findings
[i] ALKP – alkaline phosphatase, ALT – alanine aminotransferase, AST – aspartate aminotransferase, CRP – C-reactive protein, CT – computed tomography, CVA – cerebrovascular accident, CVD – cardiovascular disease, DM – diabetes mellitus, ESR – erythrocyte sedimentation rate, HTN – hypertension, LDH – lactate dehydrogenase, LYMPH – lymphocyte count, NEUT – neutrophil count, PLT – platelet, US – ultrasound, WBC – white blood cell count.
We found a negative correlation between CT-SS and lymphocyte count (r = –0.285, p = 0.045) and oxygen saturation in room air (r = –0.549, p = 0.000), while there was a positive correlation between CT-SS and ESR (r = 0.518, p = 0.000) and LDH (r = 0.364, p = 0.014). SpO2 ≤ 93 was significantly associated with higher CT-SS (p = 0.001). Among all clinical and para-clinical features, advanced age (p = 0.045), lower platelet count (p = 0.022), higher ESR (p = 0.041), lower room air SpO2 (p = 009), and pleural effusion (p = 0.014) were correlated with a dismal prognosis.
The time intervals between the onset of COVID-19 attributable symptoms and LUS and CT scan performing are summarized in Table 2.
Table 2
Time interval between onset of symptoms and lung ultrasound (US)/CT imaging
[i] CP – crazy paving pattern, GGO – ground glass opacity, LAL – left anterior lower, LPM – left posterior middle, LPU – left posterior upper, Multi B – not-clustered multifocal skipped B-lines, RPL – right posterior lower, RPM – right posterior middle, RPU – right posterior upper, ST – septal thickening
All patients had CT and LUS findings typical of COVID-19 [13,24-28]. Normal ultrasonography exam was only found in 22% (11/50) of posterior right lower regions (Table 3). LUS findings perfectly matched chest CT scan features both in terms of lesion type and lesion distribution, with a strong agreement between 2 modalities on a region-by-region basis (ranging from minimum LUS-CT match of 92% in anterior left lower regions to maximum LUS-CT match of 100% in the anterior right lower, posterior right middle, and posterior left upper regions). LUS-SS score also showed a moderate uphill correlation with CT-SS (r = 0.497, p = 0.000).
Table 3
Lung ultrasound (US) features in standardized regions and chest computed tomography (CT) findings in corresponded areas
CP – crazy paving pattern, GGO – ground glass opacity, LAL – left anterior lower, LAU – left anterior upper, LLL – left lateral lower, LLU – left lateral upper, LPM – left posterior middle, LPL – left posterior lower LPU – left posterior upper, Q1-Q3 – quartile 1 to quartile 3, RAL – right anterior lower, RAU – right anterior upper, RLL – right lateral lower, RLU – right lateral upper, RPM – right posterior middle, RPL – right posterior lower, RPU – right posterior upper, TI – time interval, ST – septal thickening
As shown in Table 4, ICU admission was required in 11 (22%) patients. Five (10%) patients eventually died of COVID-19. The area under the ROC curve (AUC) was calculated to predict COVID-19-related mortality. The best predictive cut-offs for LUS-SS and CT-SS are listed in Table 5. LUS-SS ≥ 14 and CT-SS ≥ 10 were predictive of room air SpO2 of ≤ 93 with AUC of 0.705 (p = 0.011) and 0.764 (p = 0.001), respectively. LUS-SS of 12 or higher was predictive of ICU admission and death with an AUC of 0.707 (p = 0.023) and 0.760 (p = 0.003); however, CT-SS of 14 or higher was predictive of ICU admission with an AUC of 0.738 (p = 0.008) (Figure 2). No discriminatory CT-SS cut-off was found to predict mortality.
Figure 2
ROC curves for patients with SpO2 > 93 (A), intensive care unit (ICU)-admitted patients (B), and deceased patients (C) according to computed tomography (CT) and lung ultrasound (US) scores
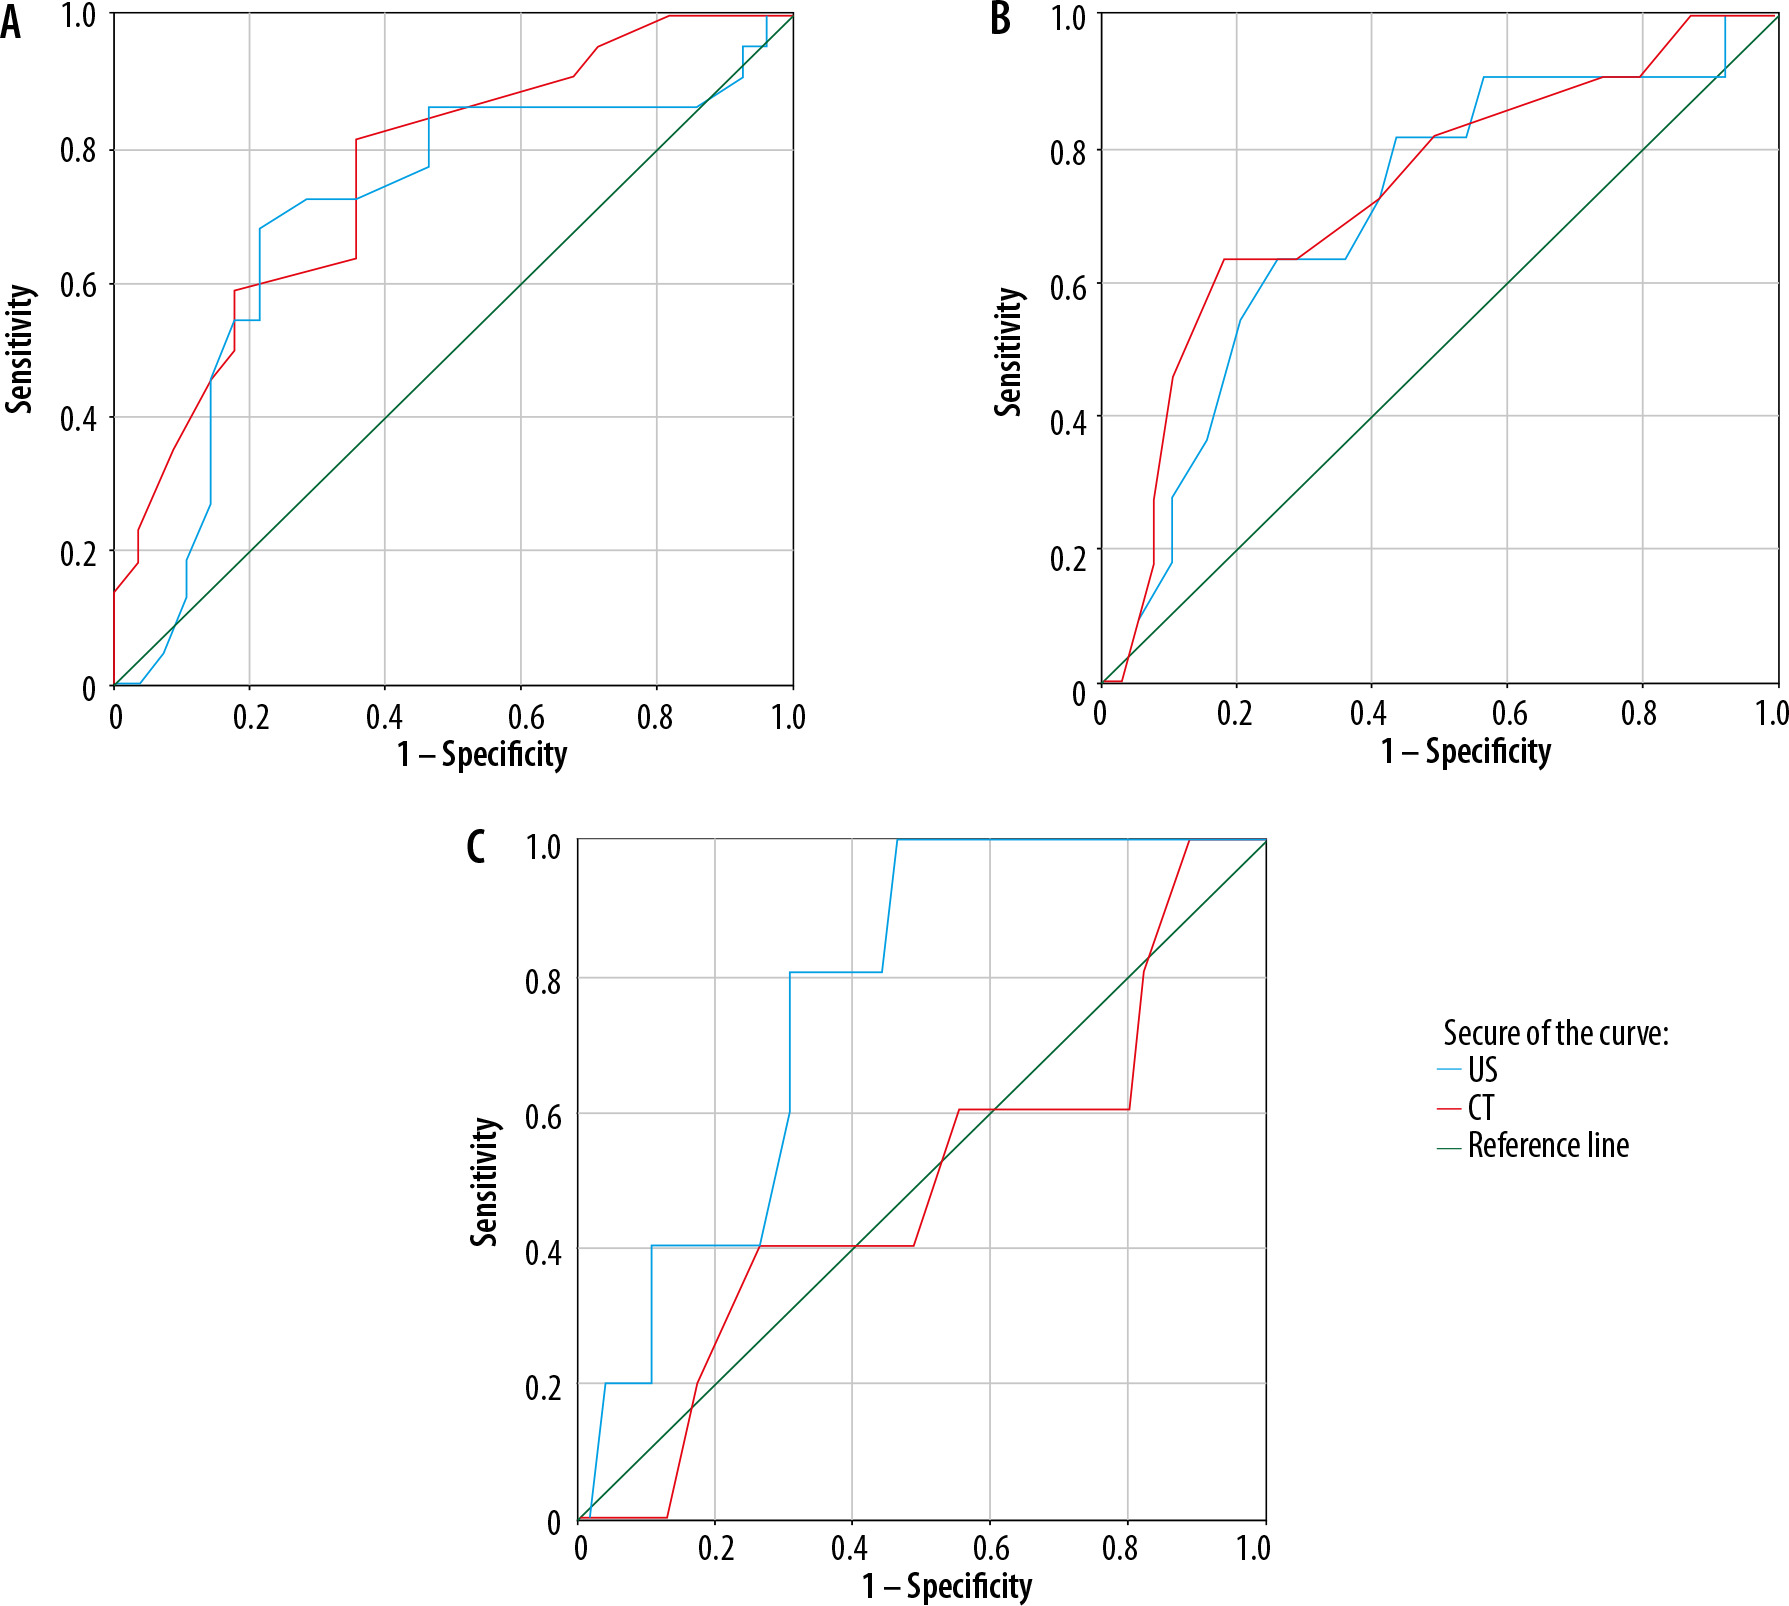
Table 4
Patient outcomes and lung ultrasound and computed tomography (CT) scores
Table 5
Suggested cut-offs for computed tomography (CT) and lung ultrasound (LUS) severity scores to predict patients’ in-hospital outcome
Discussion
Our study suggested that LUS can be a promising technique for identifying COVID-19 and determining its outcome in hospitalized patients; similarly, a recent review article stated that LUS can help to detect and stage pulmonary involvement in COVID-19 pneumonia [29]. In another study, authors proposed a clinicoradiological scoring system and claimed that it may help to not only give a quantitative measure of lung involvement, but also to identify the probability of SARS-COV-2 pneumonia [30]. The pathological pattern in LUS was consistent with CT features and confidently discernible. Therefore, LUS and chest CT scan can be used interchangeably to identify lung abnormalities in confirmed patients with COVD-19.
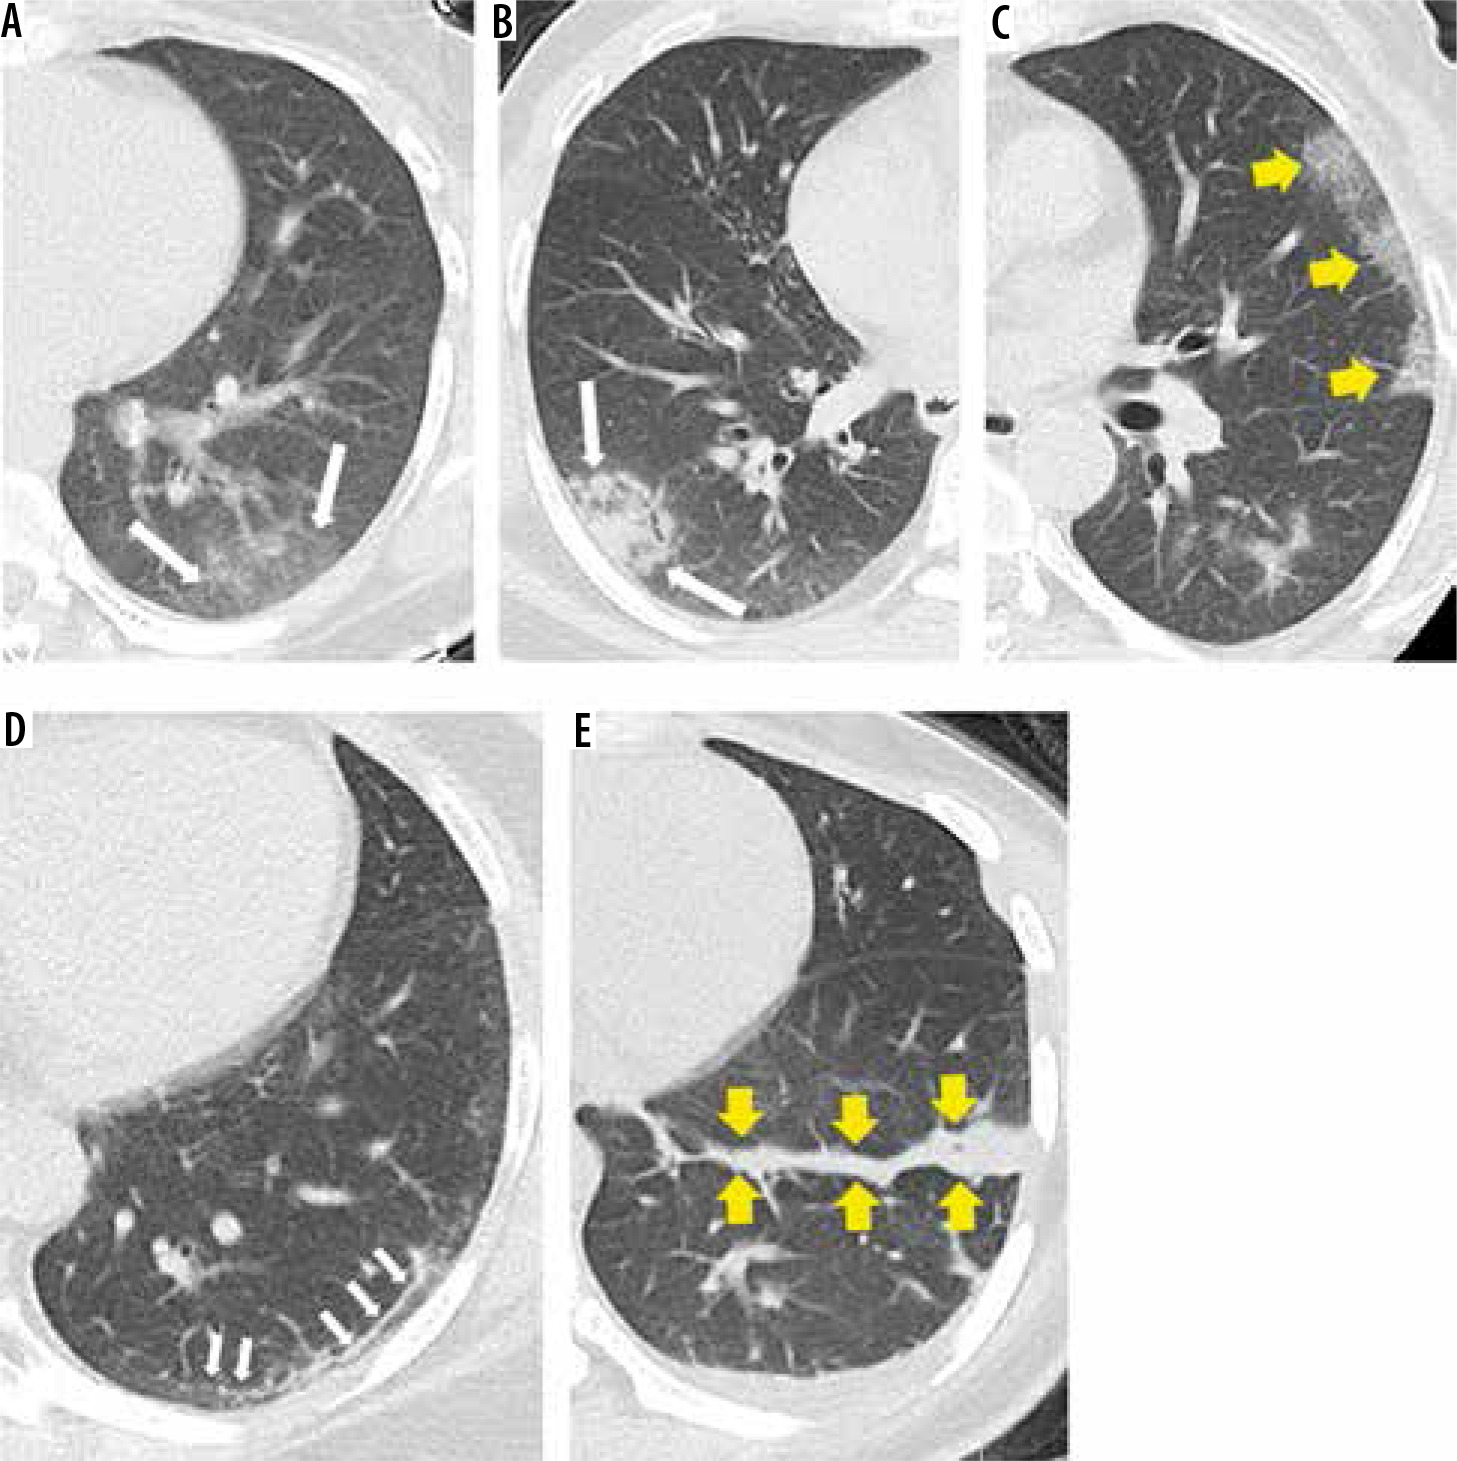
Chest CT scan is the primary imaging modality for the diagnosis of COVID-19 pneumonia. The most common chest CT features in COVID-19 patients were bilateral basilar and peripheral lesions, more frequently patchy, wedge-shaped, with a pleural base, and of ground-glass opacity. Reportedly, the most frequently involved lobe is the lower right, followed by the left upper and left lower lobes [24,25]. Pleural effusion is a rare feature in COVID-19 patients. Similar findings were observed in our study (Figure 3).
Figure 3
Computed tomography findings in different patients with COVID-19. A) Peripheral patch of ground glass opacity (GGO) (arrows) with bronchovascular structures visible within. B) Peripheral patch of consolidation (arrows) obscuring bronchovascular structures passing through it. C) Peripheral lung involvement with crazy paving pattern (arrows) with interlobular septal thickening interlacing a GGO background. D) Patient imaged 16 days after symptom onset showing subpleural line (atelectasis) in left lower lobe (arrows). This patient was imaged 2 weeks earlier and then had GGO at same region. E) Patient imaged 20 days after symptom onset, showing fibrotic cord in left lower lobe (arrows)
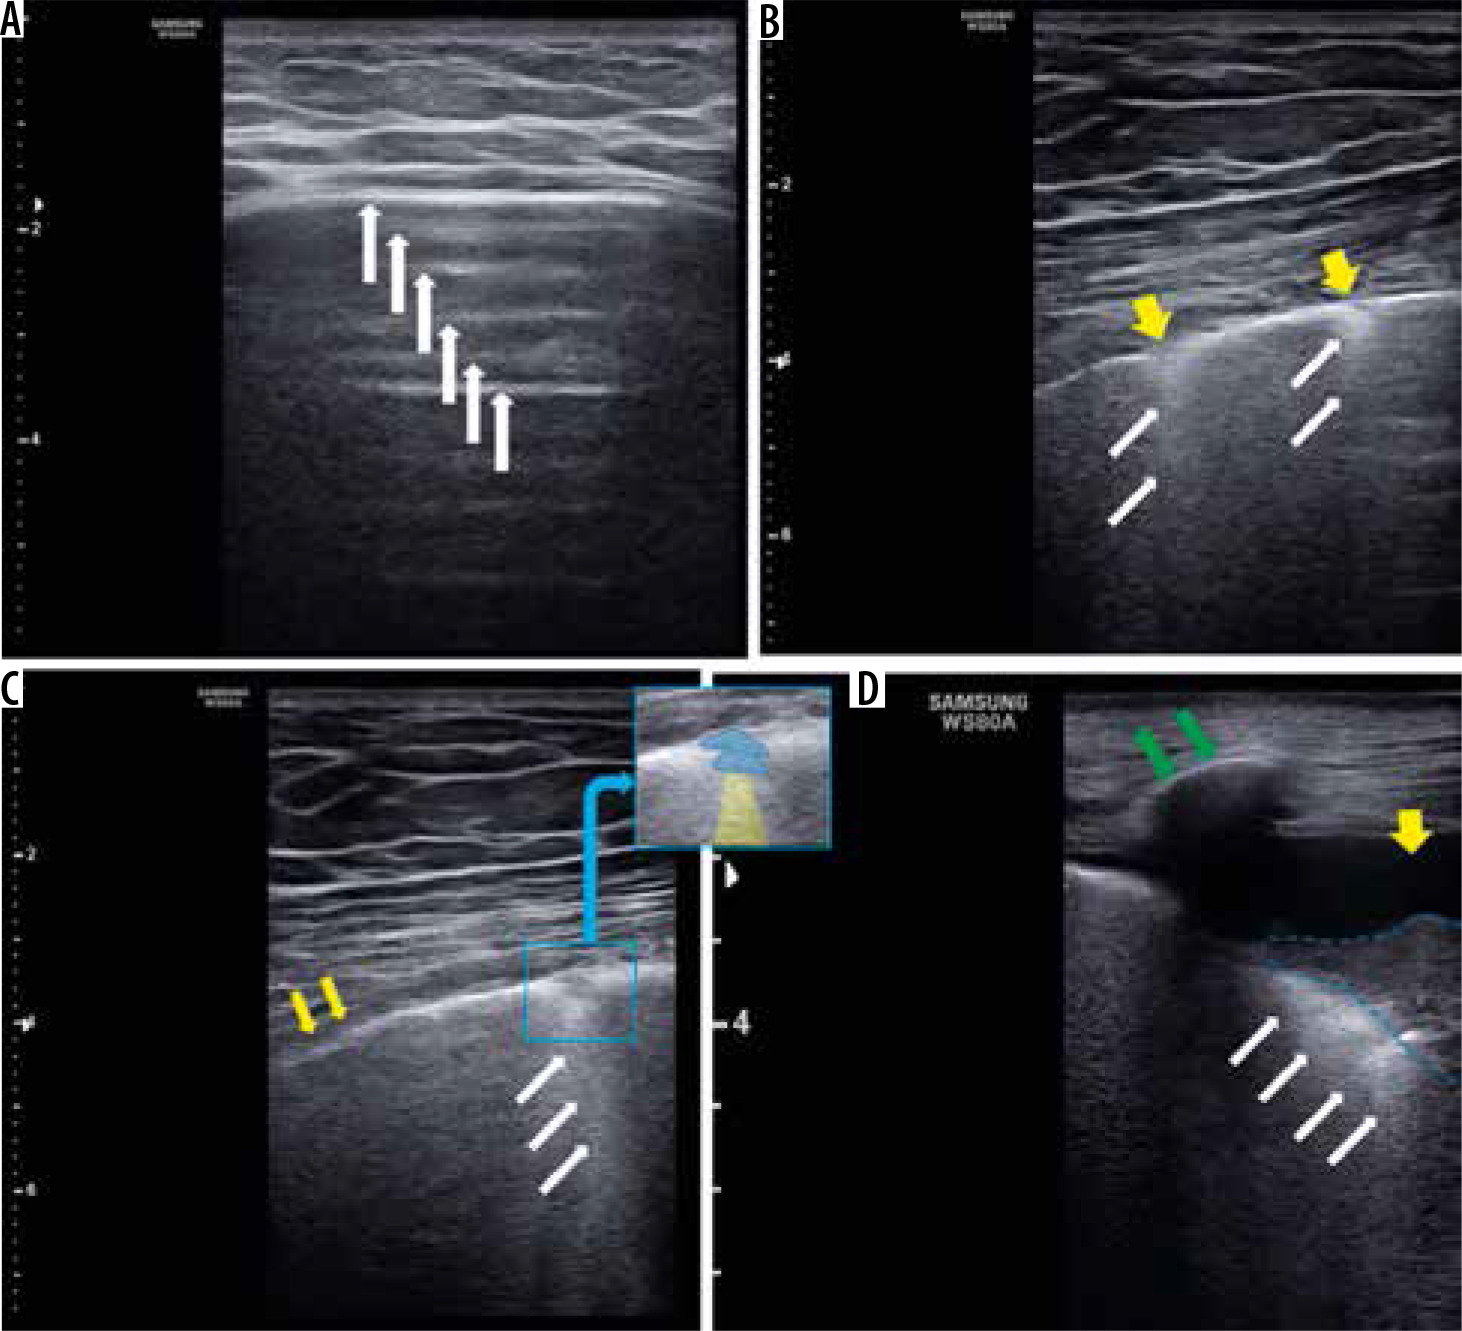
Most patients in our study showed right posterior lower and left posterior lower involvement, and multifocal bilateral B-lines were the most encountered abnormalities (Figure 4). These are consistent with a systematic review on 122 COVID-19 patients, which demonstrated that multifocal/multilobar B-lines are common lung abnormalities discernible in LUS, with an estimated prevalence of 0.94-100% [31]. LUS can identify the pathologies affecting the ratio between soft tissue and air in the peripheral lung [32]. The peripheral lung parenchyma is mainly occupied by air and reflects ultrasound waves by the specular visceral pleural plane. Scattered ultrasound waves lead to repercussions of the pleural line horizontally (A-lines), a feature that is impaired when the soft tissue-to-air ratio in subpleural lung parenchyma changes. Thus, LUS can detect alterations between tissue and air segments leading to localized vertical artifacts (B lines) [33]. Occasional B-lines (up to 2) can be seen in normal lungs (commonly at the bases). They are considered significant if 3 or more B-lines are seen in a single image between 2 ribs [34]. There is good consistency between B lines in LUS and chest CT features in COVID-19 patients [14]. Therefore, interstitial involvement depicted as B-pattern can be used for COVID-19 diagnosis, obviating the need to undergo a time-consuming irradiating CT scan.
Figure 4
Lung ultrasound findings in different patients with COVID-19. A) A-lines which are representative of normal reverberation artifacts (white arrow) going deep from the pleural line indicating normal aeration of the lung. B) Multiple skipped (non-confluent) B-lines (white arrows) correlating with moderate lung aeration loss. Note overlying pleural line interruptions (yellow arrows). C) Small patch of consolidation (highlighted in blue in small insert), which corresponds to complete aeration loss, casting a single band of B-line deeply (white arrows, highlighted in yellow in insert), which is representative of a focus of reverberation artifact through mild oedema in interlobular septa or alveoli correlating with mild aeration loss at the deep border of consolidative patch. D) Lung consolidation (outline with dashed blue line, complete air loss), surrounded by confluent B-lines (white arrows) correlating with severe lung aeration loss. Yellow arrow indicates pleural effusion, and green arrow shows rib with its shadow underneath
To assess the changes of CT and LUS findings in our patients over different stages of the disease, we determined the time interval between onset of symptoms and performing LUS. Patients who underwent LUS and CT scan within 3 days after onset of symptoms had normal lung imaging. Within 3 days of onset of initial symptoms, patients referred to our clinic had GGO/septal thickening/crazy paving pattern in CT and multifocal skipped B-line artifacts in LUS. The time between symptoms onset and performing LUS/CT in 3 patients was more than 2 weeks, 2 of them had only an atelectatic line in lower lobes, and 1 had normal LUS with fibrotic cord in the right lower lobe (Figure 3). These findings broadly support other works that studied the pneumonia timeline in imaging [18,26].
There was a significant correlation between LUS findings and advanced age and female gender, which is consistent with an investigation by Lichter et al., who found an association between age and LUS-SS [35]. However, in contrast to previous studies [35], no significant association between LUS-SS and COVID-19-related symptoms (except for dyspnoea) and comorbidities (except for HTN and immunodeficiency) was observed.
There was a significant correlation between the LUS-SS and SpO2. LUS-SS predicted the mortality among COVID-19 patients with an AUC of 0.787 and a score of 15. In a prospective cohort study by Rubio-Gracia et al. on 130 hospitalized patients, an LUS-SS of ≥ 22 had a sensitivity of 76.9% and specificity of 62.1%, with an AUC of 0.693 to predict ICU admission or mortality [36]. Another study included 180 COVID-19 patients who were admitted to the emergency department. An LUS-SS of ≥ 26 had the highest specificity (90%) and AUC to predict mortality [37]. Lichter et al. assessed 120 patients within the first 24 h of admission and reported an LUS-SS cut-off of 18 for determining mortality or the need for mechanical ventilation [35]. Our study, similarly to all the aforementioned studies, found a strong predictive value for LUS-SS to predict ICU admission and mortality. Additionally, LUS was significantly matched with chest CT scan, which adds more value to this potentially diagnostic alternative to replace the current imaging modality of choice (CT scan) in daily practice. It is worth noting that LUS brings about the advantage of evaluating heart and IVC extending the field of view, readily, and in one session, which is of great importance in patients with no clinical improvement over admission course or those with clinical deterioration, and it may reveal confounding conditions (e.g. new-onset heart failure) [38]. In a recent study, Marrazota et al. concluded that a simple combination of transthoracic echocardiography and LUS can unravel many cardiopulmonary complications that potentially follow COVID-19 pneumonia [39].
Our study has some limitations. It was conducted in just 1 tertiary COVID-19 care centre, mostly providing care for hospitalized patients with severe forms of infection. Therefore, overestimating the severity of clinical and para-clinical findings is possible. High-frequency probes can increase the sensitivity of lesion detection and reduce the false-negative rate; but by decreased penetration (especially in obese patients), it may make it harder to confidently assess subpleural lung at least in regions with thicker overlying subcutaneous fat. By excluding obese patients from our study, we overcame this problem. We implemented a 7-8 MHz linear transducer, in contrast to many previous studies that used lower frequency transducers. Air molecules serve as strong ultrasonic beam reflectors, and as a result, the major advantage of a curved transducer (deeper penetration) would be ineffective in this context. However, in consolidative lesions, ultrasound waves penetrate deeper, and a low-frequency transducer may provide additional data on parenchyma deep to airless regions. Future studies may compare the accuracy of low-frequency transducers for detecting lesions in COVID-19 pneumonia with that of linear high-frequency probes, and their additive diagnostic value in this regard. Our study sample was small, but comparable to previous studies and larger than many of them.
Conclusions
Our findings show that LUS features are strongly consistent with CT findings in COVID-19 hospitalized patients. Moreover, we found LUS-SS cut-offs to be strongly predictive of room air SpO2 ≤ 93, ICU admission, and death. Therefore, LUS may be considered a useful tool for COVID-19 diagnosis and predicting the risk of mortality in hospitalized patients, stratifying high-risk patients early on, and leading to a more reasonable resource allocation.