


Introduction
Gallbladder cancers (GBCs) are highly aggressive tumours with a 5-year survival rate of approximately 20% [1]; 90% of cases are diagnosed with metastases or local advancement. The absence of the muscularis mucosa/submucosa and the continuity of connective tissue of the gallbladder along the hepatic surface with the interlobular connective tissue facilitates local extension or metastasis of GBCs, which may play a role in poor prognosis [2,3].
Complete surgical resection is the only curative treatment for GBCs [4], while laparoscopic cholecystectomy is usually performed for gallbladder polyps (GBPs) where there is no suspicion of GBC. Incidental GBC can be detected in 0.3-2.1% of patients who undergo laparoscopic cholecystectomy for benign gallbladder tumours [2,5,6]. In cases of an assumed benign GBP preoperatively, which develops intraoperative bile leakage and postoperative patho-logy reveals a GBC, the patient may be at risk of peritoneal dissemination. If a patient is suspected of having a GBC preoperatively, open cholecystectomy can be chosen to reduce the risk of bile leakage; hence, a preoperative diagnosis of GBC is vital to reduce postoperative recurrence [7,8].
A tumour size ≥ 10 mm serves as a crucial indicator for differentiating GBCs from GBPs [2,9-11]. However, when used as a surgical criterion for GBPs, approximately 50% of GBPs meet this indication [12]. In addition, only 30-50% of all GBCs are diagnosed preoperatively, and the remaining cases are detected during surgery or by postoperative pathology [13,14]. Therefore, additional imaging findings are imperative to enhance diagnostic performance.
Dynamic contrast computed tomography (CT) has proven effective in distinguishing GBCs from GBPs [11,15]. However, CT is not routinely performed for the preoperative evaluation of a GBP in the absence of suspected GBC. In contrast, non-enhanced magnetic resonance imaging (MRI), including cholangiopancreatography, is widely utilised for lesion evaluation, encompassing GBPs and the preoperative assessment of bile duct anatomy [10,11]. The ability of preoperative non-enhanced MRI to differentiate GBCs from GBPs may translate into improved surgical strategies and clinical outcomes.
Linear low-signal intensity representing the mucosal and muscular layers of the normal gallbladder wall in a half-Fourier acquisition single-shot turbo spin-echo (HASTE) sequence during MRI has been reported to be a valuable tool for differentiating GBCs from cholecystitis and adenomyomatosis [16]. Additionally, a loss of low-signal intensity at the tumour base can aid in determining T1a lesions from T1b or higher in the TNM classification of GBCs [17]. Hence, the HASTE sequence may help in distinguishing GBCs from GBPs.
Diffusion-weighted imaging (DWI), which measures the mobility of water in tissues to assess tissue cellularity and microenvironment, was performed. The utility of an apparent diffusion coefficient (ADC) map generated by calculating the ADC values from DWI has been reported in differentiating GBC from other benign lesions, tumour grading prediction, and forecasting prognosis [18-23]. While some studies on GBCs and GBPs have also been performed, GBPs were often assessed as part of inflammatory and other diseases, and the number of GBPs was limited (< 10) [18,19]. We hypothesise that valuable findings, in addition to size measurement on non-enhanced MRI, may aid in differentiating GBCs from GBPs.
Gallbladder lesions < 10 mm are less likely to be malignant [2,9-11]. GBCs ≥ T3 in the TNM classification invade surrounding tissues and are easily differentiated from benign lesions [24]. Accordingly, we believe that the differentiation between GBCs and GBPs ≥ 10 mm and GBCs ≤ T2 stage preoperatively is crucial to improve patient outcomes and aid in decision-making regarding the optimal surgical approach.
This study aimed to assess the usefulness of non-enhanced MRI for differentiating GBCs from GBPs ≥ 10 mm.
Material and methods
Patient selection
This retrospective cohort study was approved by our institution’s review board. Due to the study’s retrospective nature, the need for informed consent was waived. The records of patients with a pathologically proven GBC or GBP were reviewed when the clinical information became available. All patients underwent surgery between January 2010 and April 2022 and were pathologically confirmed to have GBCs or GBPs. Patients with (a) a GBC or GBP ≥ 10 mm on pathological reports, (b) GBC ≤ T2 stage according to the TNM classification [25], and (c) a preoperative MRI at our institution were included in the study. The exclusion criteria were as follows: patients with (a) a GBC or GBP < 10 mm on the pathological report, (b) GBC ≥ T3 stage, (c) incomplete image data due to non-routine protocols or artifacts, and (d) MRI imaging performed at another institution.
The approval of the Bioethics Committee for the research number: 34-209(11360).
MRI scanning protocol
All patients underwent MRI on a 1.5-Tesla MR unit (MAGNETOM Avanto (n = 69) or MAGNETOM Symphony, A Tim System (n = 2), Siemens Medical Solutions, Erlangen, Germany) with a 6-channel body matrix coil, or a 3.0-Tesla MR unit (MAGNETOM Skyra (n = 16) or MAGNETOM Vida (n = 3), Siemens Medical Solutions, Erlangen, Germany) with an 18-channel body coil.
Transverse T1-weighted imaging (T1WI) was performed using fat-saturated 2D or 3D gradient echo (2D fast low-angle shot or 3D volumetric interpolated breath-hold sequence). Of the 69 cases performed with Avanto, 43 and 26 were obtained using a 2D and 3D gradient echo, respectively. The remaining cases were evaluated using 3D gradient echo. Transverse and coronal T2-weighted images were obtained using HASTE sequences. For the Avanto and A Tim Systems, transverse DWI was performed as a single-shot echo-planar imaging pulse sequence with b-values of 50 and 800 s/mm2 using respiratory triggering; for Skyra and Vida, b-values of 50, 800, or 1000 s/mm2 were used. The number of patients scanned and the b-values used were as follows: one patient by Vida (b = 800 s/mm2), 2 by Vida (b = 1000 s/mm2), 8 by Skyra (b = 800 s/mm2), and 8 by Skyra (b = 1000 s/mm2). ADC maps were automatically generated using an operating console. The MRI pulse sequence parameters are listed in Supplementary Table 1.
Imaging analysis
Two abdominal radiologists with 15 and 5 years of experience, respectively, who were blinded to the pathological diagnosis and clinical information, retrospectively reviewed the anonymised MRI images on a picture archiving and communication system workstation monitor. When 2 or more lesions were present, and no histological difference was observed between the lesions in the same case, the largest lesion was selected for evaluation.
For qualitative analysis, the following imaging parameters were evaluated: (a) lesion shape (pedunculated or sessile-shaped), (b) lesion margin (well- or ill-defined), (c) basis indentation (present or absent), (d) continuity of the mucosal and muscular layers (CMML) (present or absent), (e) gallstone (present or absent), and (f) lympha-denopathy > 10 mm in minimum diameter (present or absent). The lesion shape was classified as pedunculated or sessile-shaped based on the classification of Ishikawa et al. [26]. Basis indentation was defined as the concavity of the wall in contact with the lesion or the lesion itself. In the presence of an uninterrupted low-signal intensity layer on HASTE showing mucosal and muscular layers, CMML was considered to be present. CMML was considered absent when it was interrupted or absent due to the invasion of cancer, which showed a different signal intensity than the mucosal and muscular layers (Figures 1 and 2). When the inside of the gallbladder showed a low signal on HASTE due to sludging of bile in the gallbladder, the layer was additionally evaluated on T1WI.
Figure 1
Examples of magnetic resonance imaging (MRI) findings of gallbladder cancer (GBC). A-C) Half-Fourier acquisition single-shot turbo spinecho images. D-F) Apparent diffusion coefficient (ADC) map images. C) Coronal and (A, B, D-F) axial images. A, D) A 76-year-old male with a T2 GBC. B, E) A 78-year-old male with a T2 GBC. C, F) A 78-year-old female with a T2 GBC. A-C) The tumour sizes were 11, 14, and 14 mm, respectively. A-C) The continuity of the mucosal and muscular layers in the area adjacent to the lesion is absent. Yellow lines on the image indicate preserved mucosal and muscular layers; yellow dotted lines indicate interruption. D-F) The normalised signal intensity ratio on the ADC map was 1.626, 1.606, and 1.498, respectively
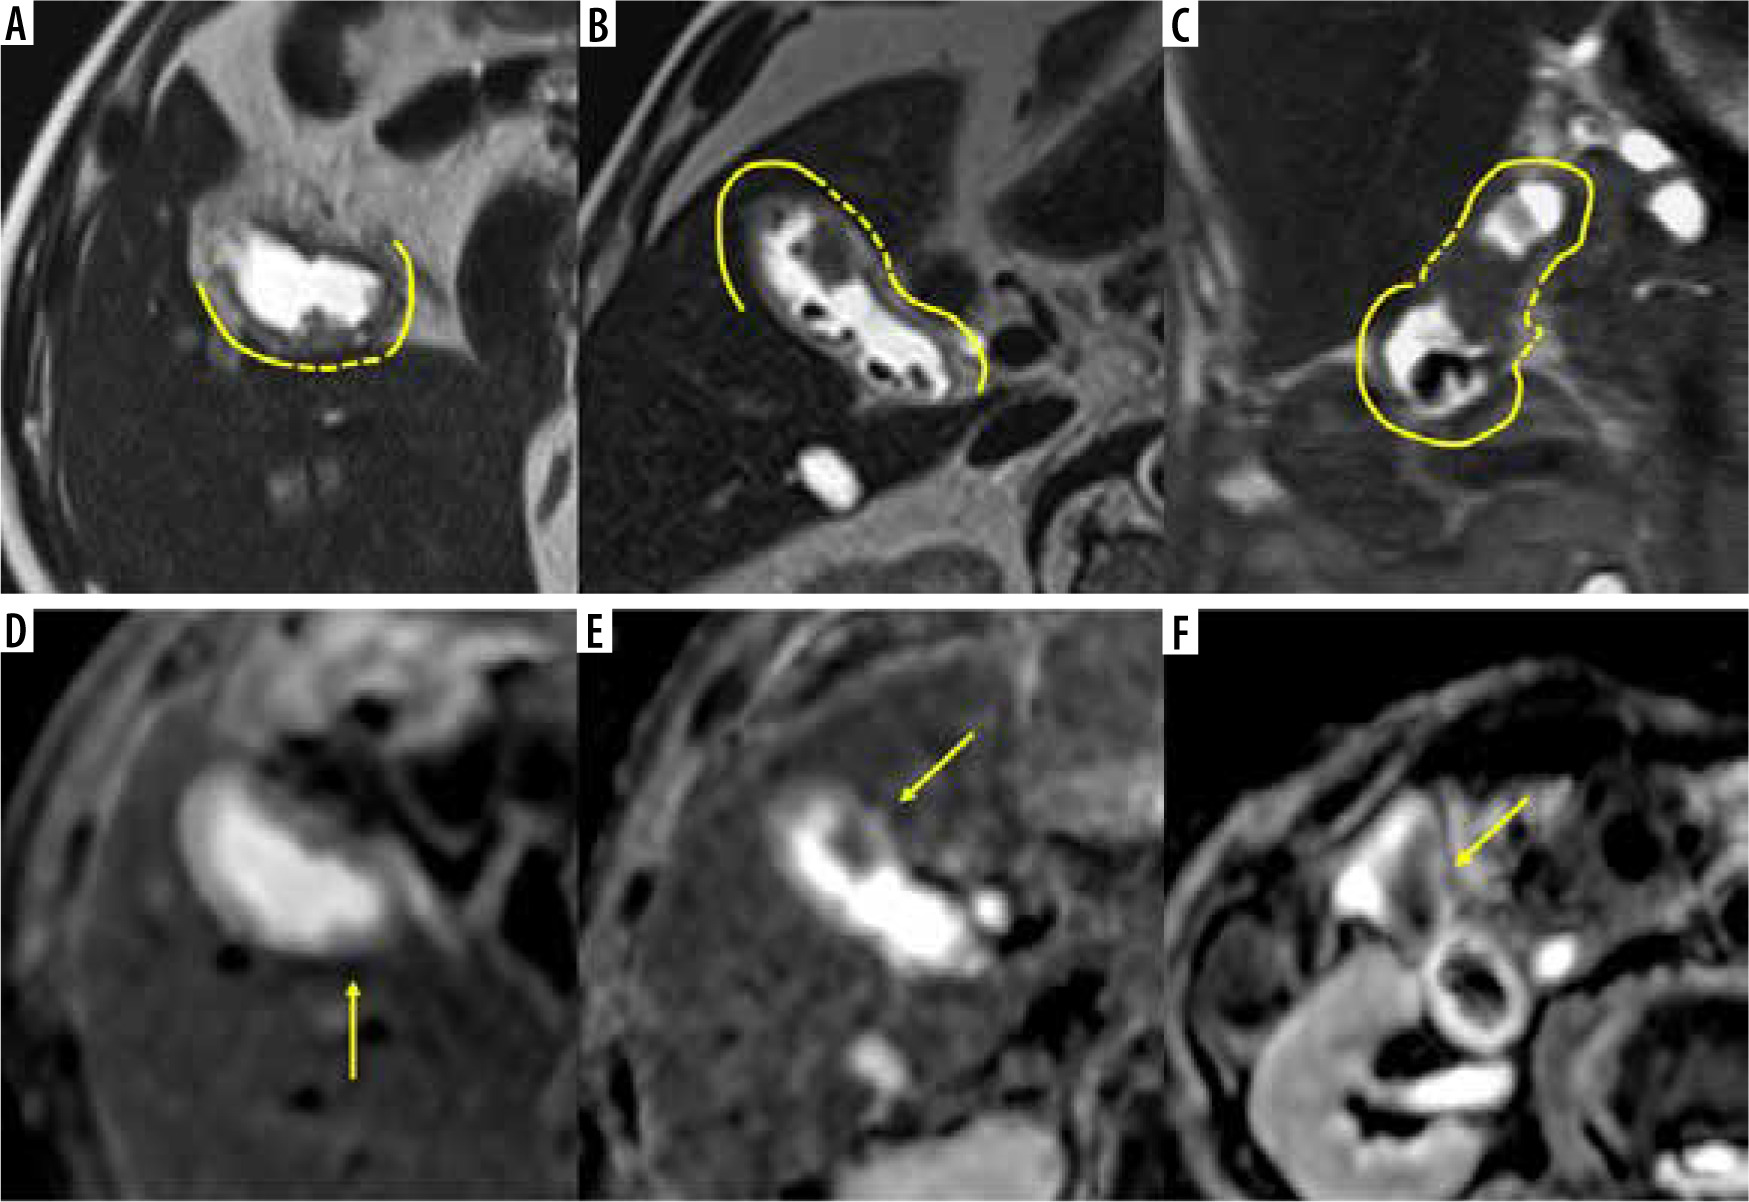
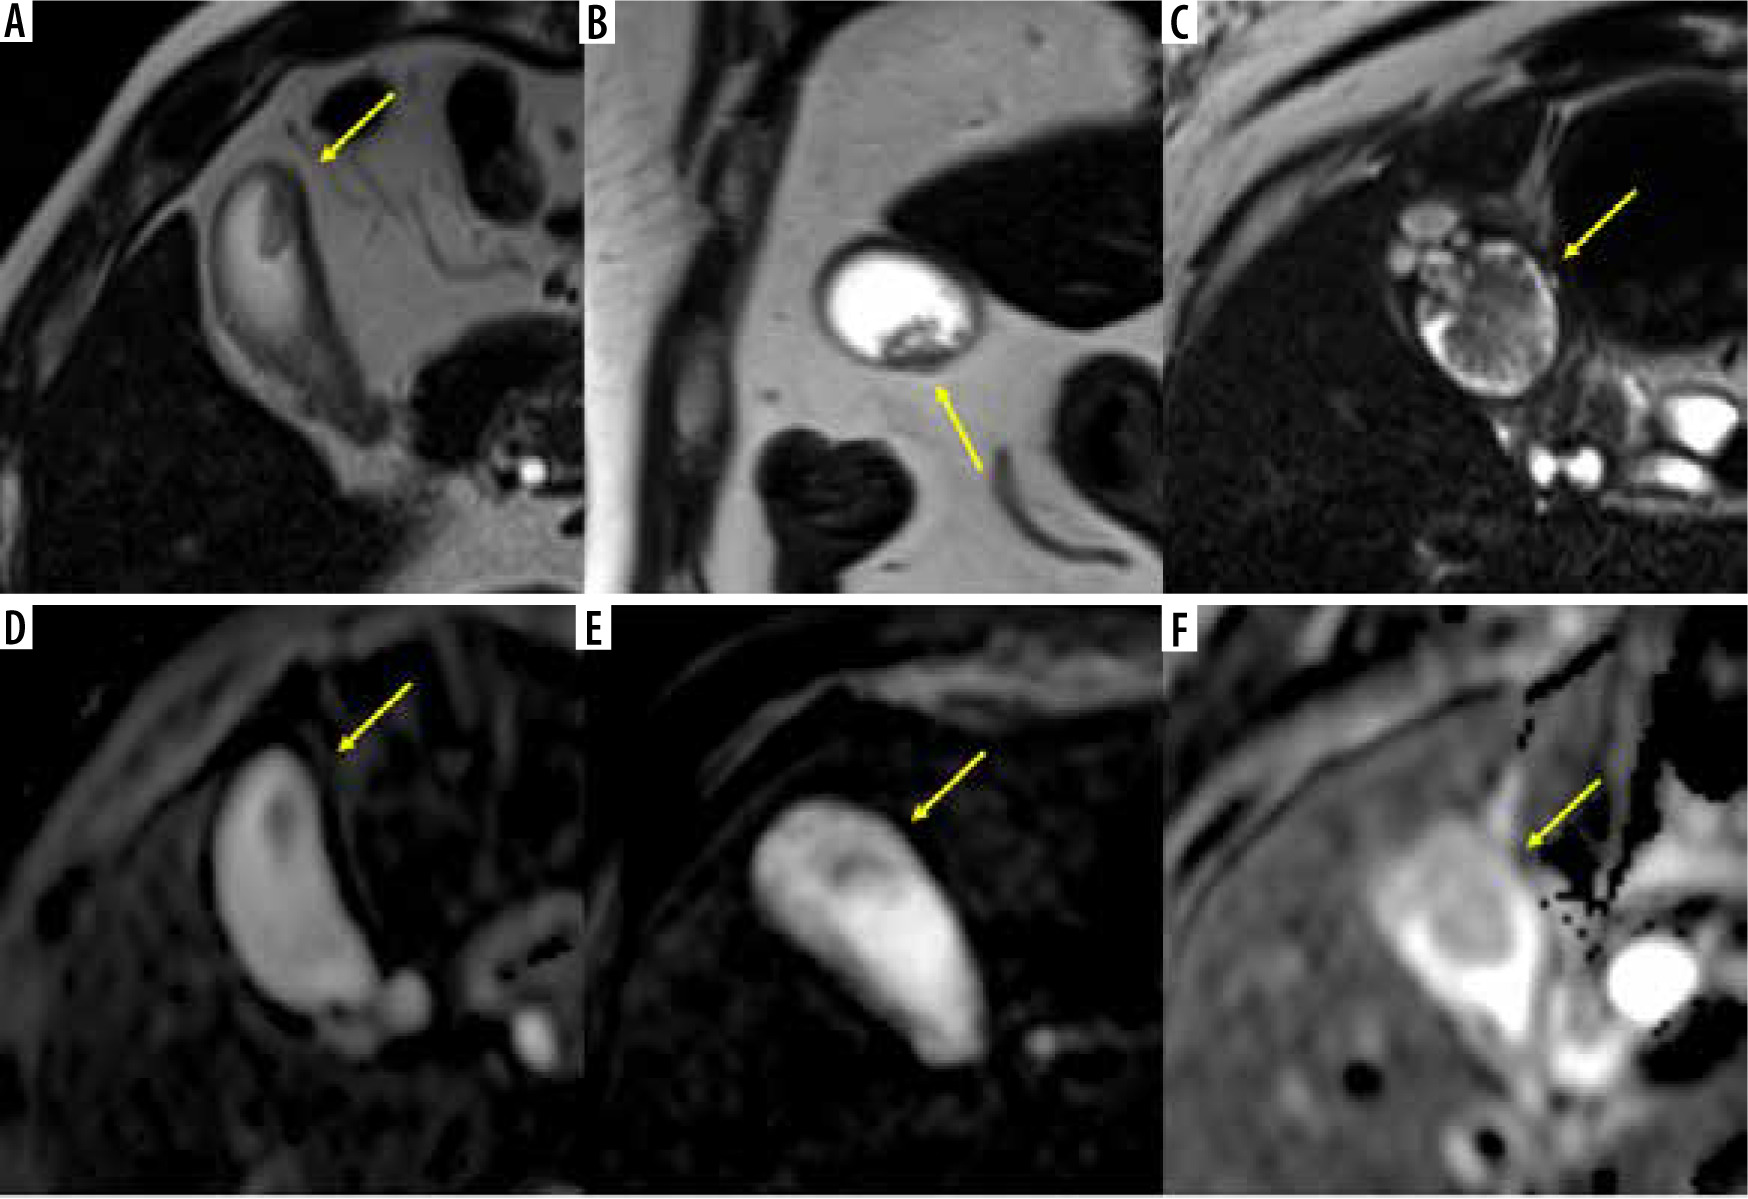
Figure 2
Examples of magnetic resonance imaging (MRI) findings of a gallbladder polyp (GBP). A-C) Half-Fourier acquisition single-shot turbo spin-echo images. D-F) Apparent diffusion coefficient (A,D,C) map images. B) Coronal and (A, C-F) axial images. A, D) A 58-year-old male with a GBP. B, E) A 73-yearold male with a GBP. C, F) A 65-year-old female with a GBP. A, C) The tumour sizes were 15, 23, and 26 mm, respectively. A-C) The continuity of the mucosal and muscular layers in the area adjacent to the lesion is present. D-F) The normalised signal intensities ratio on the ADC map were 1.931, 2.340, and 1.322, respectively
For quantitative analysis, the following imaging parameters were evaluated: (a) maximum tumour diameter and (b) signal intensity of the lesion on T1WI, HASTE, and ADC map. For normalisation, the signal intensity of the lesion on each sequence was divided by the signal intensity of the spinal cord as a control, which differs little between each patient unless affected by neurological pathology [23]. This divided value was named the normalised signal intensity ratio (NIR) and was calculated as follows:
The region of interest (ROI) was set to the largest portion of the tumour and the lumbar enlargement on the T1WI, HASTE, and ADC map to measure the signal intensity of the lesion and spinal cord. The signal intensity was measured twice by setting the ROI, and the average value was used for the calculation.
Reproducibility test
A reproducibility test was performed by 2 other radiologists with 5 and 4 years of experience, respectively, using only selected variables that showed statistical significance in the multivariate analysis. The maximum tumour dia-meter was measured to compare the results with tumour size. They independently evaluated images by referencing all imaging sequences available for lesion detection. Tumour size plays a critical role in differentiating a GBC from a GBP [2,3,9-11]; the size of a GBC and GBP in the reproducibility test was limited to those less than or equal to the maximum diameter of the GBP.
Statistical analysis
Qualitative variables were analysed using the χ2 or Fisher’s exact test, while the Mann-Whitney U test was used for quantitative analysis. Tukey’s honestly significant difference test was used for multiple comparisons among 3 or more groups. Interobserver agreement was evaluated by calculating Cohen’s k coefficient and intraclass correlation coefficients (ICCs), which were classified as follows: 1.0, perfect agreement; 0.81-0.99, almost perfect agreement; 0.61-0.80, substantial agreement; 0.41-0.60, mode-rate agreement; 0.21-0.40, fair agreement; and ≤ 0.20, slight agreement. A multivariate analysis was performed using the variables that showed significant differences between GBCs and GBPs in the univariate analysis and the knowledge and clinical judgment from previous reports [2,3,9-11]. Tumour size was excluded as a multivariate analysis variable for this study to identify additional characteristic findings beyond size.
The diagnostic performance (sensitivity, specificity, accuracy, positive predictive value (PPV), and negative predictive value (NPV)) of each quantitative variable was estimated using receiver operating characteristic (ROC) analysis. The optimal thresholds for differentiating between the GBC and GBP groups were chosen based on the highest possible sensitivity and specificity on the ROC curves.
Statistical analyses were performed using SPSS version 25.0 (IBM Corp. SPSS for Windows, Armonk, NY, USA). Statistical significance was set at p < 0.05.
Results
Ninety lesions (39 GBCs and 51 GBPs) were included in the study (Figure 3). The cohort consisted of 60 men and 30 women, with an average age of 57.5 years (range: 24-87 years). Based on the TNM classification [25], GBCs were Tis, T1a, T1b, and T2 in 3 (7.7%), 10 (25.6%), 6 (15.4%), and 20 (51.3%) lesions, respectively. There were no cases in which GBC and GPP ≥10 mm were present simultaneously. The average interval between MRI investigation and surgery was 41 ± 36.5 days. The results of the patient and tumour characteristics analyses are summarised in Table 1. Age and pathological tumour size showed significant intergroup differences (p < 0.001).
Figure 3
Flow diagram summarizing the patient sampling process
GBC – gallbladder cancer, GBP – gallbladder polyp.

Table 1
Results of patient and tumour characteristics
a There was a significant difference between laparoscopic choledochotomy and extended cholecystectomy, and between laparoscopic choledochotomy and extended cholecystectomy with hepatectomy; p-values were 0.00 and 0.02, respectively. Numbers in parentheses represent percentages. Age and pathological tumour size are expressed as median and interquartile range (25th-75th percentile).
The results of qualitative, quantitative, and reproducibility analyses are summarised in Table 2. Examples of GBC and GBP images are shown in Figures 1 and 2. In the qualitative evaluation, lesion shape, gallstone, and CMML showed statistically significant differences for both readers (p < 0.001). The presence of gallstone and absence of CMML showed substantial agreement in Cohen’s k coefficient. Quantitative analysis showed that tumour size and NIR on the T1WI, HASTE, and ADC map were statistically significant for both readers. The highest AUCs (area under the curve) were as follows: tumour size, 0.92, and NIR-ADC, 0.82. All variables in the quantitative analysis showed substantial agreement or better ICC values.
Table 2
Results of quantitative and qualitative assessment and those of reproducibility
The diagnostic performance results are summarised in Table 3. The PPV of CMML was approximately 100%. The cut-off value of tumour size was 13 mm, and the cut-off ratios of the NIR-T1WI, NIR-HASTE, and NIR-ADC map were 1.11, 2.77, and 1.86, respectively.
Table 3
Diagnostic performance of findings showing statistically significant difference and high reproducibility
The results of the multivariate logistic regression analysis were as follows: there were significant differences in CMML, NIR-T1WI, and NIR-ADC between GBC and GBP (odds ratio: 46.90, 5.99, 9.82; 95% confidence interval: 5.43-404.94, 1.24-28.92, 2.52-38.32; p-value: < 0.001, 0.03, < 0.001, respectively). NIR-HASTE did not show statistically significant differences between groups (p-value > 0.05). The results of the multivariate logistic regression analysis are summarised in Supplementary Table 2.
The results of the reproducibility tests are summarised in Table 4. Fifteen GBC lesions ≤ 25 mm were selected for the reproducibility test, in accordance with the pathological results that the largest GBP lesion was 25 mm. There were 8 (53.3%) T1a, 2 (13.3%) T1b, and 5 (33.3%) T2 stages. Similarly to the main study, there were 51 cases of GBPs. The CMML had the best specificity, accuracy, and PPV. Moreover, the sensitivity was improved when used in combination with NIR-ADC.
Table 4
Diagnostic performance in reproducibility test of findings that showed significant differences in multivariate analysis
The results of the diagnostic performance of tumour size and other findings in the reproducibility test are summarised in Table 5. The addition of CMML assessment to tumour size resulted in only a slight decrease in the specificity of reader C compared to tumour size alone. At the same time, other diagnostic performances, including sensitivity and accuracy, increased. The remaining combinations did not outperform the tumour size alone evaluation.
Table 5
Diagnostic performance regarding tumour size and combination with other findings in reproducibility test
Discussion
Multivariate analysis showed significant differences in CMML, NIR-T1WI, and NIR-ADC to differentiate GBCs from GBPs ≥ 10 mm. The absence of CMML is a helpful indicator of GBC due to its PPVs of ~100%. When the lesion size is ≥ 10 mm, a GBC is more likely, but the possibility of a GBP persists. In such cases, evaluating the absence of CMML and NIR-ADC helped in differentiating GBCs from GBPs. Evaluating the absence of CMML and measuring tumour size showed superior diagnostic performance compared to assessing tumour size alone in the differentiation of GBCs from GBPs.
Continuity of the mucosal and muscular layers
A low-signal intensity layer on HASTE of the gallbladder wall correlates with the mucosal and muscular layer [16]. In contrast, GBCs show homogeneous low-signal intensity without a layer structure, reflecting the infiltration of cancer cells into the wall. In GBPs, because the mucosal and muscular layer is intact, their low intensity is preserved, which may be advantageous for differentiation from GBCs. Our results showed that CMML was maintained in all GBPs, except one, according to Reader A. In this case, the gallbladder collapsed and was in close contact with the lesion, which may have resulted in a false positive result. CMML accuracy, PPV, and sensitivity were approximately 82%, ~100%, and 60%, respectively, indicating superiority in PPV and specificity compared with tumour size, including in the reproducibility test. In the TNM classification, T1a, T1b, and T2 represent the invasion of the lamina propria, muscular layer, and perimuscular fibrosis with penetration of the muscle layer, respectively [25]. Therefore, it can be inferred that the poorly defined CMML is seen in T1b and absent in T2. Previous reports show that the loss of normal low-signal intensity of the muscle layer is observed at T1b or higher [17]. Herein, Tis and T1a accounted for 33.3% of lesions (n = 13), which may have reduced the sensitivity. In the reproducibility study, the rate of T1a lesions further increased to 53% (eight lesions), which may have also reduced the sensitivity. Therefore, the absence of CMML would strongly support the diagnosis of GBC yet may be unsuitable for detecting GBC.
NIR-ADC map
The assessment of diffusion restriction has been found valuable for differentiating between benign and malignant tumours, which correlates with the degree of malignancy and prognosis, and some reports state that the evaluation of DWI is helpful in GBC [18-23]. This study is the first to demonstrate the usefulness of the ADC value assessment in distinguishing GBC from GBP in a relatively large number of cases. GBC typically shows a wide range of signal intensities, from hypo- to isointensity on T1WI and iso- to hyperintensity on T2WI [10]. The GBC ADC value is significantly correlated with the T-stage, which is inversely proportional to the ADC value [22]; this may be why NIR-ADC is more useful in terms of specificity, accuracy, and PPV than other sequences. The moderate sensitivity of NIR-ADC may be due to the ADC value correlating with T-stage; this study targeted lesions ≤ T2.
Tumour size, assessment of CMML absence, and measurement of NIR-ADC
Tumour size determination helps in differentiating a GBC from a GBP owing to its high sensitivity and accuracy, and all lesions with size > 25 mm were pathologically proven as a GBC in this study. While many studies have highlighted the utility of 10 mm in differentiating between them [2,9-11], Wennmacker et al. reported that the diagnostic performance of 10 mm was insufficient and that 50% of GBPs met the surgical threshold of 10 mm [12]. In this study, approximately 25% (51/208) of patients with a GBP measured ≥ 10 mm. Tumour size proved beneficial, but the sensitivity and accuracy were reduced in the reproducibility study, where the subject lesions were ≥ 10 mm but not ≤ 25 mm. For both readers, the combination of CMML and NIR-ADC was almost equivalent to tumour size in terms of sensitivity, specificity, or accuracy. This combination may prove valuable in predicting a GBC without relying solely on tumour size measurements, especially in cases such as ≤ 25 mm. Evaluating the addition of CMML to tumour size improved the sensitivity and accuracy compared to tumour size alone or in combination with other findings. The increased sensitivity with almost no decrease in specificity may be due to the high PPV of CMML, although the sensitivity is not as high. This may allow the complementary diagnosis of GBC that is not detected by tumour size alone. In conclusion, assessing the CMML absence and measuring tumour size may help in differentiating GBC from GBP, especially when evaluating lesions ≤ 25 mm.
Study limitations
Our study has some limitations. First, this was a retrospective cohort study conducted at a single institution; thus, the possibility of selection bias could not be ruled out. Second, the sample size of GBCs was not large. Further prospective studies with larger sample sizes that consider our findings are required. Third, we only applied NIR-ADC based on the mean ADC value for this study. Considering the heterogeneity within the tumour and given that the minimum ADC value can theoretically represent the most malignant part if the tumour is a GBC, further studies comparing the mean and minimum ADC values for the differentiation between GBC and GBP should be conducted.
Conclusions
The absence of CMML and NIR-ADC ≤ 1.86 using non-enhanced MRI may contribute to differentiating GBCs from GBPs ≥ 10 mm. Moreover, evaluation of CMML absence, in addition to measuring tumour size, could aid in distinguishing GBCs from GBPs, especially of lesion size ≤ 25 mm, compared to measuring tumour size alone. Preoperative differentiation using these findings may contribute to determining the most appropriate surgical strategies and preventing secondary causes of peritoneal dissemination due to the unexpected occurrence of bile leakage during surgery.