


Introduction
Dual-energy computed tomography (DECT) can be used to discriminate tissues and characterize tissue composition based on the principle that materials have different attenuations at different energies. Clinically, it is applied for the automatic characterization of kidney stones, visualization of lung perfused blood volume and ventilation, and automatic removal of bone [1-5]. DECT can be used to obtain the electron density, effective atomic number, and monochromatic computed tomography (CT) number by exploiting the attenuation differences in tissues to improve material decomposition [6,7]. In our previous study, we developed a material decomposition system for contrast agents using DECT [8,9]. Thus, DECT has been increasingly used in the clinical setting to improve the accuracy of lesion detection.
Prior studies have evaluated the image quality of DECT using phantom scans, simulations, and patients [10-15]. However, radiation dose in DECT is a problem because DECT uses two X-ray tubes with different tube voltages. Some groups have compared the radiation dose of DECT and conventional single-energy CT (SECT) [16,17]. Reportedly, the dose in DECT was nearly 2 times higher than that in SECT. In DECT, the tube currents of both the tubes are adapted to achieve comparable noise levels. Moreover, bow-tie filters shape the photon beam and reduce beam hardening and the radiation dose [18]. The energy mass absorption coefficient and the ratio of the beam pulse for each energy level used in DECT are required to derive the radiation dose. The difference in the energy mass absorption coefficient owing to the tube voltages and the type of bow-tie filters affect the uncertainty of the dose measurement in DECT. The energy absorption coefficient and electric current or charge must be measured to calculate the imaging dose.
The objectives of the current study were to evaluate the difference in the energy mass absorption and absolute dose due to the tube voltages and bow-tie filters in DECT.
Material and methods
DECT scans were performed with a Revolution CT scanner (GE Healthcare, Princeton, NJ, USA), which is a single-source scanner with kV switching. The tube voltages were set to 80 kV, 120 kV, and 140 kV and exposure to 150 mA using the sequential scan mode.
Effective energy
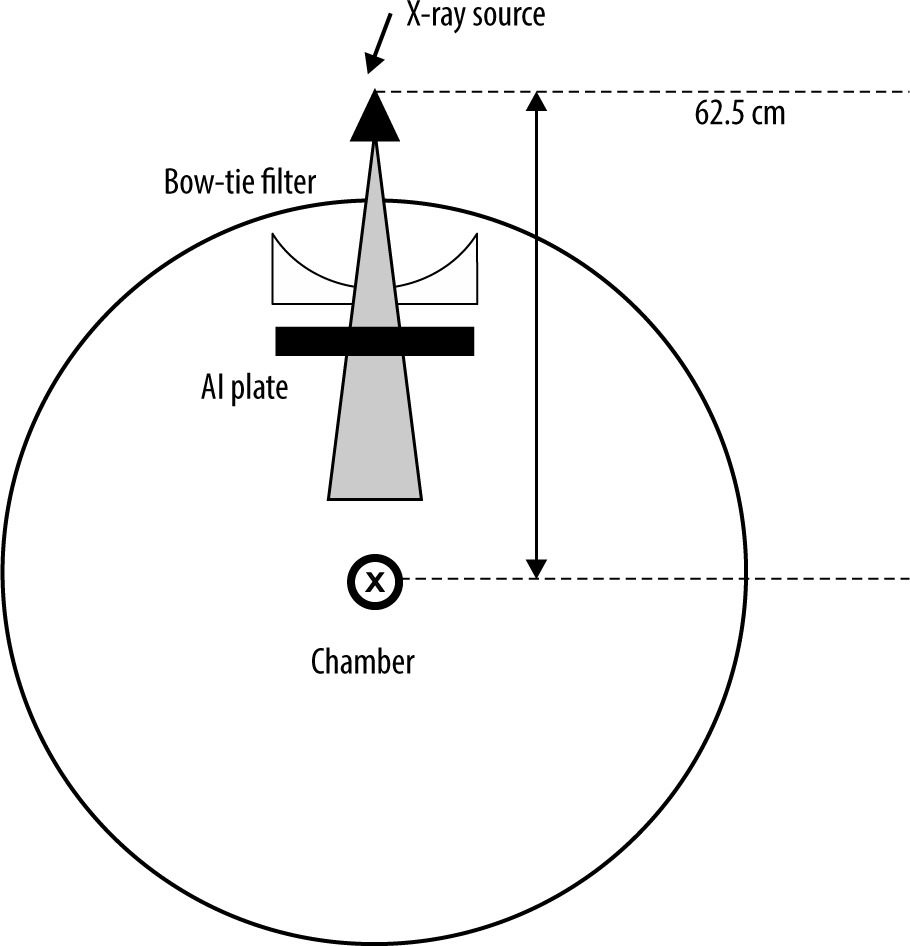
The effective energy was obtained from the half-value layer (HVL) of aluminium (Al). The experimental setup for this measurement is shown in Figure 1. The beam collimation was set to 8 × 0.625 mm. The chamber, which is a 0.6 cc farmer-type air ionization chamber (PTW 30013), is located at the isocentre. The amount of charge was measured by varying the thickness of the aluminium plate where the tube was stationary. The HVL was measured for the tube voltages in DECT, which were 80 kV and 140 kV, and in conventional SECT, which was 120 kV. DECT can be used to select small and large bow-tie filters. The difference in the HVL between the small and large bow-tie filters was also evaluated. The effective energies were calculated using the basic data from Selzer and Hubbell [19].
Chamber correction factor and absolute dose measurement
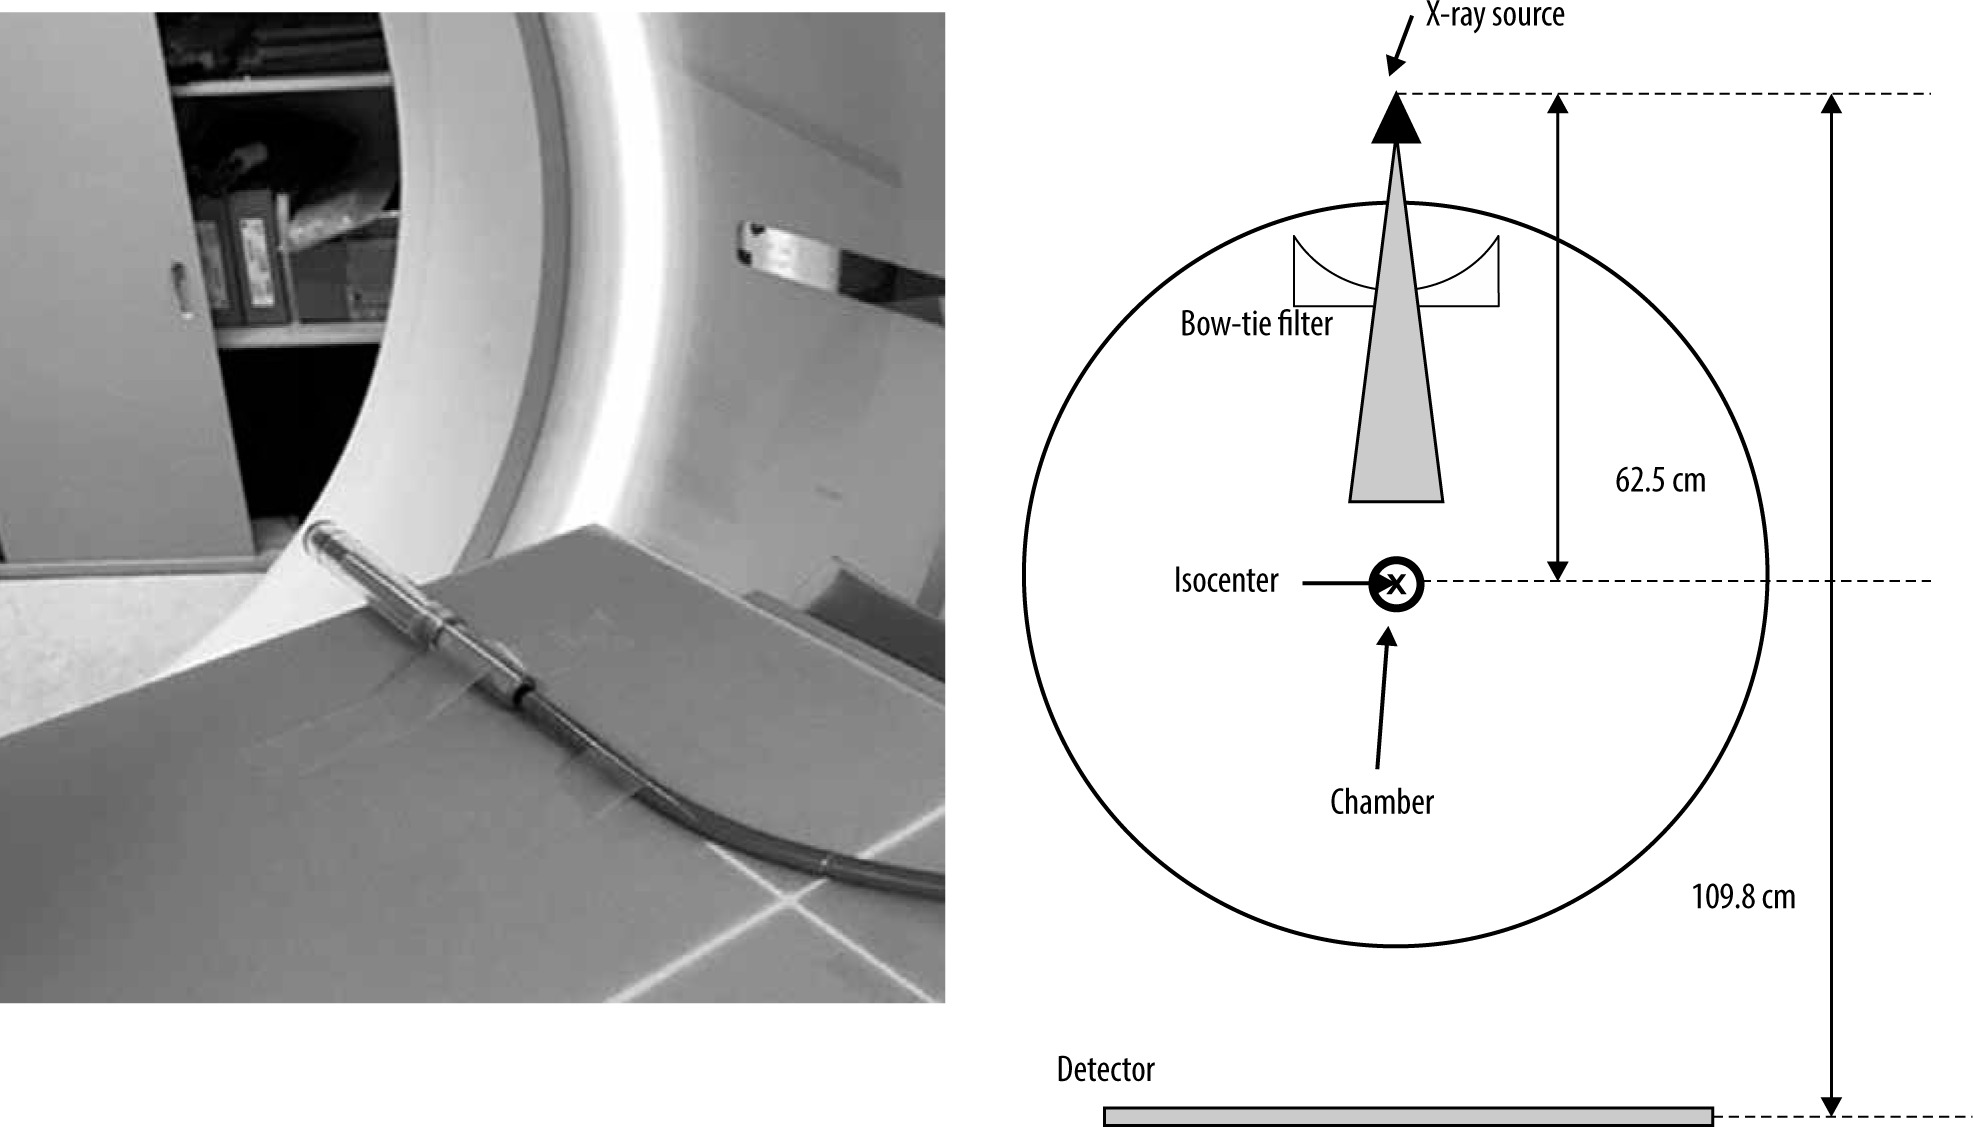
A schematic diagram of the measurement setup is shown in Figure 2. The chamber is located at the isocenter. The small and large bow-tie filters were used, and the beam collimation was set to 256 × 0.625 mm. The effective energy was obtained from the HVL. The absorbed dose to water () was derived as follows:
where is the air-kerma calibration factor for a given beam quality; , the chamber reading measured in the farmer chamber with the build-up cap at the isocentre; , the water-to-air ratio of the mean mass energy-absorption coefficients averaged over the incident X-ray spectrum; and , the backscattering factor, which was defined in a previous study [20]. The absorbed dose was calculated for the tube voltages in DECT, which were 80 kV and 140 kV, and in conventional SECT, which was 120 kV, with the large and small bow-tie filters, using equation (1).
Dose profile with the bow-tie filters
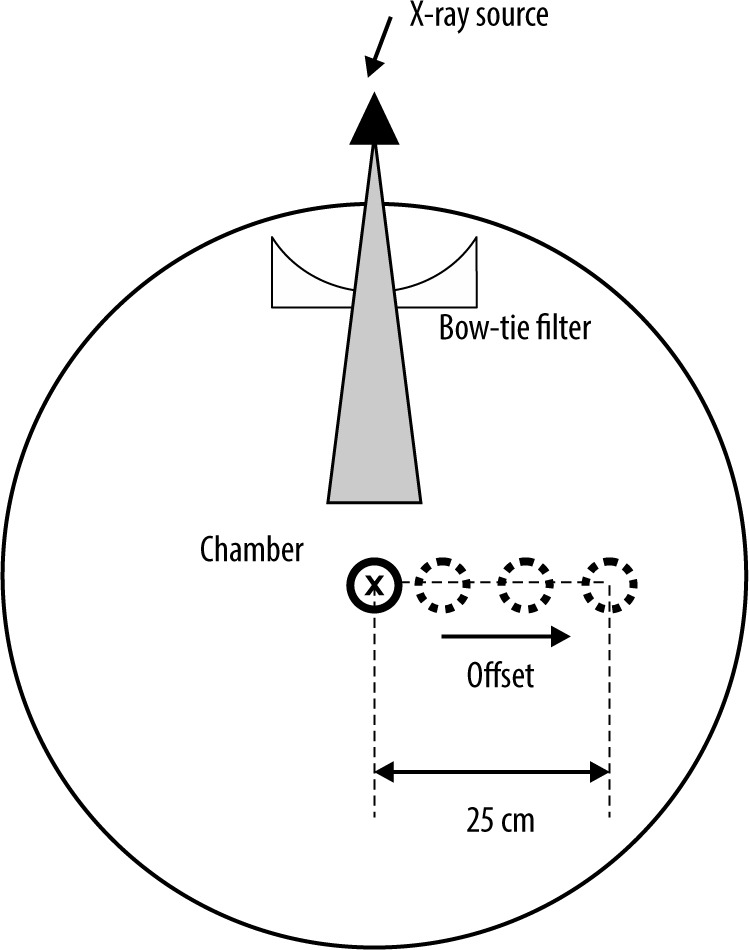
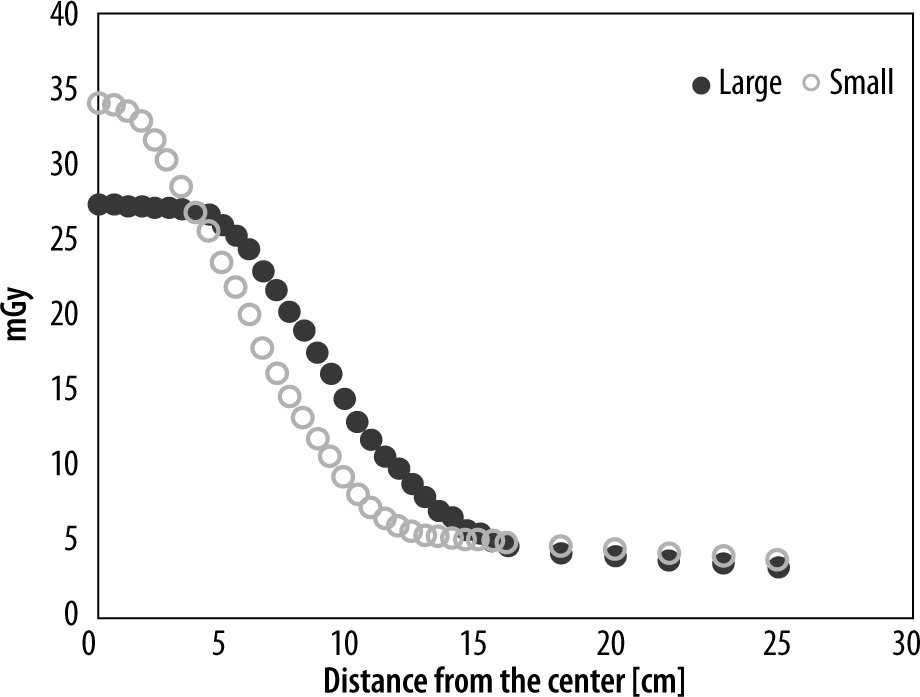
The off-centre ratio (OCR) in the air was measured, as shown in Figure 3. The small and large bow-tie filters were used, and the beam collimation was set to 256 × 0.625 mm. The OCR profile covered by the half-fan beam was measured up to a distance of 25.0 cm from the isocentre in 5-10-mm intervals along the vertical axis across the fan beam at 120 kV. OCRs were compared between the large and small bow-tie filters.
Results
HVL, effective energy, and water-to-air ratio of the mean mass energy-absorption coefficients
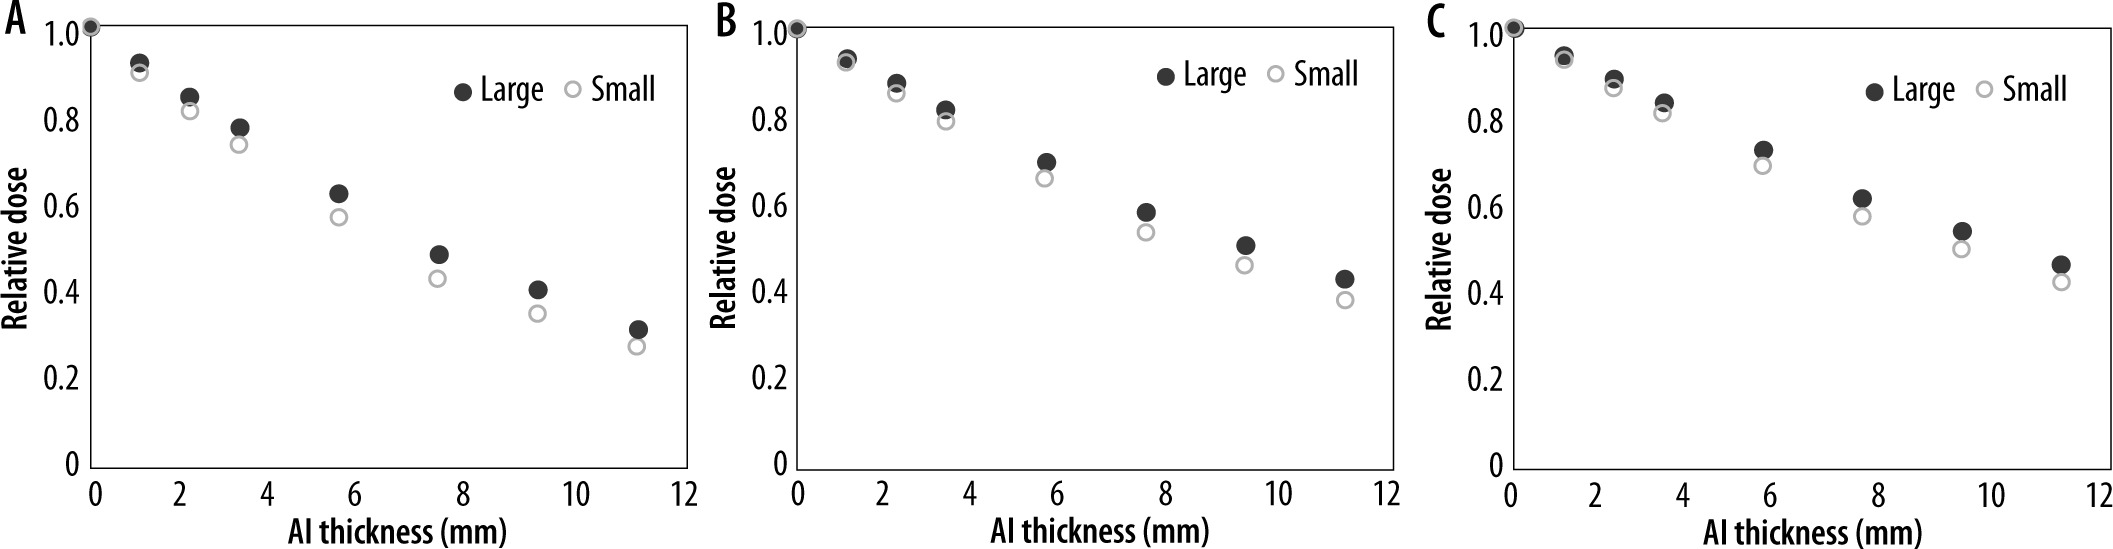
Figure 4 shows the correlation between the relative dose and the thickness of the aluminium plate at 80 kV, 120 kV, and 140 kV. The HVL, effective energy, and water-to-air ratio of the mean mass energy-absorption coefficients are listed in Table 1. The HVL and effective energy were higher at higher tube voltages. The difference in the water-to-air ratio of the mean mass energy-absorption coefficients at 80 kV and 140 kV was 2.0% for the small bow-tie filter and 3.0% for the large bow-tie filter. The difference in the water-to-air ratio of the mean mass energy-absorption coefficients at 80 kV and 120 kV was 0.6% for the small bow-tie filter and 0.6% for the large bow-tie filter. The difference in the water-to-air ratio of the mean mass energy-absorption coefficients at 120 kV and 140 kV was 1.4% for the small bow-tie filter and 2.1% for the large bow-tie filter. The HVL and effective energy with the large bow-tie filter were higher than those with the small bow-tie filter for all the tube voltages. The difference in the water-to-air ratio of the mean mass energy-absorption coefficients with the large and small bow-tie filters was within 1.0% for all the tube voltages.
Table 1
Half-value layer (HVL), effective energy, and the water-to-air ratio of the mean mass energy-absorption coefficients
| Parameter | 80 kV | 120 kV | 140 kV | |||
|---|---|---|---|---|---|---|
| Bowtie filter | Large | Small | Large | Small | Large | Small |
| Al HVL [mm] | 7.08 | 6.09 | 9.20 | 8.13 | 10.0 | 8.96 |
| Effective energy [keV] | 48.5 | 46.8 | 56.9 | 52.3 | 59.7 | 55.9 |
| 1.02 | 1.02 | 1.04 | 1.03 | 1.05 | 1.04 | |
Absolute dose difference due to bow-tie filters
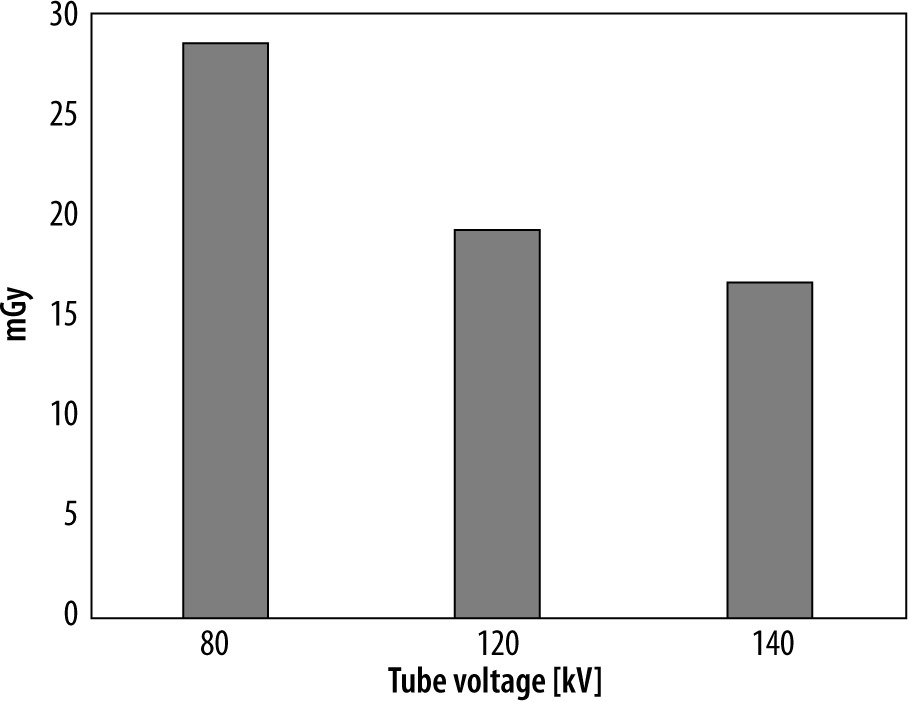
Figure 5 shows the comparison of OCR profiles between the large and small bow-tie filters in the air. The centre dose was higher with the small bow-tie filter than with the large bow-tie filter. However, the penumbra was larger with the large bow-tie filter than with the small bow-tie filter. Table 2 shows the absorbed dose with the large and small bow-tie filters at 80 kV, 120 kV, and 140 kV. Figure 6 shows the dose difference between the large and small bow-tie filters at the isocentre, which was larger at the lower tube voltages.
Discussion
DECT uses different tube voltages, allowing material characterization based on differences in the material and tissue attenuation. The current study evaluated the difference in effective energy between low and high tube voltages in DECT.
The HVL and effective energy were significantly higher at higher tube voltages. The American Association of Physicists in Medicine Task Group 61 report showed that the uncertainty of the water-to-air ratio of the mean mass energy-absorption coefficients was 1.5% in kV X-ray beams [21]. In the current study, the difference in the water-to-air ratio for the mean mass energy-absorption coefficients at 80 kV and 140 kV was 2.0% with the small bow-tie filter and 3.0% with the large bow-tie filter. These differences were larger than the uncertainty in the absolute dose measurement.
The ratio of the dose at 80 kV and 140 kV X-ray beams cannot be measured separately in clinical DECT measurements. The uncertainty of the absorbed dose measurement due to energy dependence can be reduced by 1.4% with the small bow-tie filter and 2.1% with the large bow-tie filter using the water-to-air ratio of the mean mass energy-absorption coefficients at 120 kV. Moreover, Raudabaugh et al. investigated the internal dose with a metal-oxide-semiconductor field-effect transistor (MOSFET) dosimeter in DECT [21]. They evaluated the dose equivalence between the MOSFET and an ion chamber [22] and calculated a linear attenuation coefficient using a simple relation by directly measuring the HVL of the combined dual-energy beams. The Monte Carlo calculation is another method to reduce the energy dependence of DECT. It is a powerful tool for examining the impact of different energy beams and an individual’s anatomy on patient dose [22].
The effect of differences in the bow-tie filter on the dose measurement was small for all the tube voltages. Thus, the same mass energy-absorption coefficient can be used for dose measurements for both large and small bow-tie filters. However, the dose difference at the isocentre between the large and small bowtie filters was higher at lower tube voltages. The photon energy is decreased by the bow-tie filter, which causes beam hardening. The beam hardening is higher with lower photon energy and reduces the absorbed dose. The limitation of the current study was the relationship between image quality and the absorbed dose in DECT. Further studies must be performed to evaluate the image quality and organ dose using the dose measurement with reduced uncertainty in DECT.
Conclusion
In the current study, the difference in the mass energy absorption was small (within 1.0%). The uncertainty of the absolute dose was increased by 3.0% using mass-energy absorption with either a low or high tube voltage in DECT. The uncertainty of mass-energy absorption due to energy dependence can be decreased by using the average effective energy with dual-energy beams.