


Introduction
Skull base osteomyelitis (SBO) is a potentially life-threatening infection of the skull base, typically caused by an insufficiently treated ear infection in patients with diabetes, older age, or immunosuppression [1,2]. To date, there is no definitive consensus on the optimal imaging modality for determining the treatment response in patients with SBO [3]. In clinical practice, computed tomo-graphy (CT) and magnetic resonance imaging (MRI) are frequently implemented to determine a patient’s treatment response [4]. A major limitation of these diagnostic tools is that abnormal imaging findings can remain visible on later follow-up imaging even though the patient has experienced an improvement in their symptoms [5,6]. 18Fluorodeoxyglucose (FDG)-PET has utility in determining and monitoring treatment response in patients with SBO [7]; however, this tool is typically used less frequently than CT or MRI scans in clinical practice [4] due to the limited access and high cost. Dynamic contrast-enhanced MRI (DCE-MRI) is a perfusion imaging technique using contrast media, which has proven to offer significant benefits in the evaluation of patients’ treatment responses for head and neck tumours [8-10]. An apparent diffusion coefficient (ADC) map obtained from diffusion-weighted images (DWI) is reported to show a qualitative decrease in signal intensity in accordance with the treatment response of SBO [11]. To date, there have been no studies using these quantitative permeability parameters calculated from DCE-MRI and ADC derived from DWI to determine treatment response in patients diagnosed with SBO. The purpose of this study is to investigate the applicability of DCE-MRI quantitative parameters and ADC as a marker for the evaluation of treatment response in patients with SBO.
Material and methods
This retrospective study obtained exemption from our Institutional Review Board, and patient consent was waived. All procedures followed were in accordance with Helsinki Declaration.
Patients
Patients diagnosed with SBO, who underwent both pre-treatment and post-treatment DCE-MRI and diffusion-weighting imaging (DWI) between December 2015 and August 2022 were included. Individuals with a clinical diagnosis were considered patients with SBO. Patients with no evidence of recurrence at the time of post-treatment MRI imaging were included. We excluded 8 patients who had previously been treated with surgery or radiation therapy for tumours proximal to the skull base.
MRI acquisition
Magnetic resonance imaging examinations were performed using 1.5 T and 3 T Philips MRI systems (Ingenia, Achieva, Philips Healthcare, Amsterdam, Netherlands), and 1.5 T and 3 T Siemens MRI systems (Magnetom Sola, Magnetom Vida, Siemens Medical Solutions, Erlangen, Germany). Diffusion-weighting imaging was performed with b-values of 0 and 1000 s/mm2 and the following parameters: TR range, 3500-8000 ms; TE range, 58-90 ms; number of excitations, 1; slice thickness, 4-5 mm; field of view, 230-270 × 230-260 mm; matrix, 130-180 × 130-180; and 3 diffusion directions. DCE-MRI scans were performed via three-dimensional, T1-weighted, fast field echo with the following parameters: TR, 3-4.8 ms; TE, 1.4 ms; flip angles, 10-30°; slice thickness, 4-5 mm; field of view, 250-280 × 240-250 mm; matrix, 190-240 × 140-240; number of excitations, 1; number of slices per dynamic scan, 48; temporal resolution, 8.8 s; and total acquisition time, 4 min and 24 s. An intravenous bolus of 20 ml gadobenate dimeglumine contrast (Multihance, Bracco Diagnostics, Milan, Italy) was administered through a peri-pheral arm vein using a power injector with a flow rate of 5.0 ml/s, followed by a 20 ml saline flush.
ADC analysis
Apparent diffusion coefficient maps were constructed by a mono-exponential fitting model using OleaSphere (Version 3.0; Olea Medical, La Ciotat, France). Two board-certificated radiologists with 9 and 13 years of experience outlined 3 separate ROIs on the ADC maps, predominantly including the low signal region while excluding necrotic regions from ROIs with consensus. The 3 ROIs in the lesion were outlined in the same cross-sections. The ROI of SBO was set in the affected soft tissue inferior to the skull base, according to a previous study that considered reasons such as the imaging findings of SBO being more pronounced in the adjacent soft tissue than in the bone marrow of the skull base, and susceptibility artifacts being more pronounced within the bone [12]. The post-treatment ROIs positions were set to be as close as possible to the pre-treatment ROIs in accordance with image changes such as lesion shrinkage. Another ROI was placed as a reference in the spinal cord, which was included in the same field of view [13]. For each ROI, the normalized mean ADC (nADCmean) was calculated by dividing the mean ADC by the reference mean ADC of the spinal cord. The nADCmean of 3 ROIs was averaged.
DCE analysis
Quantitative DCE-MRI analyses were performed using OleaSphere (Version 3.0; Olea Medical, La Ciotat, France) based on the extended Tofts model, by which pixel-based parameter maps were calculated from time-intensity curves (TICs). An arterial input function was calculated automatically using cluster analysis techniques, and deconvolution of the arterial input function was performed with a time-insensitive block-circulant singular-value decomposition [14]. The 2 board-certified radiologists with 9 and 13 years of experience outlined 3 separate ROIs in the lesions on permeability maps, predominantly including the enhancing components while excluding necrotic regions from the ROIs with consensus. The ROI of the SBO was set in the affected soft tissue inferior to the skull base and in the already described ADC analysis. Another ROI was placed as a reference in the muscle tissue, which was included in the field of view. The calculated quantitative vascular permeability parameters were as follows: fraction of the extravascular extracellular space (Ve), fraction of blood plasma (Vp), rate of transfer from the blood plasma into the extravascular extracellular space (Ktrans), and backflow leakage of material from the extravascular extracellular space into the blood plasma (Kep). For each ROI, normalized DCE-MRI parameters (nVe, nVp, nKtrans, and nVp) were calculated by dividing the mean value within the ROI placed in the lesion by the mean value within the reference ROI placed in the muscle tissue. The values of normalized DCE-MRI quantitative parame-ters of the 3 ROIs were averaged.
Statistical analysis
Shapiro-Wilk tests were performed to confirm the normality of distribution in each numerical parameter. The Wilcoxon signed rank test was used to compare normalized DCE-MRI quantitative parameters and nADCmean between pre- and post-treatment periods of patients with SBO. Two-sided p-values < 0.05 were considered statistically significant. All statistical analyses were performed using R version 3.6.1 (R Foundation for Statistical Computing, Vienna, Austria). In addition, we conducted multiplecomparison correction using the Bonferroni method.
Results
Six patients (five men, one woman) with SBO were included in this study. The mean age was 73.5 years (ages range, 60-85 years). Four patients displayed complicated ear lesions, and one had parotid lesions. Furthermore, two patients had diabetes mellitus. Pathological assessments demonstrated inflammatory changes in five cases. A culture of Pseudomonas aeruginosa was found in one case, one patient was treated with debridement and antibiotics, and five patients received antibiotic therapy alone. Post-treatment MRIs were performed on average 438.7 days (range, 66-1567 days) after the start of treatment.
DCE-MRI and ADC parameters
The results of DCE-MRI and ADC analyses are summarized in Table 1. A pulsed input pattern was observed in the arterial input function curves in all patients. nVe of the post-treatment status of SBO was significantly lower than the pre-treatment status (median [range], 2.62 [1.45-5.5] vs. 0.72 [0.41-2.09], p = 0.03), and nADCmean of the post-treatment status of SBO was significantly lower than the pre-treatment status (median [range], 1.91 [1.39-3.21] vs. 1.19 [0.83-1.35], p = 0.03). These results were significant before the multiple-comparison correction, but they did not survive the multiple-comparison correction. In nVp and nKtrans, and nKep, there was no significant difference between the pre- and post-treatment status (p = 0.56, 0.31, and 0.69, respectively). Representative MRI images of patients with pre- and post-treatment status of SBO are demonstrated in Figures 1 and 2.
Table 1
Normalized DCE-MRI and ADC parameters
DCE-MRI – dynamic contrast-enhanced magnetic resonance imaging, ADC – apparent diffusion coefficient, nVe – normalized fraction of the extravascular extracellular space, nVp – normalized fraction of blood plasma, nKtrans – rate of transfer from the blood plasma into the extravascular extracellular space, nKep – backflow leakage of material from the extravascular extracellular space into the blood plasma, nADCmean – normalized mean apparent diffusion coefficient
Figure 1
Pre- and post-treatment magnetic resonance imaging (MRI) in a 71-year-old male with skull base osteomyelitis. Pre-treatment post-contrast, fat-suppressed, T1-weighted image (A) shows an enhancing lesion centred in the left side of the skull base/nasopharynx (arrows), dynamic contrastenhanced MRI (DCE-MRI) (B, Ve) shows increased parameters (arrowheads) with normalized Ve of 5.50, and the ADC map (C) shows high apparent diffusion coefficient (ADC) (dotted arrows) with normalized ADC of 1.96. After treatment, the post-contrast, fat-suppressed, T1-weighted image (D) demonstrates slight reductions in size and residual enhancement (arrows), but DCE-MRI (E, Ve) demonstrates reduced parameters (arrowheads) of normalized Ve of 0.69. Additionally, the ADC map showed decreased ADC (dotted arrows) with a normalized ADC of 1.09
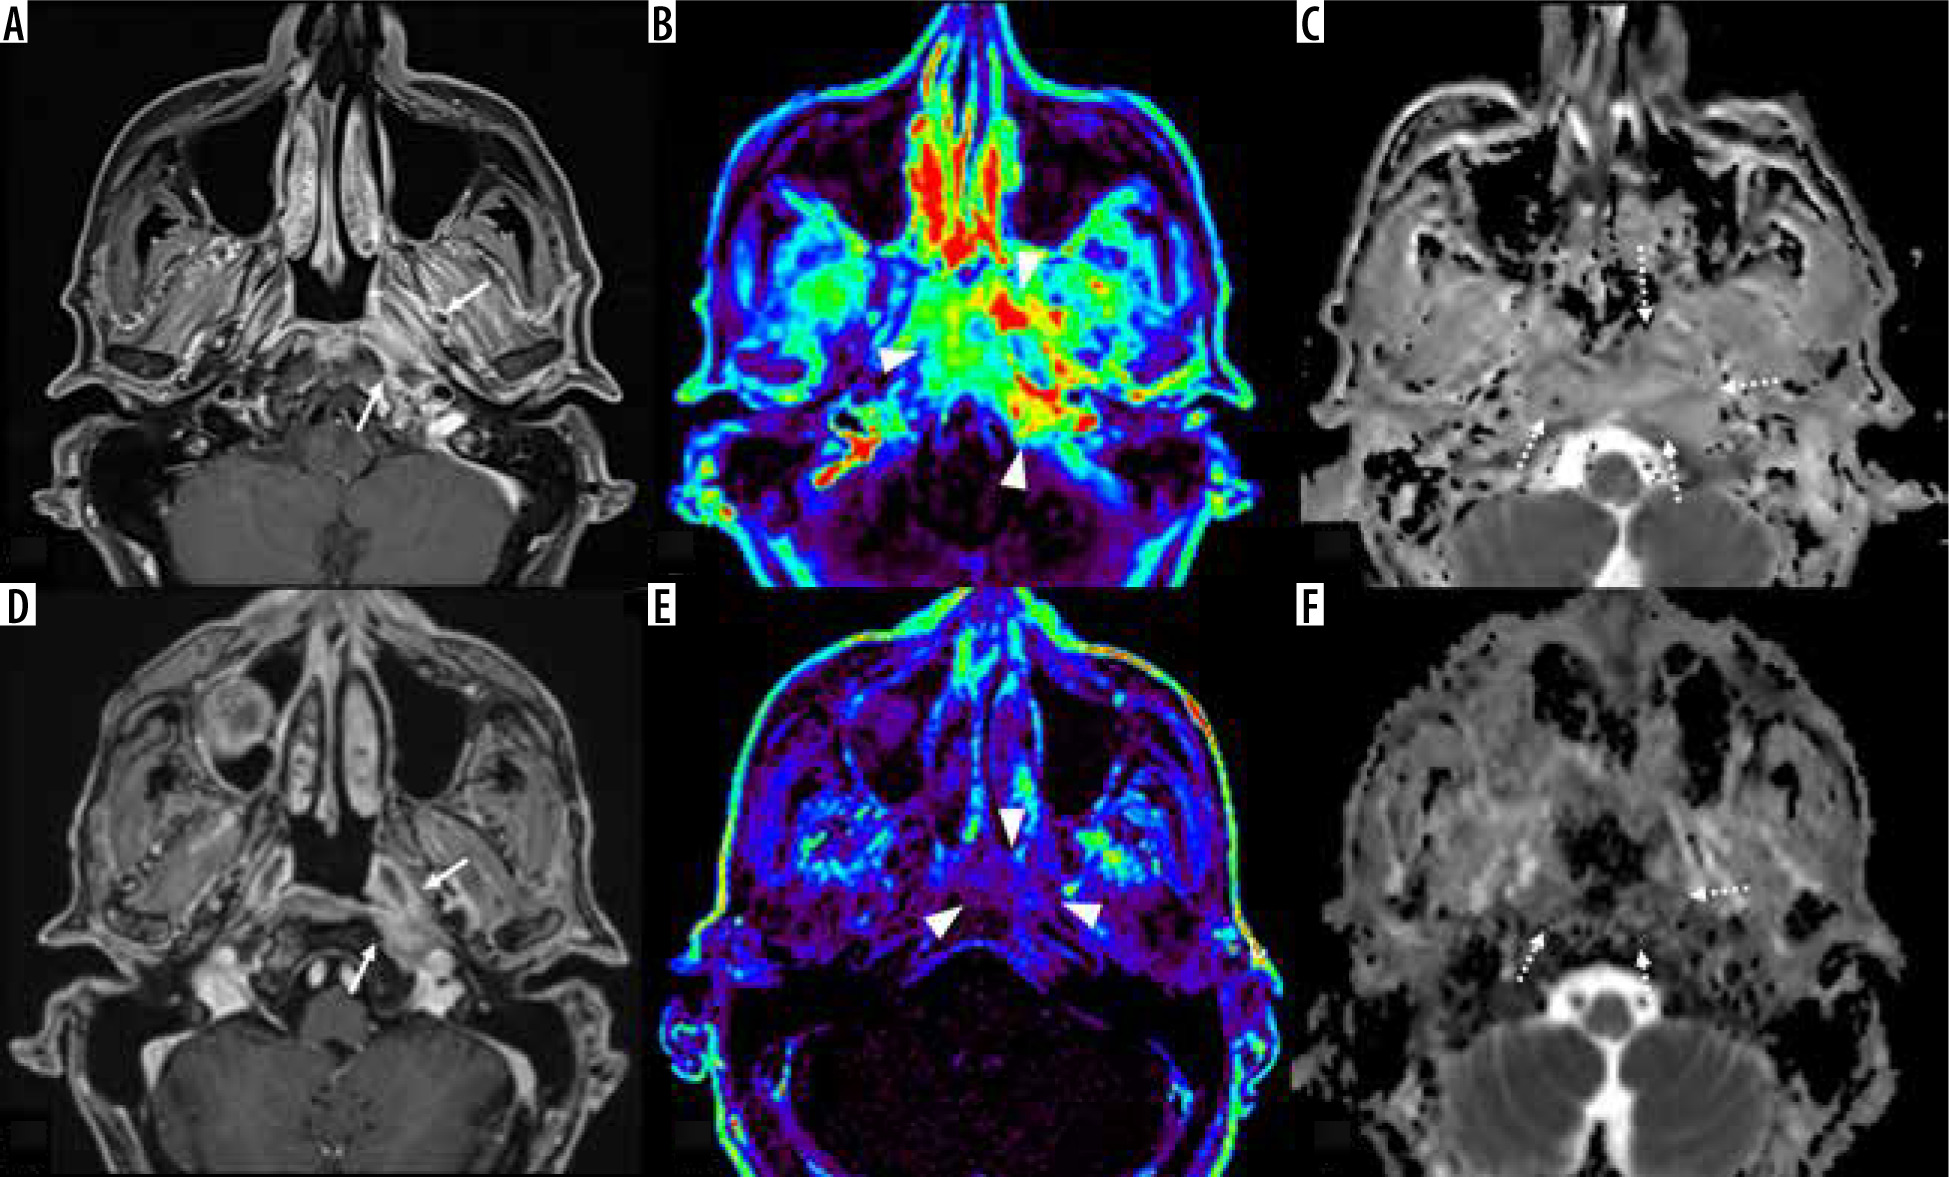
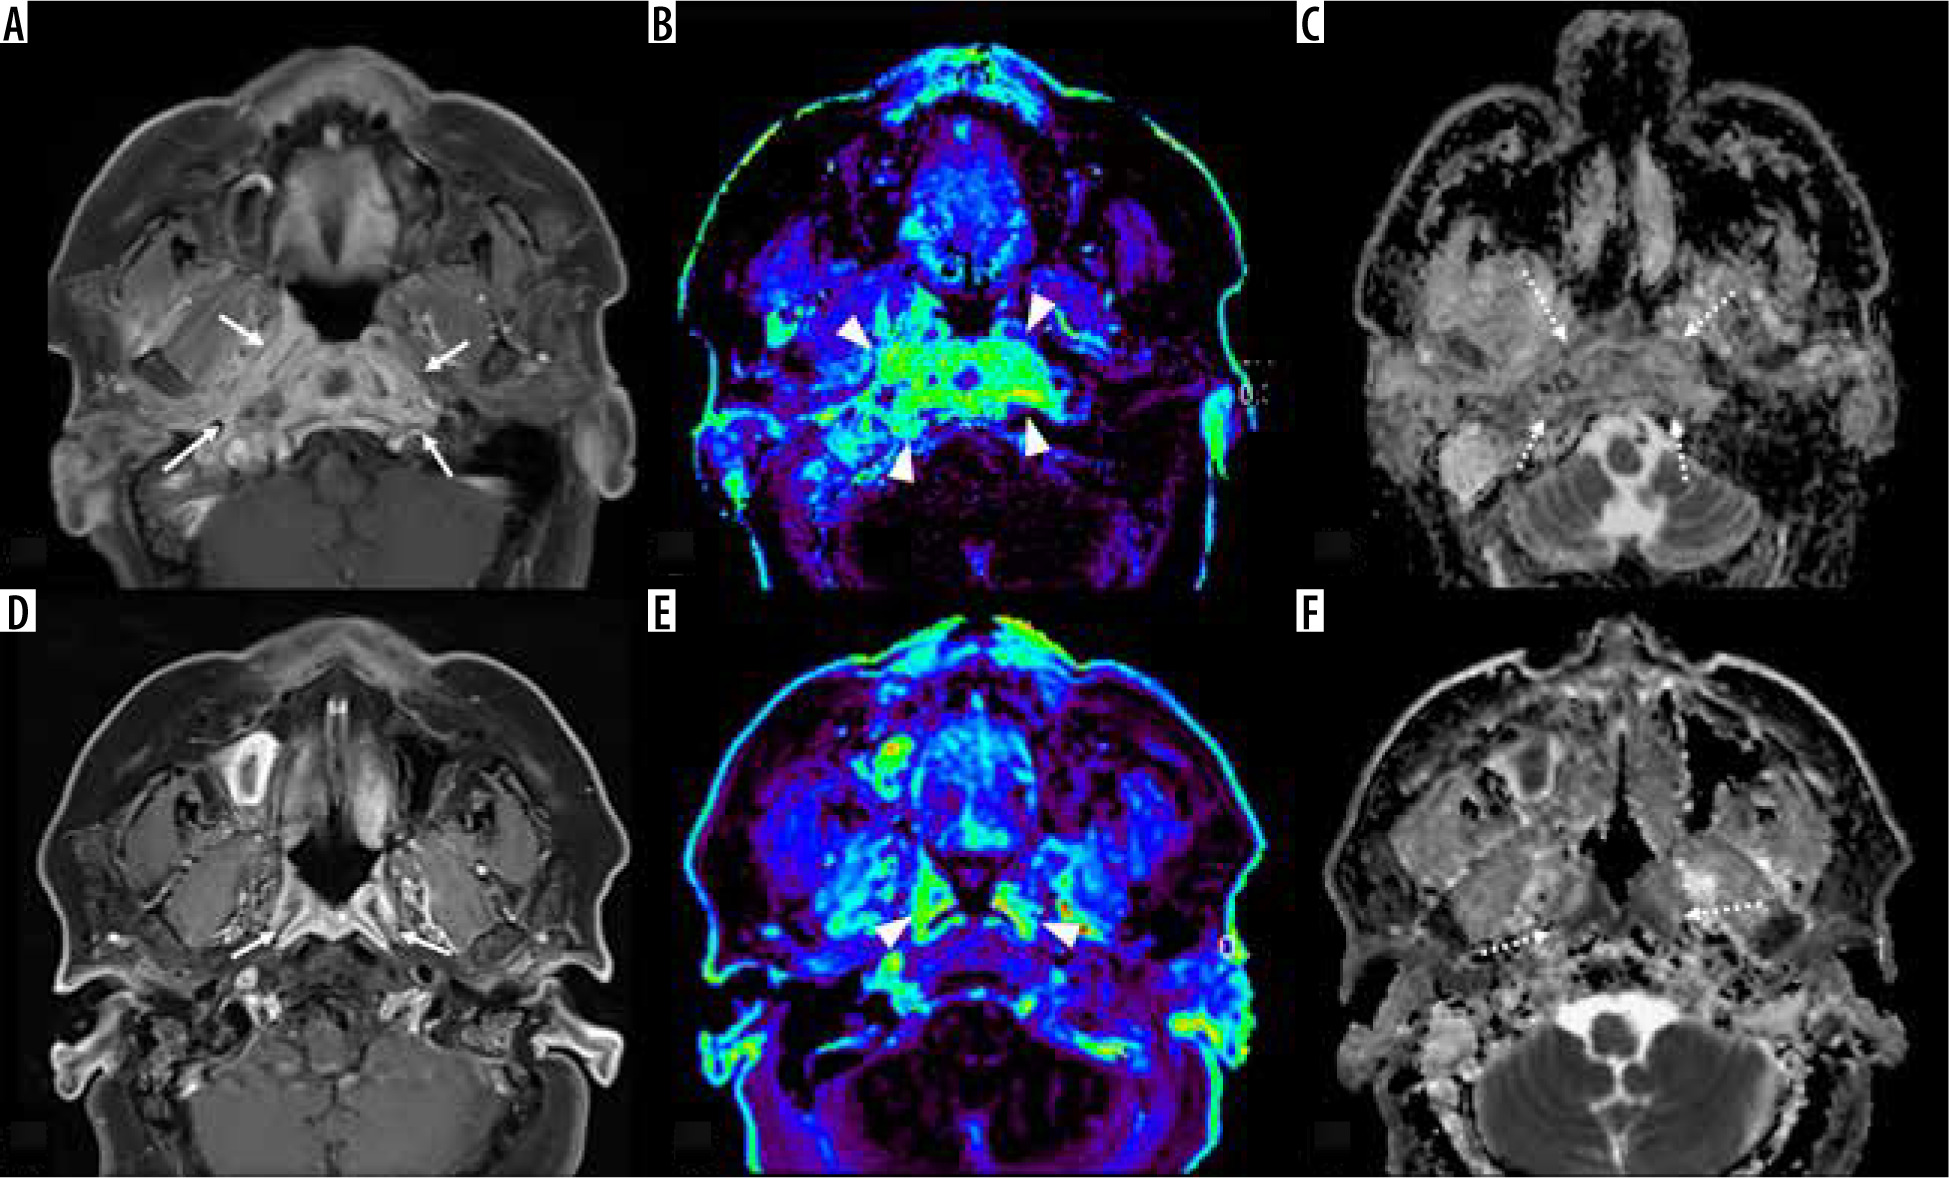
Figure 2
Pre- and post-treatment magnetic resonance imaging (MRI) in a 60-year-old female with skull base osteomyelitis. During pre-treatment the post-contrast, fat-suppressed, T1-weighted image (A) shows enhancing lesion centred on the skull base/nasopharynx (arrows), dynamic contrastenhanced MRI (DCE-MRI) (B, Ve) shows increased parameters (arrowheads) with normalized Ve of 2.41, and the ADC map (C) shows high apparent diffusion coefficient (ADC) (dotted arrows) with normalized ADC of 1.85. After treatment, the post-contrast, fat-suppressed, T1-weighted image (D) showed reductions in size and residual enhancement (arrows), but DCE-MRI (E, Ve) demonstrates reduced parameters (arrowheads) of normalized Ve of 0.58. Additionally, the ADC map shows decreased ADC (dotted arrows) with a normalized ADC of 0.83
Discussion
This study evaluated the characteristics and differences in the normalized quantitative parameters from DCE-MRI and normalized ADC values derived from DWI between patients with pre- and post-treatment of SBO. Overall, nVe and nADCmean showed significant differences when comparing the pre- and post-treatment periods among SBO patients.
Skull base osteomyelitis is an infection centred on the skull base, which is primarily treated with antibiotics and complementary surgery [1]. To date, major advances in treatment protocols and improved imaging techniques have contributed to increased overall survival rates in patients with SBO [1]. However, there is still no definitive consensus on the optimal imaging modality for evaluating the patient’s treatment response and disease management.
Magnetic resonance imaging is an excellent imaging technique for assessing the anatomical localization and extent of the soft tissue components of the SBO and is frequently used in clinical practice [4]. Follow-up MRIs among patients with SBO can monitor changes in fat tissue, abnormal bone marrow signals, and inflammatory oedematous changes; however, MRIs are prone to retain abnormal imaging findings, especially in the bone marrow, on later follow-up imaging, despite the patient experiencing symptom improvement [15,16]. Therefore, the reliability of MRI may not always be high. 18F-FDG PET is well suited for monitoring SBO recovery because this technique continuously assesses tissue activity and FDG uptake of the lesion and leads to less imaging delay along with decreased inflammation [17]. As mentioned above, although this technique offers benefits over the standard imaging techniques, it is not used in routine practice as frequently as CT or MRI [4].
Apparent diffusion coefficient derived from DWI on MRI was high in the pre-treatment period among patients with SBO and decreased in conjunction with treatment responses, and ADC was evaluated qualitatively in a previous article, rather than quantitatively [11]. In line with the previous research, the current study showed a significantly quantitative decrease in ADC values after treatment compared to pre-treatment status. The possibility that ADC values may have utility as a quantitative marker for determining the treatment response in patients with SBO patients offers significant benefits for improving monitoring and treatment administration. Future studies are encouraged to examine this association in a larger cohort of patients with SBO to help elucidate this mechanism. Dynamic contrast-enhanced perfusion MRI is a technique that can provide tissue perfusion and vascularization. DCE-MRI can provide quantitative parameters such as Vp, Ve, Ktrans, and Kep, which are related to the transfer of contrast from the intravascular to the extracellular space. There have been results of previous studies showing that histological post-radiotherapy changes of head and neck tumours correlate with parameters calculated from DCE-MRI [8]. Parameters such as Ve and Ktrans were significantly lower after chemoradiotherapy of oral cancer [9]. Additionally, parameters such as Ktrans of benign post-treatment changes of head and neck cancer have been typically lower than recurrence [10]. These studies demonstrate that the quantitative parameters of DCE-MRI may play a role as imaging markers in determining the treatment response of head and neck tumours. The usefulness of DCE-MRI parameters in patients with pre- and post-treatment status of SBO has not been previously reported. In the current study, one of the DCE-MRI parameters, normalized Ve, was significantly decreased after treatment of SBO. Because Ve is a fraction of extravascular space and reflects the percentage of contrast agent that exists mainly in the extracellular and extracellular space, the value may have decreased with the suppression of inflammation in the SBO. Thus, Ve, one of the DCE-MRI parameters, can be a quantitative treatment response marker that can act as a surrogate for SBO activity. Because DCE-MRI parameters are not guaranteed to always be reliable with different protocols and MRI vendors [18], normalized DCE-MRI parameters were applied in this study to compensate for this limitation. Normalized data should provide highly reproducible results at many other institutions that employ DCE-MRI techniques.
There are several limitations to this study. Firstly, this was a preliminary retrospective study conducted at a single centre with a limited number of patients. Secondly, there was no reliable FDG-PET validation or comparison of SBO activity among the patients in our study. Thirdly, the lack of a control population with unresolved SBO precluded the comparison of post-treatment parameters between the cases in this study and those with unresolved lesions. Fourthly, due to the small number of cases with follow-up MRI imaging in this study, it was difficult to confirm whether quantitative evaluations such as DCE-MRI parameters and ADC indicated the need for continued treatment. Future large-scale studies are warranted. Fifthly, MRI scanners from different manufacturers and with different magnetic field strengths were used for image acquisition, which may have caused heterogeneity in the study. However, the normalization of DCE-MRI parameters and ADC may have minimized the risk of parameter heterogeneity. Lastly, although the difference in DCE-MRI parameters Ve and ADC between pre- and post-treatment were significant before the multiple-comparison correction, they did not survive the multiple-comparisons correction. Therefore, our results should be interpreted with caution.