


Introduction
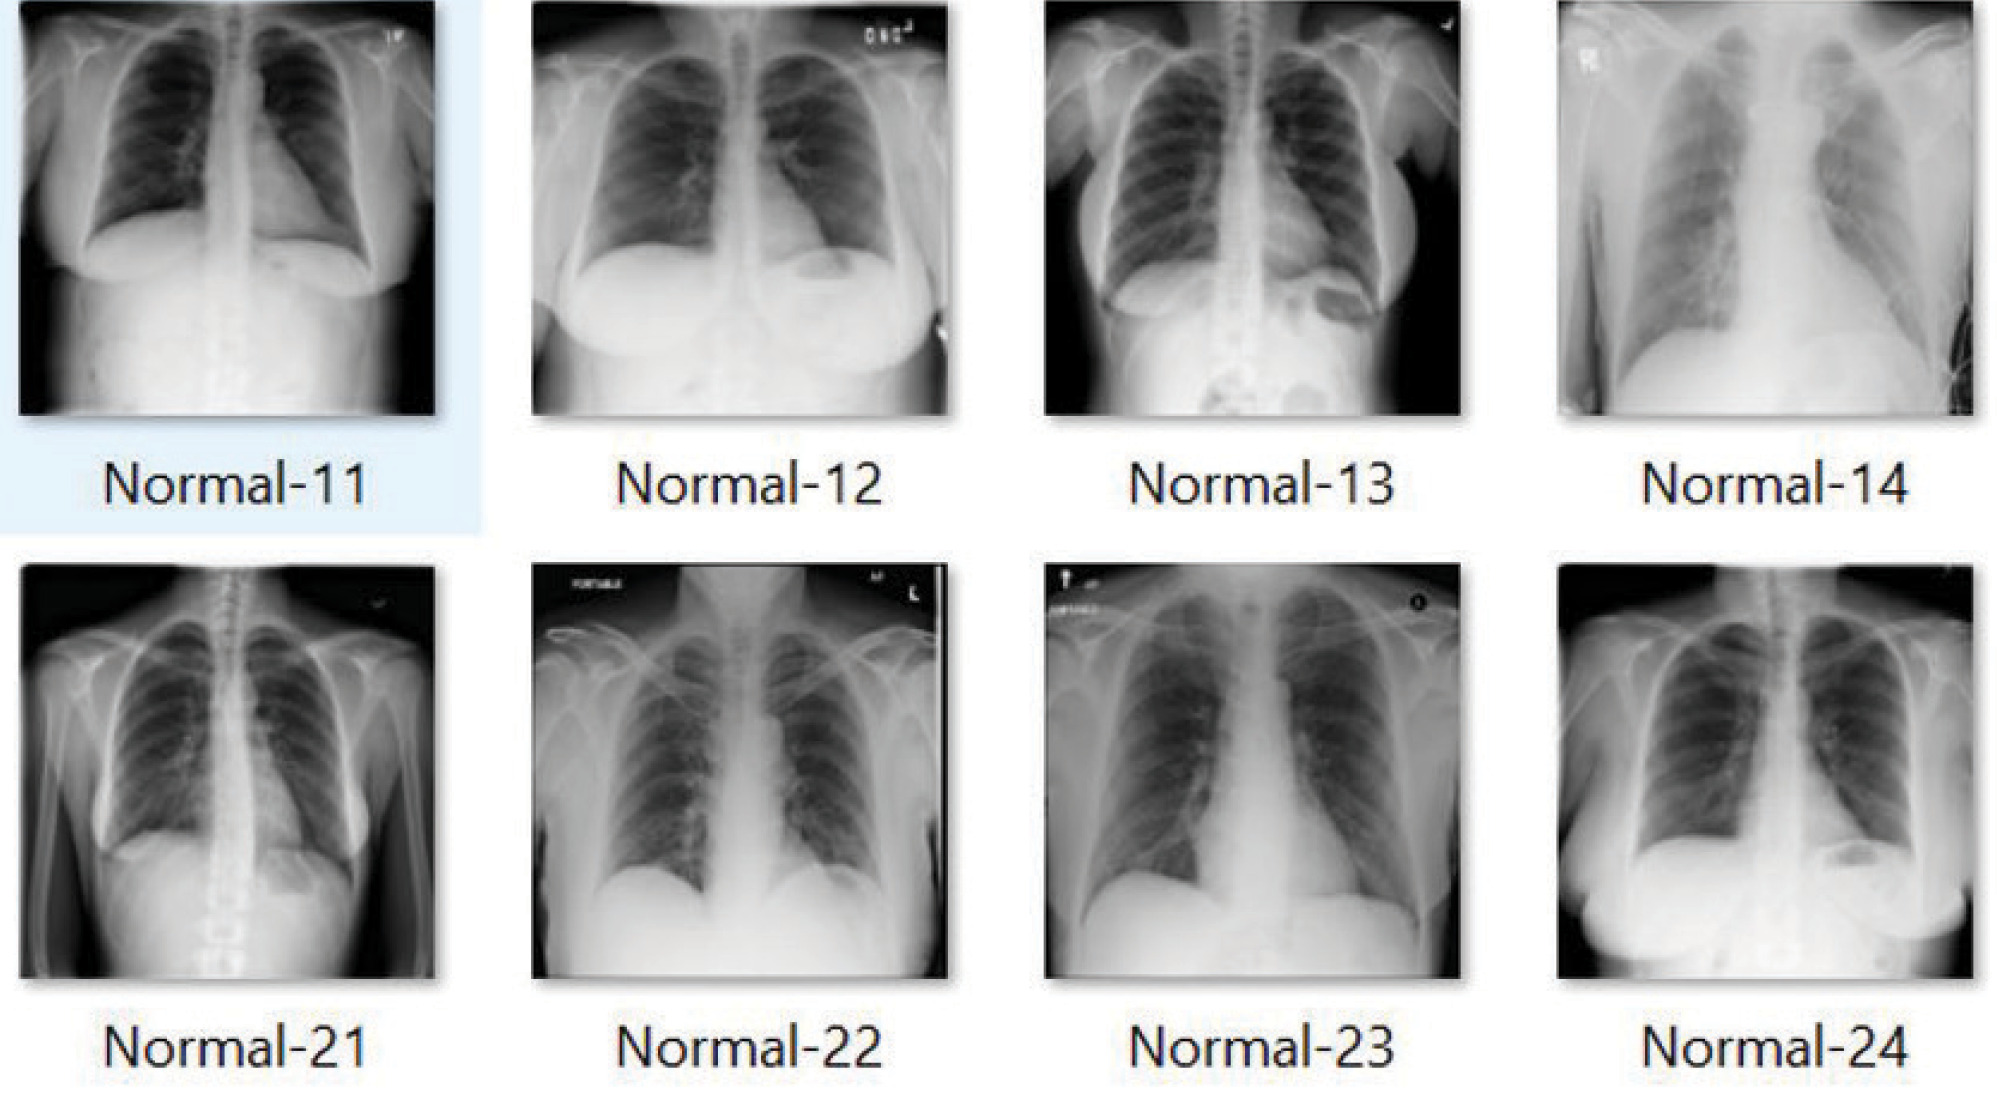
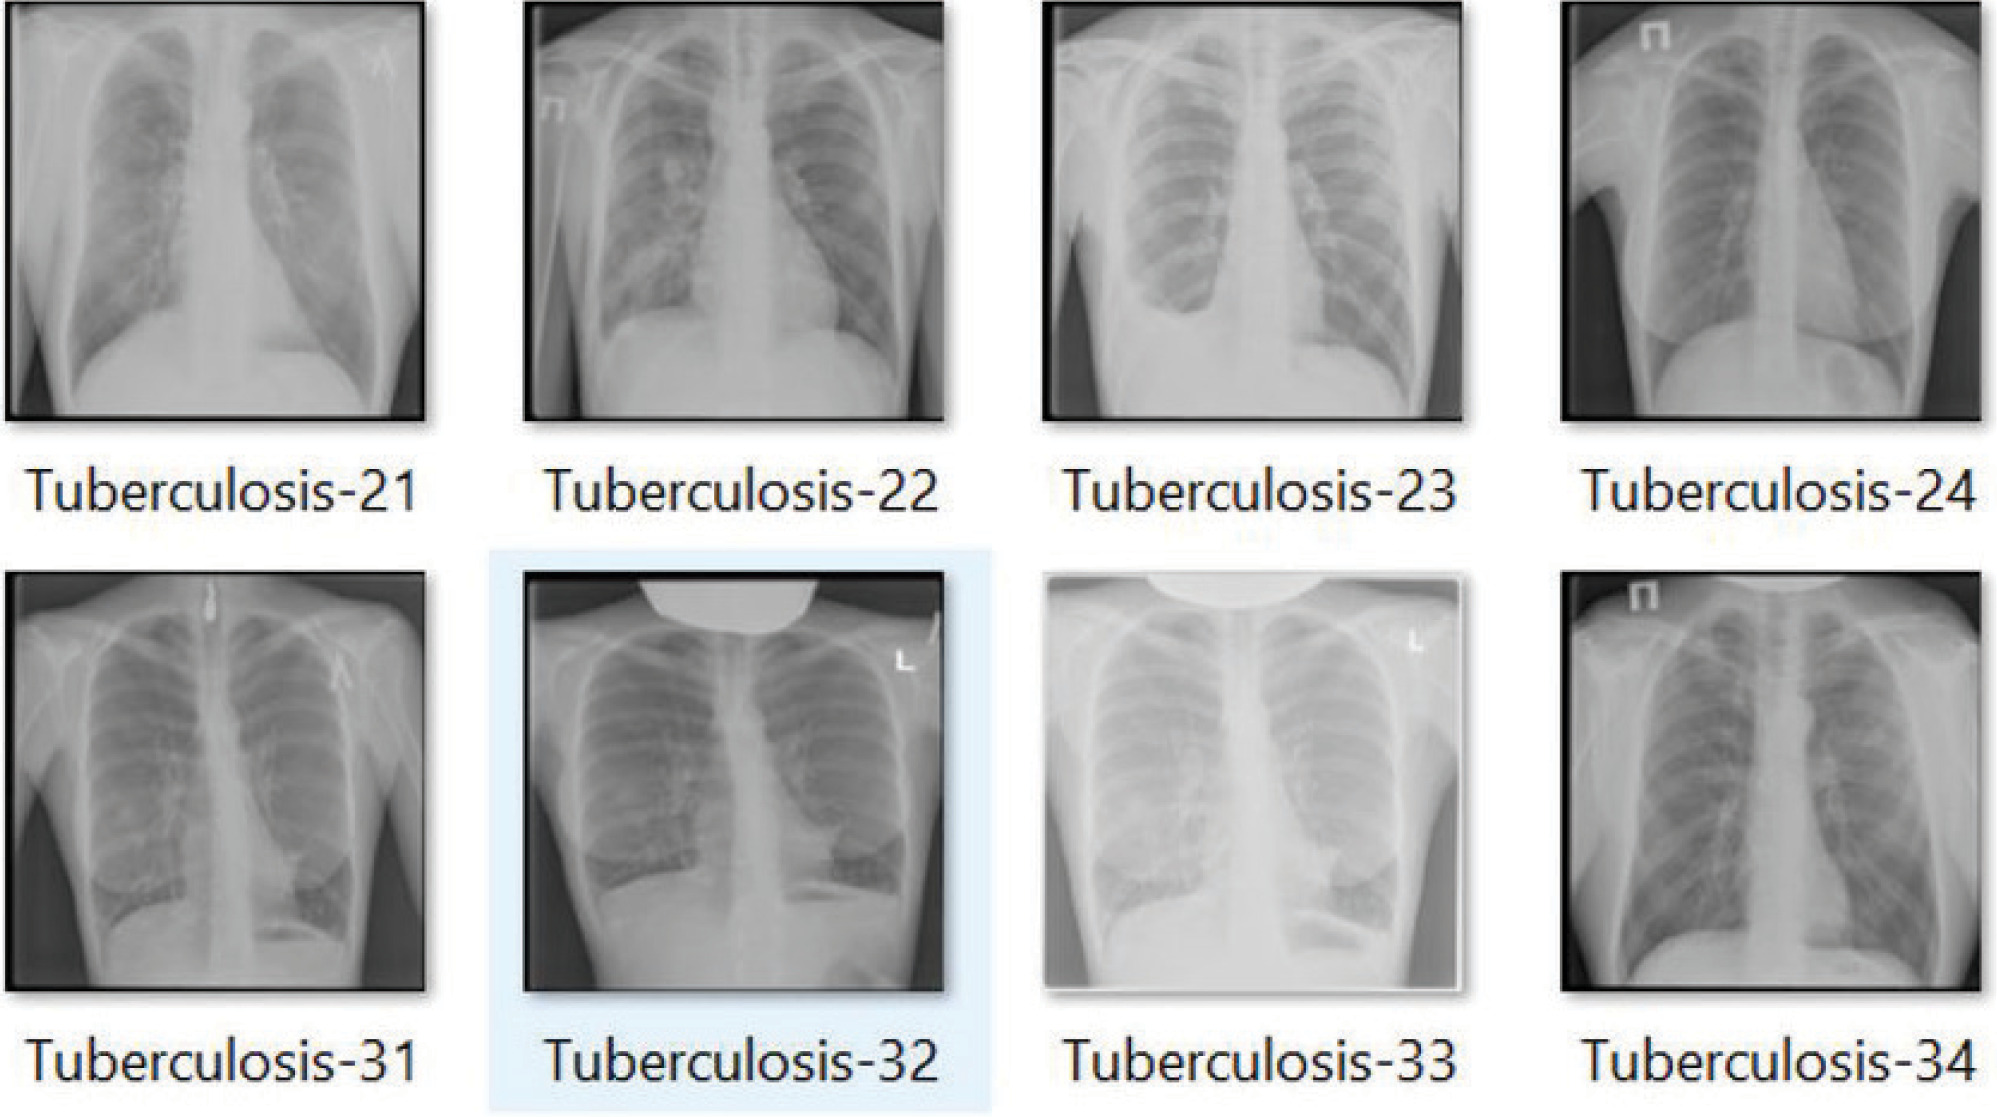
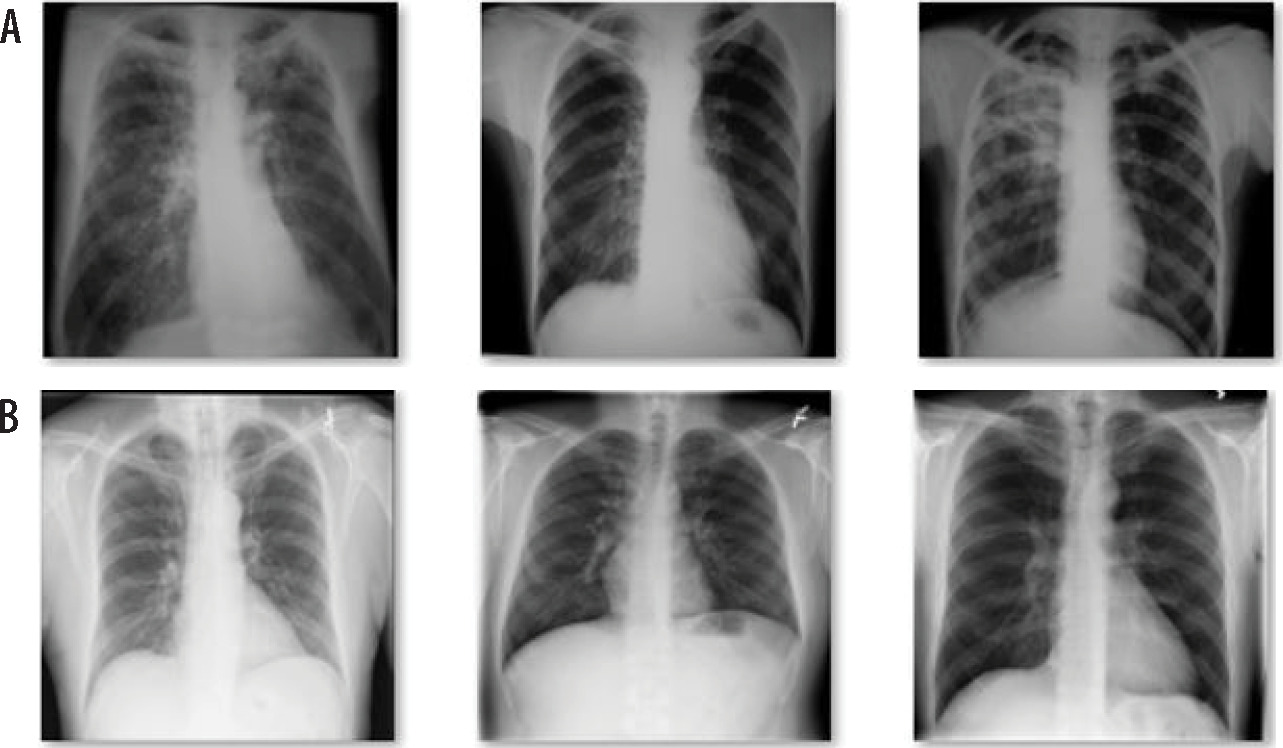
One of the worst illnesses of the world is tuberculosis (TB) caused by Mycobacterium tuberculosis bacteria. The incidence of this potentially fatal infectious disease is estimated to be approximately 25% [1,2]. Tuberculosis is a transmittable illness, which particles maintain in the air and often attack the lungs of people. Sample photographs of normal patients and TB patients are shown in Figures 1 and 2. According to the World Health Organization (WHO) [3] estimate, this condition was expected to impact 9.9 million people in 2020. Additionally, according to the WHO epidemiological map, the Southeast of the world accounts for 44% of all TB cases, followed by Africa with 24%, Mediterranean with 8%, Western Pacific with 18%, and America and Europe with 3%. Over 50% of TB definite cases did not exhibit any symptoms before diagnosis, according to a TB survey from 2000 [4].
In clinical practice, chest radiographs are evaluated for the presence of TB by skilled doctors, but this is subjective and time-consuming procedure. It is inevitable that radiograph illness diagnosis may contain subjective discrepancies [5,6]. Importantly, chest X-ray images of TB are frequently misdiagnosed as other illnesses with comparable radiologic patterns [7,8], which may cause patients to obtain incorrect treatment, deteriorating their health. Additionally, there is a shortage of trained radiologists in low resource countries (LRC), particularly in rural regions. From this perspective, by processing chest X-ray images, computer-assisted diagnosis (CAD) devices can play an important role in mass identification of lung TB. Deep convolutional neural networks (CNNs) and large-scale labelled datasets are easily accessible, and greatly improve picture recognition. CNNs make it possible to learn self-data-driven, highly illustrative, hierarchical, and hybrid image features from sufficient training data, but it is quite difficult to find proper and valid datasets in the field of medical imaging thoroughly interpreted as ImageNet [9,10]. As a high importance industry, with patients prepared to reimburse for the best level of diagnosis, consultations, and services, this healthcare sector is completely unique from all other fields. Despite consuming a sizable portion of national resources, this healthcare sector has not met society’s expectations [11]. However, medical specialists examining medical data are significantly hampered by subjective judgements, quality of photographs, and exhaustion caused by demanding job. Therefore, the use of machine learning in healthcare industry is now receiving a lot of attention. There are numerous studies on artificial intelligence (AI)-based solutions applications in many diseases, such as pneumonia, breast cancer, diabetes, heart disease, brain tumor, lung nodule, etc. [12]. One of deep learning approach is CNN that is used to demonstrate significant potential in image processing and classification, and is widely accepted by researchers and academician community [13,14]. Deep learning approaches are becoming more and more prevalent for programmed identification of lung infections from chest X-rays, since X-ray images are a low-cost option in imaging technology, and there is a wealth of data accessible for training various prediction models.
Pre-screening facilities are in high demand since they can make simple diagnostics in a described situation. The most useful automatic TB screening technique that uses chest X-ray images is computer-aided diagnosis (CAD), especially if a trained, expert radiologist is not available [5,6]. TB illness identification using CAD systems, embedded with deep learning algorithms has recently demonstrated encouraging outcomes. However, it is a challenging task to properly train deep neural networks because of the limited availability of TB chest X-ray images. Transfer learning is the best choice in this situation, as it has been used in several other approaches. Because TB features in chest X-ray vary from image to image [8,9], transfer learning models constructed with a deep network pre-trained on the available dataset are inappropriate. To the best of our knowledge, no CAD system in place can concurrently train on various chest X-ray images of TB, while correctly differentiating between standard and different types of lung infections, with a great possibility to feature overlap. The main contribution of authors in the proposed work are as follows:
Proposed deep learning model for automatic detection of TB for early prediction.
Extraction of hand-engineered features and deep features, and combining them.
Performance analysis and comparison with existing work.
Real-time testing of the model.
The proposed work was prepared in various sections. Section 2 of the work described relevant studies in the same or interrelated areas. Sections 3 and 4 illustrated the method used for pre-processing of the dataset and methodology proposed in this work. Experimental setup and results were compared with existing state-of-the arts in section 5. Finally, in the conclusion section, the future scope of the proposed work was presented.
Literature review
Convolutional neural networks have lately been utilized in numerous studies to analyze chest X-ray images, and identify lung ailments inclusive of pneumonia and TB. The identification of new infection of coronavirus from chest X-ray images has been done using CNN-based approaches in training for the COVID-19 pandemic crisis in 2020. Tahir et al. [11] used various pre-trained CNN models for categorization of distinct coronavirus families, such as COVID-19, SARS, and MERS. They found sensitivity values higher than 90%. In a study by Chowdhury et al. [12], the authors created a trained algorithm to discriminate between pneumonia with COVID-19 condition, viral pneumonia cases, and cases of normal patients. They used dataset of X-ray images.
A study by Chhikara et al. [13] investigated the potential for diagnosing pneumonia from chest X-ray images, and assessed the outcomes of various pre-trained models, such as Xception, ImageNet, Resnet, and Inception using filtering and gamma correction as pre-processing methods for feature extraction of Decompose, Transfer, and Compose (DeTraC), a modified transfer learning CNN described by Abbas et al. that may handle data imbalance in medical picture classification. With an accuracy of 99.8%, this CNN architecture was shown to perform better at differentiating between normal and pathological X-rays [14]. Satyavratan et al. [15] suggested using the bag-of-features method and SURF descriptor to categorize chest radiograph images for TB. Furthermore, lung field segmentation used the distance regularized level set.
In a study by Han et al. [16] evaluating chest X-ray images, the researchers proposed deep learning to automatically identify cavity signs in the lungs. Using a multilayer perceptron network as a classifier, the model was able to distinguish TB photos from non-TB images. When training data for classification purposes, a hybrid re-sampling strategy was employed. In a study by Cao et al. [17], TSCNN was a two-phase network for detection of nodule in the lung. For the detection of lung nodules, the U-Net segmentation network was applied in the first stage. TSCNN, a classification algorithm based on dual poling structures was then developed in the second stage. False-positive rates were reduced. Momeny et al. presented a CNN approach to categorize Mycobacterium tuberculosis using microscopic images. With mixed poling in place of baseline and dropout, PReLu improved the accuracy of classification and generalization [18].
Iqbal et al. [19] proposed a combination of lesion-based attention and channel-based attention approaches. They included a block of multiscale fusion to extract improved and more varied information from X-ray images. The authors developed an ensemble learning approach based on a voting method combined with pre-processing images and data augmentation with tuberculosis images [20].Rahman et al. [21] detected TB cases by examining X-ray images of the chest with segmentation, data augmentation, and classification using deep learning approach. The maximum accuracy achieved by the pre-trained model was 96.5%.
The models of CNN are adjusted by the use of several modifications. For a better outcome and greatest performance, weighted voting and soft voting are combined. Furthermore, other image recognition issues, including object recognition, illness categorization, etc., may be solved using the suggested voting method. In a study by Ayaz et al. [22], an ensemble learning-based model to predict TB using X-ray images was proposed. To apply hand-engineering features, Gabor filer was applied to enhance the quality and reduce the cost. The model achieved good accuracy on the used dataset of approximately 700 images, but it needs to be tested on a larger dataset and real-time images. In a study by Iqbal et al. [23], simple pre-trained deep learning model TBXNet was proposed. Five filters of different size in the network were used one-by-one. Moreover, three datasets were utilized as A, B, and C. A and B were parts of the dataset used to train and validate, while C part of the dataset was used to test the model. The model provided accuracy of approximately 96%, but it needs to be verified on real-time data. Showkatian et al. [24] proposed CNN model called “ConvNet”. They used five pre-trained models for prediction using X-ray images, among which, three models performed well, and approximate accuracy of prediction was achieved in 90%. The model needs to be validated with larger dataset for better results and accuracy. In a study, Kukker et al. [25] used reinforcement learning to distinguish between images of pneumonia, TB, and healthy CXR images. A classifier was created using the fuzzy Q-learning technique, and wavelet-based pre-processing was applied to determine the severity of TB and pneumonia. Multi-instance, complicated network, and stacked ensemble networks were reported by Khatibi et al. [26] to correctly differentiate between tuberculous and normal X-ray images. Additionally, several patches were acquired, and the feature vector was then cauterized. On all of the resulting patches, global clustering was also carried out. Purity scores were awarded to the associated cluster and combined for each image. UncertaintyFuseNet, a powerful feature fusion-based network was developed by Abdar et al. [27] to accurately categorize COVID-19 CXR images. The MC dropout approach reduced the uncertainty of feature fusion. Additionally, the suggested UncertaintyFuseNet outperformed unknown datasets, and was effective against noise difficulties. A unique AECNN network was shown in a research by Li et al. [28] that combined feature extraction with an auto encoder module, after which a deep neural network was constructed to assess the region of interest in CXR images to distinguish between typical and non-typical TB images. In order to combine relation-ware features from CNN and GCN networks as well as individual image-level characteristics, Wang et al. [29] presented graph convolutional network (GCN) and deep feature fusion (DFF). The suggested networks successfully classified chest CT scan images, outperforming fifteen state-of-the-art networks. Due to time constraints, trials could only be carried out on CT scan images; FGCNet performance on CXR images was not significant.
Material and methods
Dataset
Tuberculosis chest X-ray image dataset was used for the present study, according to Nakkaş et al. [30]. The dataset consisted of two type of images, i.e., normal and tuberculosis. Total images presented in the dataset were 4,200, among which, 3,500 images were normal chest X-ray and the remaining 700 were X-ray images of tuberculosis patients. Each image was 512 × 512 pixel grayscale. The open access dataset was provided by teams of researchers from Qatar and Dhaka universities. The sample of dataset is shown in Figures 1 and 2.
Pre-processing
This step started with inconsistencies identification. The images available in the dataset were 512 × 512 pixels and needed to be re-sized, so that the computational speed of the model could be better as well as the requirement of less memory and extraction of features. The images were re-sized to 224 × 224 pixels. After re-sizing, normalization process was used to standardize all images in the new dataset. Normalization aimed to ensure that pixel values were in a similar range across all images in the dataset. The re-scaling layer with TensorFlow on a scale of 1/255, and pixel value re-scaling between 0 and 1 were done. This process also improved training process and accuracy of the model.
Data balancing
Pre-classification data balancing is usually used in machine learning. It aims to solve the dataset uneven class distribution problem by ensuring that each class gets enough samples for efficient model training. When one class has disproportionately more samples than the others, it may result in unfair learning and sub-par performance in the minority class [31]. In data balancing, the underrepresented group samples are either increased or lowered to equalize the overrepresented group samples. The classifier learns from adequate data for each class using these methods, which improves the generalization capabilities of the model. The data balancing problem was found in the dataset taken for the study. This proposed model used synthetic minority oversampling technique (SMOTE) for data balancing before classification. Algorithm 1 defines the steps of SMOTE technique.
Algorithm 1 – SMOTE:
Input – k, X, y.
Output – Balance dataset.
Begin:
A sample of minorities should be paired with their k-closest neighbors.
To accomplish this, randomly select one of k-nearest neighbors and calculate the difference in feature values between the sample and the neighbor.
Any value between zero and one is taken, and multiplied by this disparity.
To generate a new sample, the difference is added to feature values of minority class sample.
Steps 2 to 4 can be repeated as many synthetic samples as needed for each minority class sample.
A balanced dataset is created.
End.
Feature extraction
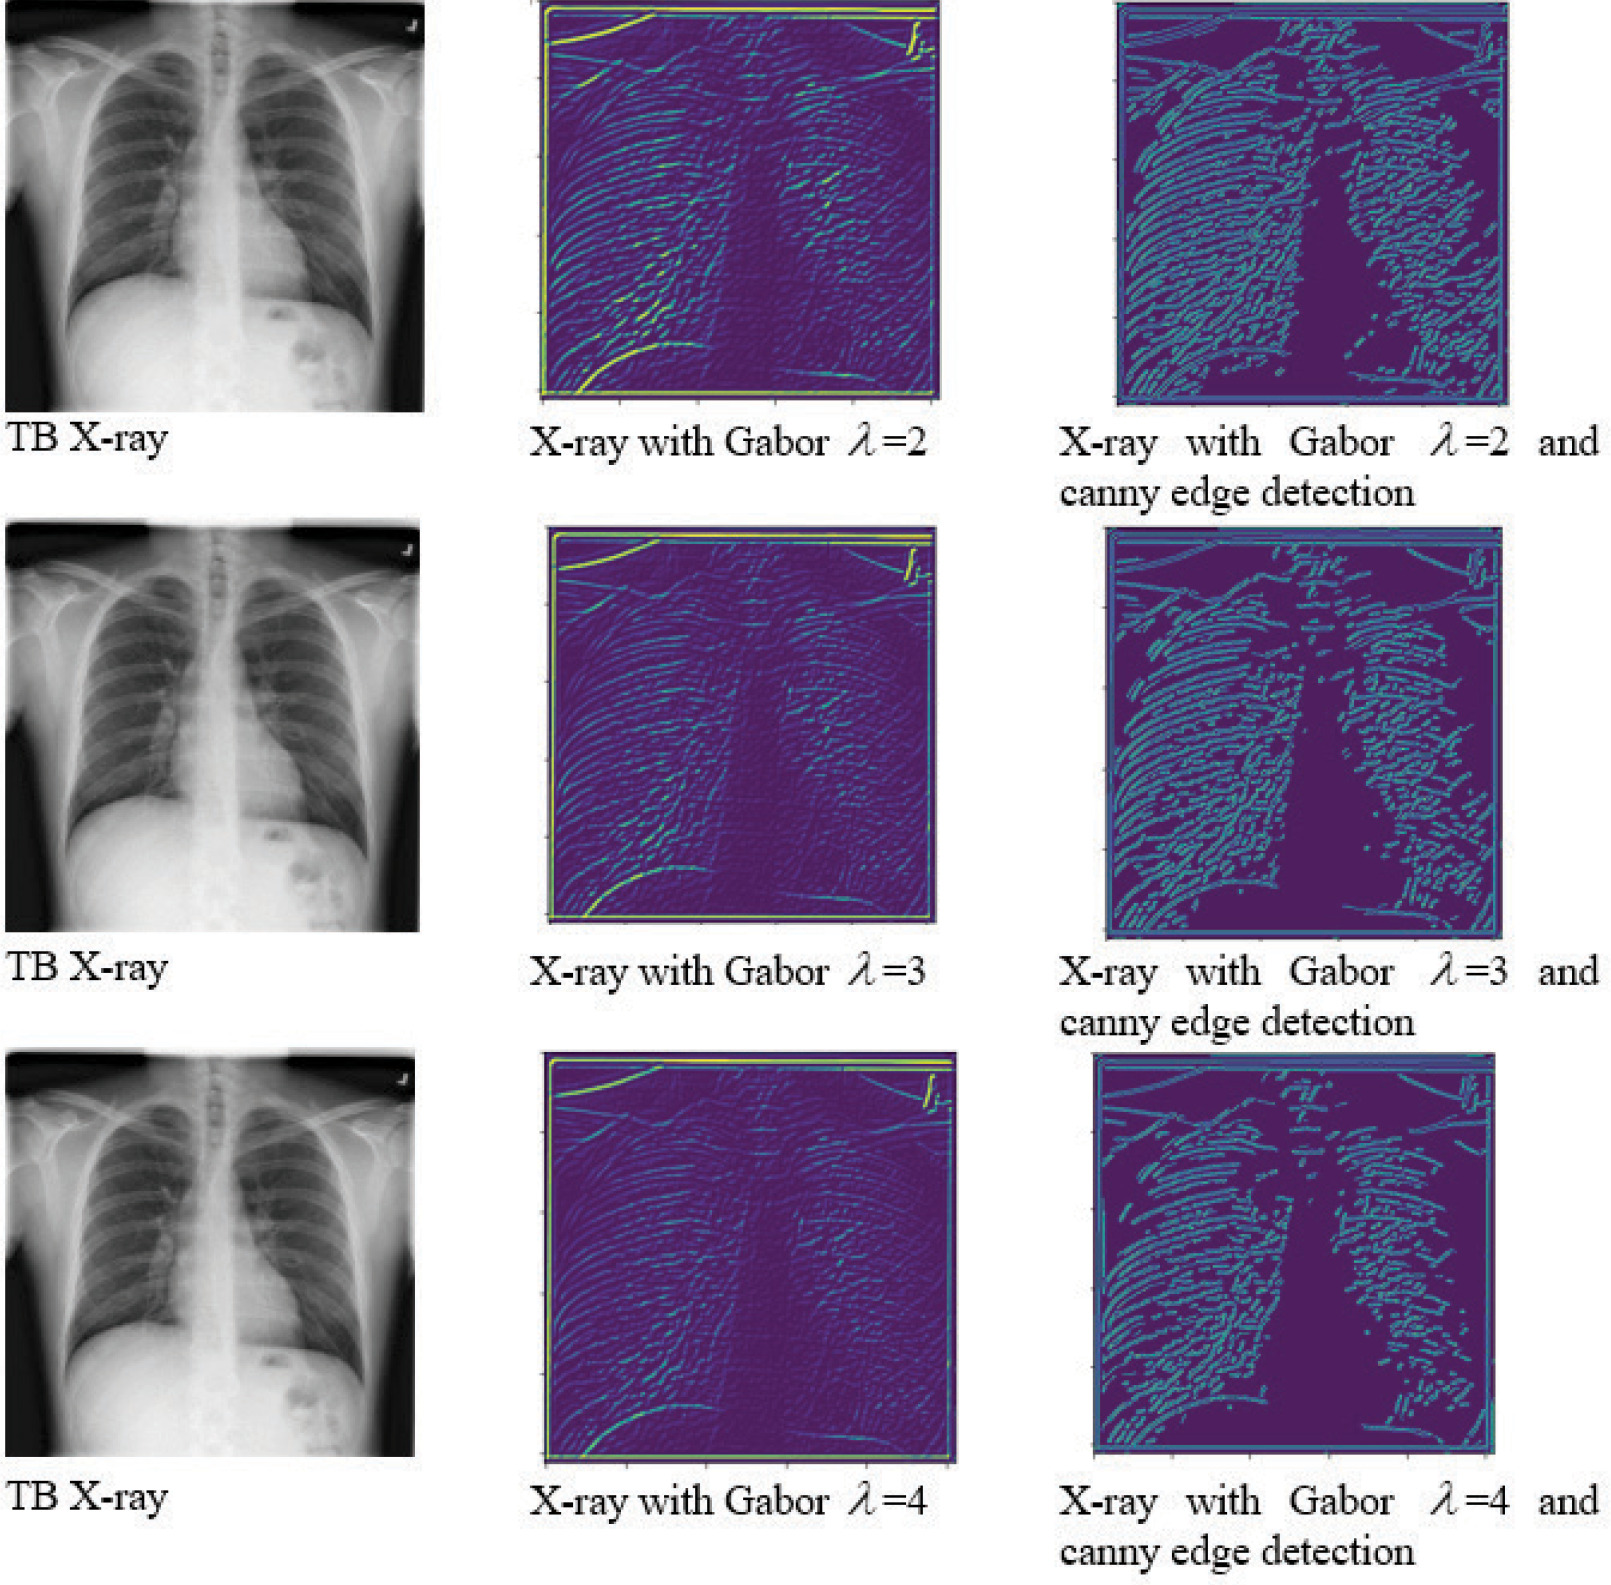
The pre-trained deep convolution network architectures were applied for the classification of TB in this study. DesnseNet169 and MobileNetV2 were used as pre-trained deep learning models to extract deep features [23]. For this, the layers of densenet was established as non-trainable. The model would use pre-trained weights to extract features from input images, and then train a custom output layer to classify features. Similarly, MobileNetV2 was setup with frozen layers for using as feature extractor. In addition to the default feature extraction, Gabor filter extracted more features. It was also possible to improve the model accuracy and efficiency by incorporating Canny edge detection, mainly when an expert radiologist could not analyze the features. The Gabor filter is a complex wavelet filter used to capture fine-grained textures [32]. It also helps in distinguishing TB from other lung issues. 2D Gabor filer is defined in Eq. 1:
where x,y are the spatial coordinates of input image, l is the wavelength, s is the standard deviation, and ϕ isthe phase offset. To know the details of normal and TB-infected images, Gabor filter was applied with three value of lambda (l), followed by Canny edge detection. Figure 3 shows the details of the images.
Results
Proposed model
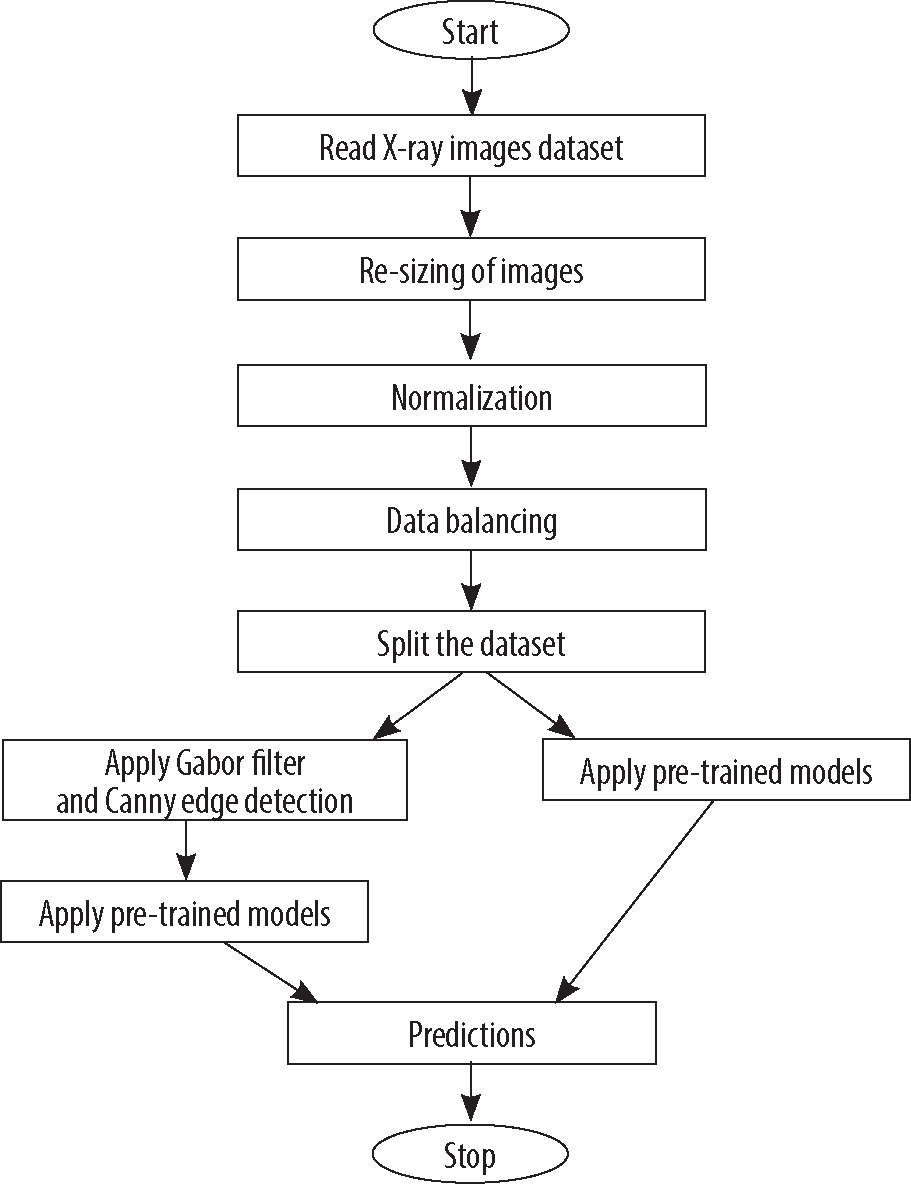
This section discusses the deep learning models used to predict TB cases. After feature extraction using pre-trained models and filter, a regression classifier was used to train the model using re-sized and filtered image dataset. The block diagram of proposed model is presented in Figure 4, and important steps of the proposed model are shown in Algorithm 2. The proposed methodology was evaluated on the full dataset with normal and TB-infected images. The details of training, testing, and other parameters are discussed in the next section. In the classification model, stochastic gradient descent (SGD) optimizer called “Adam” was used. The critical distinction between SGD and Adam optimizers lied in their update mechanisms. While SGD updated the model parameters by computing gradients on a single random training instance at a time, Adam combined the benefits of both adaptive learning rates and momentum by utilizing estimates of first- and second-order moments of the gradients, resulting in more effective and efficient parameter updates. Adam optimizer used moving averages of the parameters to adapt the learning rate during training. Eq. 2 shows the gradients of the loss function.
where, gt is the gradient of the loss function at time t, ∇ is the gradient operator, θt is the model parameter at time t, L is the loss function, and D is the training data. Initialized first and second moments of the gradients m0,v0 = 0 update of the first moment estimate using Eq. 3:
where, b1 is the exponential decay rate. Updated second moment estimate using Eq. 4:
where, b2 is the exponential decay rate. Calculation of bias-corrected is done with Eq. 5 and 6:
Update of the model parameters using Eq. 7:
where, a is a learning rate, and e is the small constant.
In the model, cross-entropy method was applied to measure the dissimilarity between the predicted probabilities and true probabilities of the target dataset. Eq. 8 shows the cross-entropy for single training. Average cross-entropy loss over entire dataset is shown in Eq. 9:
where y represents the true probability,
where, N is the sample, q represents the model parameters, and L (yn,
Algorithm 2 – important steps of the proposed model:
Input: 4,200 chest X-ray images.
Output: Prediction as normal or TB.
Begin:
Load dataset with normal and TB images.
Perform labelling of dataset: normal = 0, TB = 1.
Create a new dataset after re-sizing of images to 224 × 224 pixels.
Apply Gabor filter and Canny edge detection.
Split dataset for training and validation (80:20).
Normalize the data by using re-scaling factor of
Apply MobileNetV2 and DenseNet169 pre-trained models without filtering and edge detection.
Compile the model by using Adam optimizer and cross-entropy as loss function.
Train the model for 10 epochs and print classification report.
Test model on real-time data.
Repeat step 7 to 10 with Gabor filter and Canny edge detection.
End.
Discussion
The model was implemented on an Intel Core i7, 8th generation laptop with 16 GB RAM and 256 GB SSD with NVidia GeForce GTX1050T, 4GB GPU [33]. For evaluation of the model, open-source dataset of TB chest X-ray image dataset was used [30]. At the time of pre-processing, new dataset was created after re-sizing images of 224 × 224 pixels, which saved the computational cost. Although there is always a risk of data loss in re-sizing due to large dataset and memory requirement, it is essential step in any deep learning model to re-size the images.
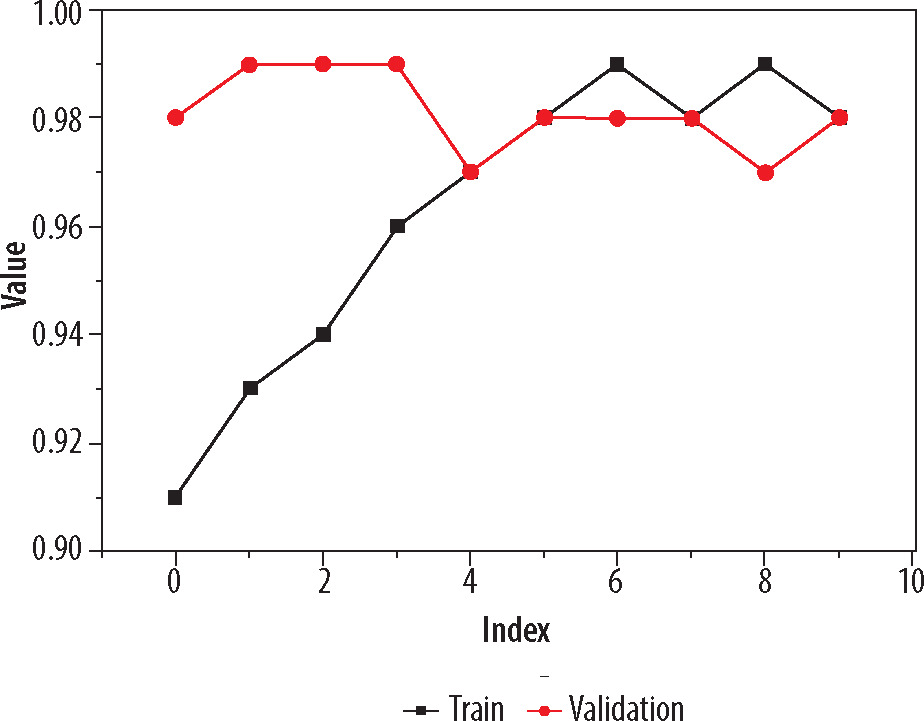
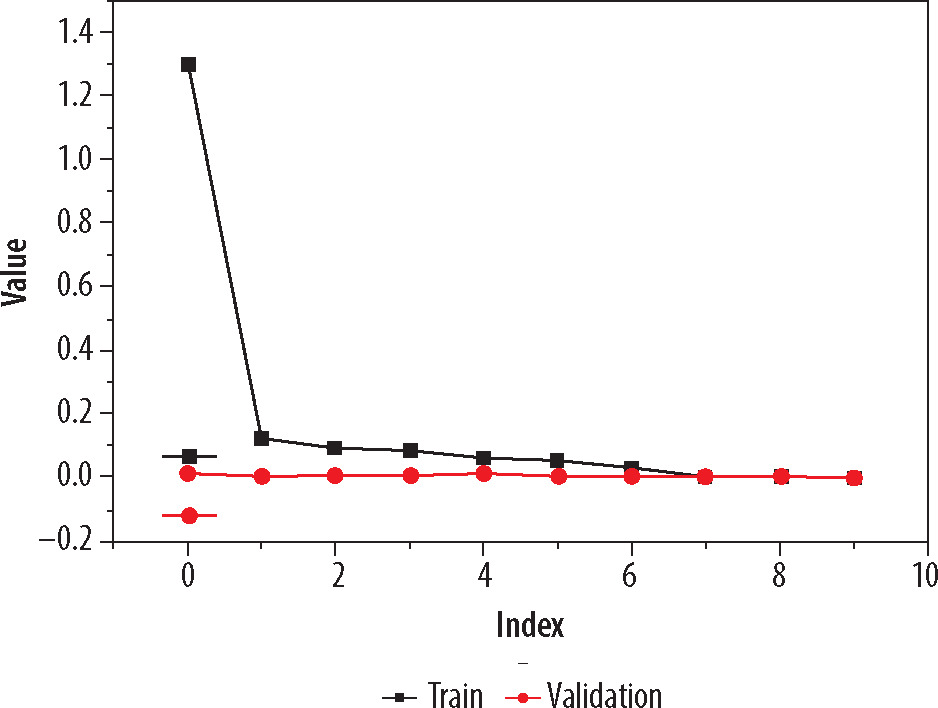
On these images, Gabor filter and Canny edge detection method were applied for more clarity. Pre-trained models used were DenseNet169 and MobileNetV2. Adam optimizer was applied to adapt the learning rate during training, and cross-entropy was used to measure the dissimilarity between the predicted probabilities and true probabilities of the target dataset. Model compiled for 10 epochs and the best model were saved for testing. As an individual feature extractor, DenseNet169 performed better in comparison with MobileNetV2 model. The validation process was divided into two phases. In the first phase, only re-sized image dataset with filtering and edge detection used, and pre-trained models were applied. The model was validated on the dataset (20% taken from the whole dataset), and the loss of 0.0072 and accuracy of 0.957 were calculated of the best model found after compilation, as DenseNet169. In the second phase of training and validation, Gabor filter and Canny edge detection method were used. The model was again validated with same ratio of training and validation dataset, and the loss of 0.0061 and accuracy of 0.979 were calculated of the best model. As per classification report, the precision, recall, and F1 score were found to be 0.98, 0.97, and 0.98, respectively. The graph of the training with respect to training accuracy and validation is shown in Figure 5. Visual representation of loss value changes during the training process is presented in Figure 6.
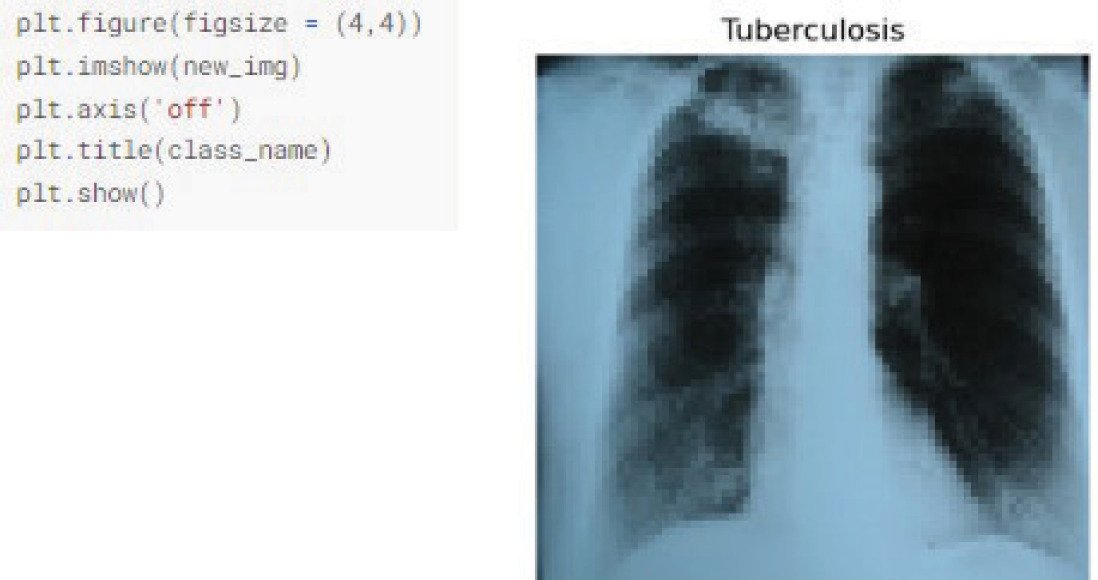
After training and validation, the model was tested on some real images from a cardiologist, and pre-processed of all the images as per the training and validation dataset. A total of 20 images were received from the clinic, of which 10 were of normal patients, and the rest were of TB patients. After pre-processing, the model was tested on the images. Figures 7 A and B show the sample images of the test set of TB and normal patients. Figure 8 presents a fragment of the code and output.
Based on the finding and evaluation of the proposed model, the comparison was done with various existing state-of-the-arts studies [22-24]. The models of the existing work were trained on the dataset, and then tested in real environment. Table 1 shows the comparison of all findings. From the table, it can be easily seen that every model was performing good with respect to accuracy and F1 score. When data was imbalanced, F1 score was an important metric. A model accuracy can be evaluated across all classes using F1 score, which considers precision and recall. The classifier was assessed as balanced based on the ability to identify positive and negative instances, which was especially crucial with unbalanced classes. The proposed model with filtering and edge detection was performing far better than the rest of the models. From Table 1, it is evident that both proposed models performed well with the current dataset. The dataset taken for the current study was quite significant compared with other considered existing studies. Maximum images taken by other models were 500 to 600 in their models. Therefore, from this observation, it can also be claimed that the models reduced performance when tested on much larger dataset.
Table 1
Comparison of test accuracy
| No. | Study | Method used | Test accuracy (%) | F1 score (normal and TB) |
|---|---|---|---|---|
| 1 | Ayaz et al. [22] | Ensemble model, Gabor filter | 95.5 | 0.79/0.82 |
| 2 | Iqbal et al. [23] | TBXNet model | 92.1 | 0.76/0.90 |
| 3 | Showkatian et al. [24] | Exception, ResNet50, and VGG16 (best model | 91.0, 90.5, and 89.2 | Exception model: |
| considered in the study) | 0.72/0.86 | |||
| 4 | Proposed | DenseNet169, MobileNetV2 | 95.7 | 0.94/0.97 |
| 5 | Proposed | DenseNet169, MobileNetV2, Gabor filter, and | 97.9 | 0.95/0.98 |
| Canny edge detection |
Conclusions
A deep learning prediction model for early TB diagnosis by combining deep features and hand-engineered features is proposed in the present study. The model was evaluated in two phases; in the first phase, the model with two pre-trained networks was created to predict image re-sizing. In the next phase, in order to enhance the performance and reduce the computation cost of the model, Gabor filtering and Canny edge detection method were applied on the dataset for feature extraction. The model was evaluated using python Jupiter notebook with a dataset of 4,200 images, with 3,500 normal X-ray images and 700 X-rays of TB-infected patients. The accuracy of the model found in the first phase was 96.1%, while in the second phase, it was found as 99.0%. The model was also tested in real-time environment with some random chest X-ray images, and was found quite better in comparison with the existing state-of-arts studies. In the future, the model can be enhanced and made more realistic using some IoT device, with patient features and images inputted in the model and predictions generated.