


Introduction
Brain atrophy occurs in many diseases and is also associated with the normal ageing process of the brain. The characteristic symptoms of atrophy in neuroimaging studies are a decrease in the total volume of brain structures, including the grey and white matter, an increase in the volume of the ventricles, and widening of the sulci. Brain atrophy can be symmetrical or asymmetric, gene-ralized or focal – when it affects only particular lobes or is selective in terms of areas or morphological structures, e.g. white matter [1-4].
At the microscopic level, brain atrophy is expressed by changes in the cellular microstructure as well as in the extracellular space. It consists of complex processes dependent on various pathological factors – mainly metabolic, cytotoxic, and ischaemic [5]. The chronic ischaemic process, as the dominant one, is also the basis for the development of cerebral small vessel disease (CSVD), in which brain atrophy is one of the basic symptoms, and its intensity is greater in specific locations, including the corpus callosum or hippocampus [1].
Cardiovascular diseases leading to chronic cerebral ischaemia include the most common valvular disease – aortic stenosis (AS), the incidence of which is associated with the population ageing process and thus is constantly increasing [6,7]. Chronic AS impedes the outflow of blood from the left ventricle, causing an increase in pressure in the lumen and hypertrophy of the walls, which is one of the compensatory mechanisms that enable the maintenance of normal stroke volume of the heart. A non-cardiac defence mechanism is peripheral vasoconstriction, which allows for greater blood flow to be directed to organs critical for the proper functioning of the body, e.g. to the brain. As the defect progresses, the compensatory mechanisms become inefficient, and thus the brain is exposed to reduced blood flow. This leads to structural changes in the brain blood vessels supplying the white matter and the deep structures of the grey matter [8,9].
From the clinical and social point of view, it is important to determine whether chronic AS affects the severity of cerebral atrophy. Therefore, the aim of this study was to determine the presence of neuroradiological characteristics and the nature of cerebral atrophy in a group of patients with severe AS in relation to the control group, with particular emphasis on the assessment of atrophy areas typical of CSVD.
Material and methods
This prospective study was approved by the Local Bioethics Committee, and informed consent was obtained from each participant prior to the examination. The study included 34 patients (17 women and 17 men) aged 60-90 years (mean 76 years) with critical aortic stenosis qualified for valve replacement and a group of 50 volunteers (29 women and 21 men) aged 61-85 years (mean 73 years). The control group consisted of healthy volunteers who had been screened for cardiovascular pathology within the last 2 years. Patients with critical AS were in a fairly good, good or very good condition. Thirty patients reported at least one of the symptoms typical of the advanced stage of the disease; most often patients reported exertional dyspnoea – 30 patients, general weakness – 23 patients, palpitations – 12 patients, dizziness – 11 patients, shortness of breath at rest – 9 patients, and dry cough – 4 patients. Among the study group, 4 patients did not report any symptoms. Among the group of volunteers, all were in very good condition, and no one reported symptoms typical of AS.
The inclusion criteria for the study group included severe AS confirmed by echocardiography, and for the control group no or mild AS confirmed by echocardiography within the last 2 years. Exclusion criteria for both groups were the following conditions confirmed within the last 2 years: coexisting significant cardiac pathology other than AS on echocardiography, significant stenosis of the caro-tid or vertebral artery on Doppler ultrasound, as well as pathological lesions in the brain limiting the assessment of magnetic resonance imaging (MRI) scans, including pre-vious ischaemic stroke.
Magnetic resonance imaging of the brain was performed in each of the participants. The examinations were carried out at the Radiology Department of the Central Teaching Hospital of the Medical University of Lodz. A Siemens Magnetom Avanto 1.5T magnetic resonance scanner was used for the examinations, and the 3D T1 sequence was used (TE: 3.4 ms, TR: 2200 ms, FOV read: 256 mm, slice thickness: 1 mm, flip angle: 15°).
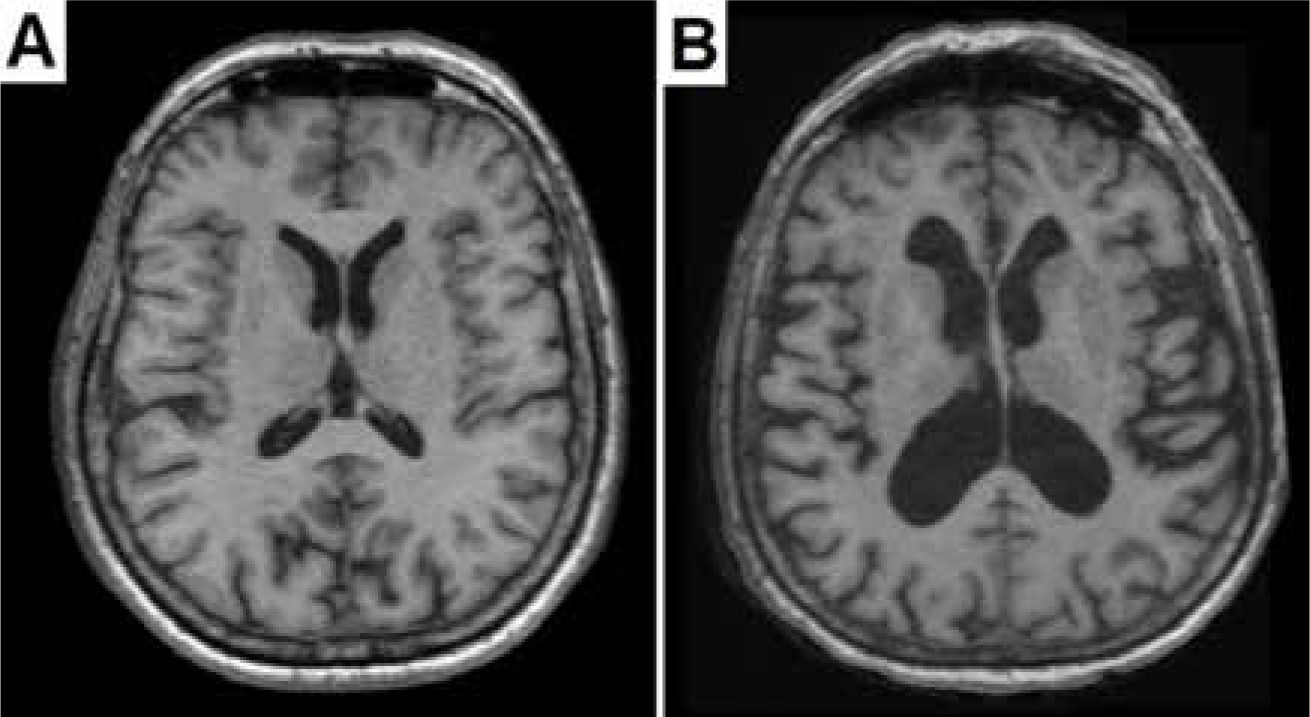
Brain atrophy was assessed based on multiplanar image reconstructions in 3D T1 sequences (Figure 1). Volumetric data were calculated using FreeSurfer software version 5.3.0. (http://surfer.nmr.mgh.harvard.edu/fswiki/FreeSurferWiki, FreeSurfer Open Source Software Suite), which analysed cross sections. Based on the data obtained for the control group and the study group, a comparison was made between the volumetry of the entire brain and its separate parts:
Figure 1
Brain aging and brain atrophy. A) Transverse T1-weighted image of normally aging brain of a 71-year-old woman. B) Transverse T1-weighted image of excessive brain atrophy in 73-year-old woman manifested by an increase in the volume of the ventricles and widening of the sulci
cerebral hemispheres, cerebellum, brain stem,
white and grey matter of the whole brain,
the diencephalon with separation of the thalami,
selective grey matter structures: hippocampus, components of the corpus striatum, i.e. caudate nuclei, globi pallidi, and putamens,
selective white matter structures: the corpus callosum,
cerebral fluid spaces: intracerebral – the ventricular system and extracerebral – subarachnoid space.
The results are shown in cubic centimetres (cm3).
Based on the obtained results, a statistical analysis of the volumetric characteristics of the brain of the study groups was performed. Categorical variables are presented as the number of patients, absolute numbers, and percentages. Numerical variables were depicted by mean and standard deviation values. Statistical significance of differences in the numerical traits between the study groups was appraised by using ANOVA (for normally distributed variables) or Mann-Whitney tests (for non-normally distributed ones). P-values less than 0.05 were considered statistically significant. All the statistical procedures were performed using Stata/Standard Edition, release 14.2 (StataCorp LLC, College Station, Texas, USA).
Results
Calculations of volumetric parameters were made taking into account individual differences depending on the sex and age of the study groups (Table 1). For differences in the volume of brain structures between the study group and the control group, a small but statistically significant difference in age was found – on average about 3 years (p = 0.040). There was no relationship between the diffe-rences in volumetric parameters due to the sex of the study groups (p = 0.470).
Table 1
Statistical analysis of demographic data of the study groups
| Parameter | Study group | Control group | p-value |
|---|---|---|---|
| Sex, n (%) | |||
| Women | 17 (50.00) | 29 (58.00) | 0.470 |
| Men | 17 (50.00) | 21 (42.00) | |
| Age (years), mean (SD) | 76.23 (6.63) | 73.48 (5.40) | 0.040 |
The total brain volume for the study group was on aver-age 1090.02 cm3, which was about 31 cm3 smaller than in the control group, in which the average brain volume amounted to 1120.80 cm3. For the control group, a greater dispersion of volume was shown in relation to the mean SD (136.05) compared to the study group SD (103.74). Differences between total brain volumes for both groups did not show statistical significance (p = 0.079).
Comparative analysis of the main brain compartments draws attention to the statistically significant (p = 0.043) difference between the volumetry of the cerebral hemispheres for both groups. The mean volume of the cerebral hemispheres in patients with advanced AS was on average 884.46 cm3 (SD = 86.30), while for the group of volunteers it was on average 17 cm3 larger and amounted to 901.80 cm3 (SD = 105.85). Comparison of the volumetry of the remaining main areas according to clinical division showed statistically insignificant differences. The mean volume of the cerebellum for the study group was 127.72 cm3, and for the control group it was 130.31 cm3, so their difference was less than 4 cm3 (p = 0.405). For the brain stem these parameters were 155.93 cm3 and 159.27 cm3, respectively, with a difference of just over 3 cm3 (p = 0.447). The results are presented in Table 2.
Table 2
Statistical analysis of the volumetry of the whole brain and its compartments: cerebral hemispheres, brain stem, and cerebellum
The total grey matter volume for the study group was on average 443.44 cm3 (SD = 44.47), which was 4.5 cm3 lower than in the group of volunteers, whose mean grey matter volume amounted to 447.85 cm3 (SD = 55.54), p = 0.063.
Quantitative differences in the mean volumes of structures forming the largest of the basal nuclei, the corpus striatum, for both groups did not exceed 0.3 cm3 and were not statistically significant. Its component, caudate nuclei, in the control group had a mean volume of 7.26 cm3, and in the control group it was 0.1 cm3 larger – 7.36 cm3 (p = 0.758). The volumetry of structures forming the second main component of the corpus striatum – the lenticular nucleus – in the study and control groups is as follows: for putamens it was 8.37 cm3 and 8.39 cm3 (p = 0.413), respectively, and for globi pallidi it was 3.67 cm3 and 3.37 cm3 (p = 0.297), respectively.
The volumetry of the hippocampi – grey matter structures located in the cerebral cortex of the temporal lobes – reached similar average values in the group of patients with severe AS and in volunteers – 7.65 cm3 and 7.72 cm3, respectively (difference 0.07 cm3), p = 0.124. A comparison of the volumetric parameters of the grey matter and its individual structures is presented in Table 3.
Table 3
Statistical analysis of the volumetry of grey matter and its compartments: globi pallidi, caudate nuclei, putamens, hippocampi
The total volumetric mean of white matter in the study group was 430.74 cm3 (SD = 79.47), while for the control group the mean value of this parameter was 27 cm3 higher and amounted to 457.42 cm3 (SD = 67.81), p = 0.266.
The white matter structure whose atrophy correlates with CSVD is the corpus callosum. The volumes of the largest cerebral commissure in the participants of both groups were very similar: in the group of patients with severe AS it was 3.20 cm3, in the group of volunteers it was 3.39 cm3; no correlation was found for both groups (p = 0.338). The results are shown in Table 4.
Table 4
Statistical analysis of the volumetry of white matter and its compartment – corpus callosum
| Parameter | Study group | Control group | p-value |
|---|---|---|---|
| White matter (cm3), mean (SD) | 430.74 (79.47) | 457.42 (67.81) | 0.266 |
| Corpus callosum (cm3), mean (SD) | 3.20 (0.70) | 3.39 (0.66) | 0.338 |
The volumetry of the diencephalon, without its largest structures – the thalami – that were separately analysed, did not differ significantly (p = 0.188) in the group of patients with severe AS and in volunteers; in these groups it was on average 7.69 cm3 and 7.74 cm3, respectively (difference 0. 05 cm3).
The thalami, composed mainly of grey matter forming nuclei, into which bands of white matter penetrate, were separated from the diencephalon. Their volume in the group of patients with severe AS amounted to 14.57 cm3 and was, on average, 0.5 cm3 higher than in the volunteers from the control group, in whom it amounted to 14.12 cm3 (p = 0.483). A comparison of the volumetric parameters of the diencephalon and the separate thalamus is presented in Table 5.
Table 5
Statistical analysis of the volumetry of grey matter and white matter areas: diencephalon and thalami
| Parameter | Study group | Control group | p-value |
|---|---|---|---|
| Diencephalon (cm3), mean (SD) | 7.69 (0.91) | 7.74 (1.03) | 0.188 |
| Thalami (cm3), mean (SD) | 14.57 (5.49) | 14.12 (1.81) | 0.483 |
No statistically significant relationships were observed regarding the mean volumes of fluid spaces, both intracerebral and extracerebral (Table 6). The mean volume of the ventricular system in the group of volunteers was 38.14 cm3 (SD = 17.32), while in the study group the volumetry was on average higher by 1.45 cm3 and amounted to 39.59 cm3 (SD = 20.10), p = 0.562.
Table 6
Statistical analysis of the volumetry of intracerebral and extracerebral fluid spaces
| Parameter | Study group | Control group | p-value |
|---|---|---|---|
| Ventricular system (cm3), mean (SD) | 39.59 (20.10) | 38.14 (17.32) | 0.562 |
| Subarachnoid space (cm3), mean (SD) | 1.20 (0.39) | 1.15 (0.24) | 0.494 |
The mean volumes of extracerebral cerebrospinal fluid were similar for the study group 1.20 cm3 (SD = 0.39) and for the control group 1.15 cm3 (SD = 0.24) – the difference was 0.05 cm3 and was not statistically significant.
The BV/CSF ratio proposed by Orellana et al. reflecting the atrophy of the whole brain was calculated and adjusted to the appropriate age group [10]. The ratio corresponds to the quotient of the sum of white and grey matter (brain volume – BV) and the sum of extra- and intracerebral fluid spaces (cerebrospinal fluid – CSF). The results are summarized in Table 7.
Discussion
In humans, the volume of the brain changes over the course of one’s life. The increase in brain volume occurs during childhood and adolescence, stabilizes in adulthood, and then decreases, showing individual variability. After the age of 35 years, the mean, constant decrease in the CNS volume is determined at 0.2% per year, which then gradually increases, and at the age of 60 years it reaches the value of 0.5% per year. After the age of 60, the mean loss of brain volume is constantly accelerating and amounts to more than 0.5% per year – the results of some studies indicate that after the age of 65 this rate reaches 1%, and after the age of 80 even 2.1%. On average, the brain volume at 90 years of age is reduced by 14% compared to its largest size – reached at around 20 years of age [11-15].
Among the study group with a mean age of 76.23 years (SD = 6.63), the total brain volume was on average 1090.02 cm3 and was lower by about 30.77 cm3 compared to the control group with a mean age of 73.48 years (SD = 5.40), for which the average brain volume was 1120.79 cm3. The difference in absolute values was not statistically significant (p = 0.079). The reason may be the different mean age of 3 years between the study groups (p = 0.040). Bearing in mind the natural loss of CNS volume over time, a simple simulation was carried out – with a mean loss of 0.5% of the brain volume per year (calculated for the age of 60 years), the difference between the groups, when the control group reached the current age of the study group, would be about 13 cm3, and with a mean atrophy of 0.8% per year – which is more likely for the groups participating in the study – these volumes would be equal, which reinforces the conclusion that there are no differences in brain volume between the study groups.
The obtained values are confirmed by literature reports. In a study of 672 Scots with a similar mean age (72.7 years) to the control group (SD = 0.7), Aribisala et al. analysed brain volumetry for age-related brain atrophy. Because the aim of that study was different from ours, the authors differentiated the volume by sex. The median brain volume in men was 1167.62 cm3 and in women 1066.40 cm3, which gives a volume of 1116.82 cm3 on average. Both the total brain volume and the mean age of the subjects are very similar to our obtained results. Similar results were confirmed by the study by Schott et al., in which the mean brain volume among volunteers aged 69.3 ± 7 years was 1119 cm3 (SD = 79). In a study by Last et al., when assessing an older group of healthy people (aged 80.56 years (SD = 5.64)), the average volumetry of the whole brain was 870.15 cm3 (SD = 101.77), which may indicate a significant progression of brain atrophy in recent decades [2,16,17].
Hedman et al. performed a meta-analysis based on 56 studies on long-term changes in brain volume and morphology throughout the subjects’ lifespan. In these reports, measurements were made using a variety of methods and computational programs, but all were based on MRI images. The authors observed that differences in study design and data acquisition methods may have had a significant impact on the obtained results – this applies to the type of sequences used, magnetic field strength, slice thickness, image resolution, and methods of segmentation of brain structures. Nevertheless, our own measurements fall within the ranges of brain volume values obtained by the authors of the aforementioned meta-analysis [18].
With the anatomical and clinical division of the brain into its main components, it was found that the mean volume of both hemispheres of the brain for patients with advanced AS was 884.46 cm3 (SD = 86.30), and for the group of volunteers it was 901.80 cm3 (SD = 105.85). The difference between these values (17.34 cm3) reached a statistically significant relationship (p = 0.043). The volumetry of the cerebellum and the brain stem showed insignificant differences in volume in favour of the control group – 2.59 cm3 and 3.34 cm3, respectively.
There were also no significant differences in the volume of the entire grey matter and the entire white matter between the groups. Both compartments were on average smaller in the study group – grey matter by 4.41 cm3 (443.44 cm3 vs. 447.85 cm3, p = 0.063), and white matter – which is noteworthy – by as much as 26.78 cm3, with absolute volume values similar to grey matter (430.74 cm3 vs. 457.42 cm3, p = 0.266).
Both the selected grey matter components, for which atrophy associated with CSVD has been proven in the literature, i.e. structures contained in the corpus striatum: caudate nuclei, putamens, and globi pallidi as well as the hippocampus, did not show statistical differences between the analysed groups, and the differences in their mean volume did not exceed 0.30 cm3 in each case [1]. Similarly, the selectively chosen part of the white matter – the corpus callosum – turned out to be insignificant, where the difference was only 0.19 cm3 in favour of the control group. Also, the volumes of the diencephalon and its largest parts, the thalami, analysed separately, did not show statistical significance; the thalami were larger by an average of 0.5 cm3 in the AS group, and the rest of the diencephalon by 0.05 cm3 in the control group.
One of the reasons for the significant volume disproportion between the cerebral hemispheres of the studied groups may be the difference in white matter volume of almost 27 cm3. Bearing in mind that the difference between the volumes of the whole brain was less than 31 cm3, this raises the importance of this parameter. Furthermore, in the study group, the white matter accounted for 39.5% of the whole brain, and in the control group 40.8%; thus, the difference was 1.3%. For comparison, the difference in the brain to grey matter ratio was almost half as much – 0.7% in favour of the control group.
Studies by other authors consistently indicate that the grey matter volume shows a fairly constant and stable decrease throughout life; the white matter, in turn, depends on specific age ranges: it increases with human maturation, stabilizes in adulthood, and then begins to decrease significantly after about 50 years of age [19,20]. Driscoll et al. conducted a 10-year observation on a group of 120 healthy subjects with a mean age of 70.68 (SD = 6.11) at the beginning of their study regarding brain atrophy, and they determined the annual decrease in the grey matter volume at the level of 2.62 cm3 and white matter at 4.54 cm3. Resnick et al. measured annual decreases in the grey and white matter volume at the levels of 2.4 ± 0.4 cm3 and 3.1 ± 0.4 cm3, respectively, during a 4-year observation in a group of 92 healthy subjects aged 70.4 years (SD = 7.0) at the beginning of the study. In a study of a smaller group of 14 volunteers at the initial age of 71.4 years (SD = 0.9), based on a 3-year observation, Thompson et al. estimated the average annual loss of grey matter at the level of 0.91 cm3 ± 0.92% and of white matter at the level of 272 cm3 ± 1.44% [15,21,22]. Thus, changes in the volume of the whole brain for particular age groups reflected mainly changes in the white matter volumetry.
The obtained white and grey matter volumes, although smaller for the study group, are consistent with the presented data and may indicate age-related atrophy, which may result in a significant difference in the volume of cerebral hemispheres. However, despite the lack of statistical significance between the groups (p = 0.266), a significant difference between the absolute volumetric values of white matter suggests that its increased atrophy among patients with severe AS may also be due to reasons other than the age difference.
There are indications in the scientific literature that the presence of other signs of CSVD, such as white matter hyperintensities or lacunar strokes, may affect the white matter volume, which indirectly affects the brain volume. In a large study conducted on a group of 490 people aged 60-90 years, Ikram et al. confirmed the relationship between the presence of lacunar strokes and white matter hyperintensities and reduced volume of the brain, and especially of the white matter, which was the main cause of general brain atrophy. Similar conclusions were reached by DeCarli et al., who found in a group of 2081 people a relationship between the occurrence of lacunar strokes and more severe cerebral atrophy, mainly in the temporal lobes. The authors did not take into account the division into the white and grey matter. A team led by Jernigan proved the correlation between the presence of white matter hyperintensities and its smaller volume in a study group of 78 people. Two possible pathomechanisms that may lead to white matter atrophy have been proposed: white matter degeneration with the formation of hyperintensity leading to the replacement of normal white matter with glial tissue, without reducing its total volume, and proper atrophy of its fibres with a decrease in volume [23-25].
Attention should also be paid to the difference between the studied groups in terms of grey matter volume (4.41 cm3), with the control group predominating. Grey matter is the part of the brain most susceptible to hypoperfusion. Taking into account the haemodynamic factors that arise in chronic, severe AS, a deepened atrophy in the grey matter structures was expected, which could imply a reduction in volume of the white matter of the cerebral hemispheres described above. However, the difference in grey matter volume between the study and control groups did not reach the level of statistical significance.
It seems that the most important factor influencing the condition of the grey matter are the autoregulatory mecha-nisms that often in decades-long, progressive AS maintain cerebral blood flow (CBF), protecting the brain from hypoperfusion. This thesis was proved by Vlastra et al., who conducted an interesting study comparing the change in CBF in patients with heart failure who underwent TAVI. It was determined that CBF was reversibly impaired by reduced heart rate as a result of chronic AS, and significantly higher CBF elevations were obtained postoperatively, similar to those seen in patients with HF who underwent heart transplantation or pacemaker implantation. Most importantly, however, in the studied groups, the increase in CBF was disproportionately low compared to the increase in LVEF, which the authors explained by the preoperative need to maintain cerebral perfusion in the group of patients with chronic AS by receiving a greater proportion of cardiac output [26].
Lambert et al., in an important publication on white matter lesions in CSVD, proved that grey matter atrophy should be the main factor contributing to the atrophy of the whole brain, which is supported by neuropathological observations. They suggest that pathological lesions in the cerebral cortex may cause degenerative lesions in both the axons themselves and their myelin sheaths, which may result in increased fluid content in PVWM. An alternative hypothesis is the primary changes in the white matter, in the form of infarcts within it, causing retrograde degeneration of cortical neurons supplied by already degenerated axons [27]. This is substantiated by many studies using different imaging techniques, which have estimated that CBF varies significantly between the white and grey matter, and in quantitative comparisons it has been proven to be about twice as large in the grey matter [28]. This turns out to be crucial in the advanced stage of HF, when part of the compensatory mechanisms protecting the brain against hypoperfusion breaks down; then the remaining activities focus on maintaining CBF in the grey matter. Finally, after decompensation of all autoregulatory mechanisms, including those maintaining CBF, symptomatic cerebral hypoperfusion occurs in the grey matter and its severe atrophy appears. This is evidenced by the report by Roy et al., who analysed cerebral flow in patients with decompensated, symptomatic HF of various aetiologies, including end-stage AS. Compared to the control group, decreased CBF appeared in many areas of the brain, primarily in the cortex of the temporal, parietal, and occipital lobes. In addition, reduced CBF was found in areas consisting of both the grey and white matter: thalami, cerebellum, and white matter structures: corona radiata and corpus callosum. Importantly, the decrease in CBF in the study group was accompanied by a significant decrease in grey matter volume [29].
In the analysed group of patients with AS some of the symptoms of HF did not occur, and in the remaining group they occurred shortly before the study; this is probably why there was no significant atrophy of grey matter, as well as the mentioned structures consisting of grey and white matter fibres. The difference in the grey matter volume in relation to the control group, even with a borderline indicator of statistical significance, may suggest its relative sparing by autoregulatory mechanisms in the course of long-term AS. However, this aspect remains a hypo-thesis and should be the subject of additional research.
Age-related cerebral atrophy is associated with enlargement of the extra- and intracerebral fluid spaces. Exa-mining a group of 29 healthy people aged 69 ± 7 years, Schott et al. showed the average volume of the ventricular system at the level of 32 cm3 (SD = 22), while for an older group of healthy adults aged 76 ± 6 years, consisting of 152 people, Nestor et al. determined the mean volume at the level of 38 cm3 (SD = 19). Ambarki et al. determined the normal range for this age group (mean age 71 ± 6 years) at 37 ± 18 cm3 [16,30,31]. The above observations are consistent with the results obtained both for the group of patients with severe AS, where the mean ventricular volume was 39.59 cm3 (SD = 20.10), and for the group of volunteers, where the volume was slightly lower and amounted to 38.14 cm3. Similarly, the volumes of extracerebral cerebrospinal fluid located in the subarachnoid space in both groups were similar, i.e. with a difference of 0.05 cm3 in favour of the study group; 1.20 cm3 (SD = 0.39) and 1.15 cm3 (SD = 0.24) for the study group and the control group, respectively.
A very interesting way of measuring the atrophy of the whole brain was proposed by Orellana et al. For individual age groups, they determined the norms of the BV/CSF ratio, corresponding to the quotient of the sum of white and grey matter (brain volume – BV) by the sum of extra- and intracerebral fluid spaces (cerebrospinal fluid – CSF). By analysing a group of over 1000 people, they determined that for the 75-84-year age category, the ratio > 15.08 reflects the physiological atrophy of the brain related to age, and the lower ratios, respectively: ≤ 15.08 – mild, ≤ 12.87 – medium, and ≤ 10.23 – severe, reflect pathological brain atrophy. Referring the BV/CSF ratio to our study groups, it was found that the BV/CSF values in both the study group (BV/CSF = 20.9) and the control group (BV/CSF = 23.0) were within normal limits, which supports age-related physiological brain atrophy [10].
Conclusions
In conclusion, generalized brain atrophy or atrophy particularly marked in the grey matter, corpus callosum, hippocampus, with dilatation of the ventricular system and subarachnoid space – which is a pattern of characteristic atrophy in the course of CSVD – do not distinguish patients with severe aortic stenosis.
The observed significant decrease in the total volume of the cerebral hemispheres may be related to various factors. A small but significant difference in the age of both groups might affect the results. Atrophy of cerebral hemispheres may imply the presence of white matter hyperintensities and lacunar strokes resulting from generalized cerebral hypoperfusion caused by the underlying disease. These relations may be expressed by a large absolute difference in the white matter volume; however, statistical analysis did not show statistical significance.
Volume analysis of the remaining brain structures showed a pattern of atrophy consistent with physiological ageing of the brain. The lack of generalized atrophy, including the atrophy of the grey matter most susceptible to hypoperfusion, proves the effectiveness of adaptive mechanisms to the gradually decreasing cardiac output caused by the progressive valve defect, which prevent the formation of haemodynamic and metabolic disorders.