


Introduction
A pandemic disease elicited by the virus SARS-CoV-2 has caused serious (health, mental, social, etc.) issues by infecting millions of people all over the world. It was reported that more than 200 countries have been affected by the coronavirus pandemic. As well as causing disease symptoms (e.g. fever, fatigue, cough, and respiratory distress), the COVID-19 pandemic caused a failure in health services due to the lack of medical staff or the overloading of entire healthcare systems. However, recent publications suggest that artificial intelligence (AI) could be used to aid in various aspects of pandemic crises, including medical diagnosis, novel drug development, patient treatment, epidemiology, and socioeconomics [1].
Even though the ‘golden standard’ for COVID-19 dia-gnosis is the reverse transcription-polymerase chain reaction (RT-PCR) test, radiological screening, such as lung computed tomography (CT) scans or lung X-ray, can help to monitor the disease and quickly isolate infected people. However, the increased number of COVID-19 patients and the need for manual analysis of chest X-ray imaging imposed a significant burden on medical staff. Therefore, intelligent technologies could greatly improve the disease’s diagnosis procedures. X-ray analysis may be reported as less accurate than CT scans, but at the same time X-ray scanning is less expensive and data processing is less computationally demanding. An automated system of COVID-19 diagnostics based on X-ray scans could work continuously, analysing input data relatively fast and without breaks. As a result, such a system could significantly accelerate the diagnostic process for COVID-19 patients and keep it cost effective.
The aims of this paper were as follows: 1) to implement a baseline transfer learning schema of processing the lung X-ray images in order to detect COVID-19 symptoms; 2) to test different scenarios of augmentation and evaluate them in terms of obtained improvements in evaluation metrics, such as accuracy, precision, recall, and F1-score; 3) to use augmentation scenarios in 2 modes: with and without segmentation, and to assess the influence of segmentation on the model effectiveness; 4) to validate the proposed system on a dataset containing real data obtained from the hospital (COVID-19 or healthy lung X-ray images confirmed with a RT-PCR test); 5) to compare the obtained results to other, state-of-the-art analytical algorithms.
In this research we focused on the influence of augmentation on the performance of lung X-ray classification. Augmentation can help in overcoming the limitation of data samples in particular image datasets. Khalifa et al. [2] described the following advantages of augmentation: 1) it can be an inexpensive way of gathering more data when compared with regular data collection with its label annotation; 2) it can be very accurate because it is originally generated from ground-truth data; 3) it can be controllable, so it is possible to generate well balanced data; 4) it can help in overcoming the overfitting problem; and 5) it can provide better testing accuracy.
Material and methods
In this study, we utilized a dataset that can be found on the website https://www.kaggle.com/datasets/andyczhao/covidx-cxr2. The example of use and detailed description were provided by Wang et al. [3]. The dataset included images obtained from various sources such as the GitHub repositories and the Open Radiology Database (RICORD). All images were anonymized. The images were divided into 2 categories: COVID-19 and normal, and all of them were posteroanterior (PA) chest X-rays. A total of 30,386 images were used in the experiment. The dataset can be treated as balanced because there were ~16,000 samples in the COVID-19-positive class and ~14,000 samples in the COVID-19-negative class.
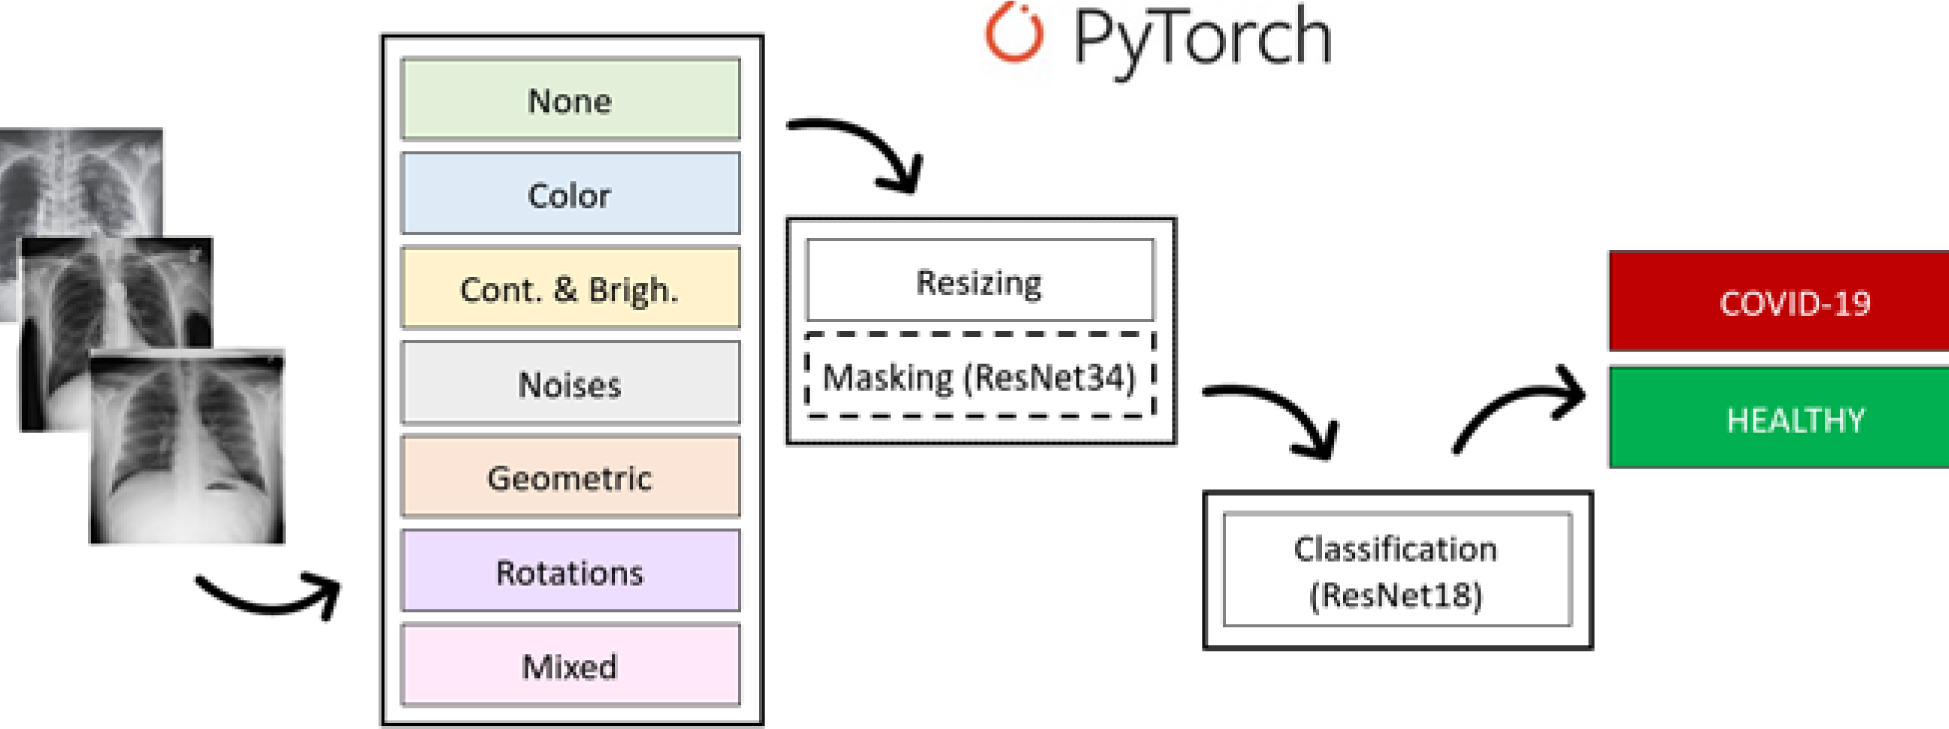
Some examples of images from the dataset and the general overview of the proposed method are presented in Figure 1. It shows the following steps of the proposed pipeline: augmentation, pre-processing (normalization and masking by ResNet34), and classification using ResNet18’s pretrained convolutional neural network. Finally, the proposed method gives the answer of “true” for the COVID-19-positive sample and “false” for the healthy sample. Each step of the process is described in detail in the paragraphs below. All analyses were carried out with the use of Python 3.7 and the PyTorch platform. It is worth noting that in the pre-processing part the masking is marked with a dashed line; this is to emphasize that we performed some experiments with and some without masking.
Figure 1
Pipeline of the proposed architecture: images from the dataset, 7 options of augmentation, pre-processing (resizing and masking) and classification performed by ResNet18, and finally the result: positive or negative
Data augmentation and pre-processing
We proposed a baseline system to determine the impact of the chosen data augmentation method on the final classification result. Data augmentation is an important step in image analysis because it allows for an increase in the size of the dataset; thus, it could possibly contribute to the improvement of the model evaluation metrics. The augmentation can also improve the model’s ability to generalize. In our study, we evaluated 7 different data augmentation approaches:
None – no augmentation methods were used in the baseline approach.
Group 1 – manipulating the colour of the image; this group of methods consists of:
Group 2 – manipulating the contrast and brightness of the image; this group of methods consists of:
– CLAHE (Contrast Limited Adaptive Histogram Equalization) – adjusting the image intensity to improve the contrast and visibility of the lung structures.
– RandomBrightness – adjusting the brightness of an image by a random amount.
– RandomContrast – adjusting the contrast of an image by a random amount.
– Sharpen – sharpening the image to increase its contrast and highlight details.
Group 3 – this group of methods adds noises to the image. All used parameters of the noises were set experimentally:
– MotionBlur – adding blur to the image to simulate motion blur; the blur limit was set to 5.
– MedianBlur – blurring the image by replacing each pixel’s value with the median value of the pixels in its neighbourhood; the blur limit was set to 3.
– Blur – blurring the image using a box filter; the blur limit was set to 4.
– GaussianBlur – blurring the image using a Gaussian filter with kernel (3,7);
Group 4 – this group of methods applied geometric transformations to the image:
– ElasticTransform – applying a non-rigid deformation to the image using displacement fields.
– OpticalDistortion – applying distortion to the image to simulate lens distortion.
– GridDistortion – applying a grid distortion to the image, simulating distortions that can occur in images captured through a grid or mesh.
Group 5 – rotating an image by a fixed angle to simulate different orientations of the image; images were rotated by angle in range $ < –3,3 > $ expressed in degrees.
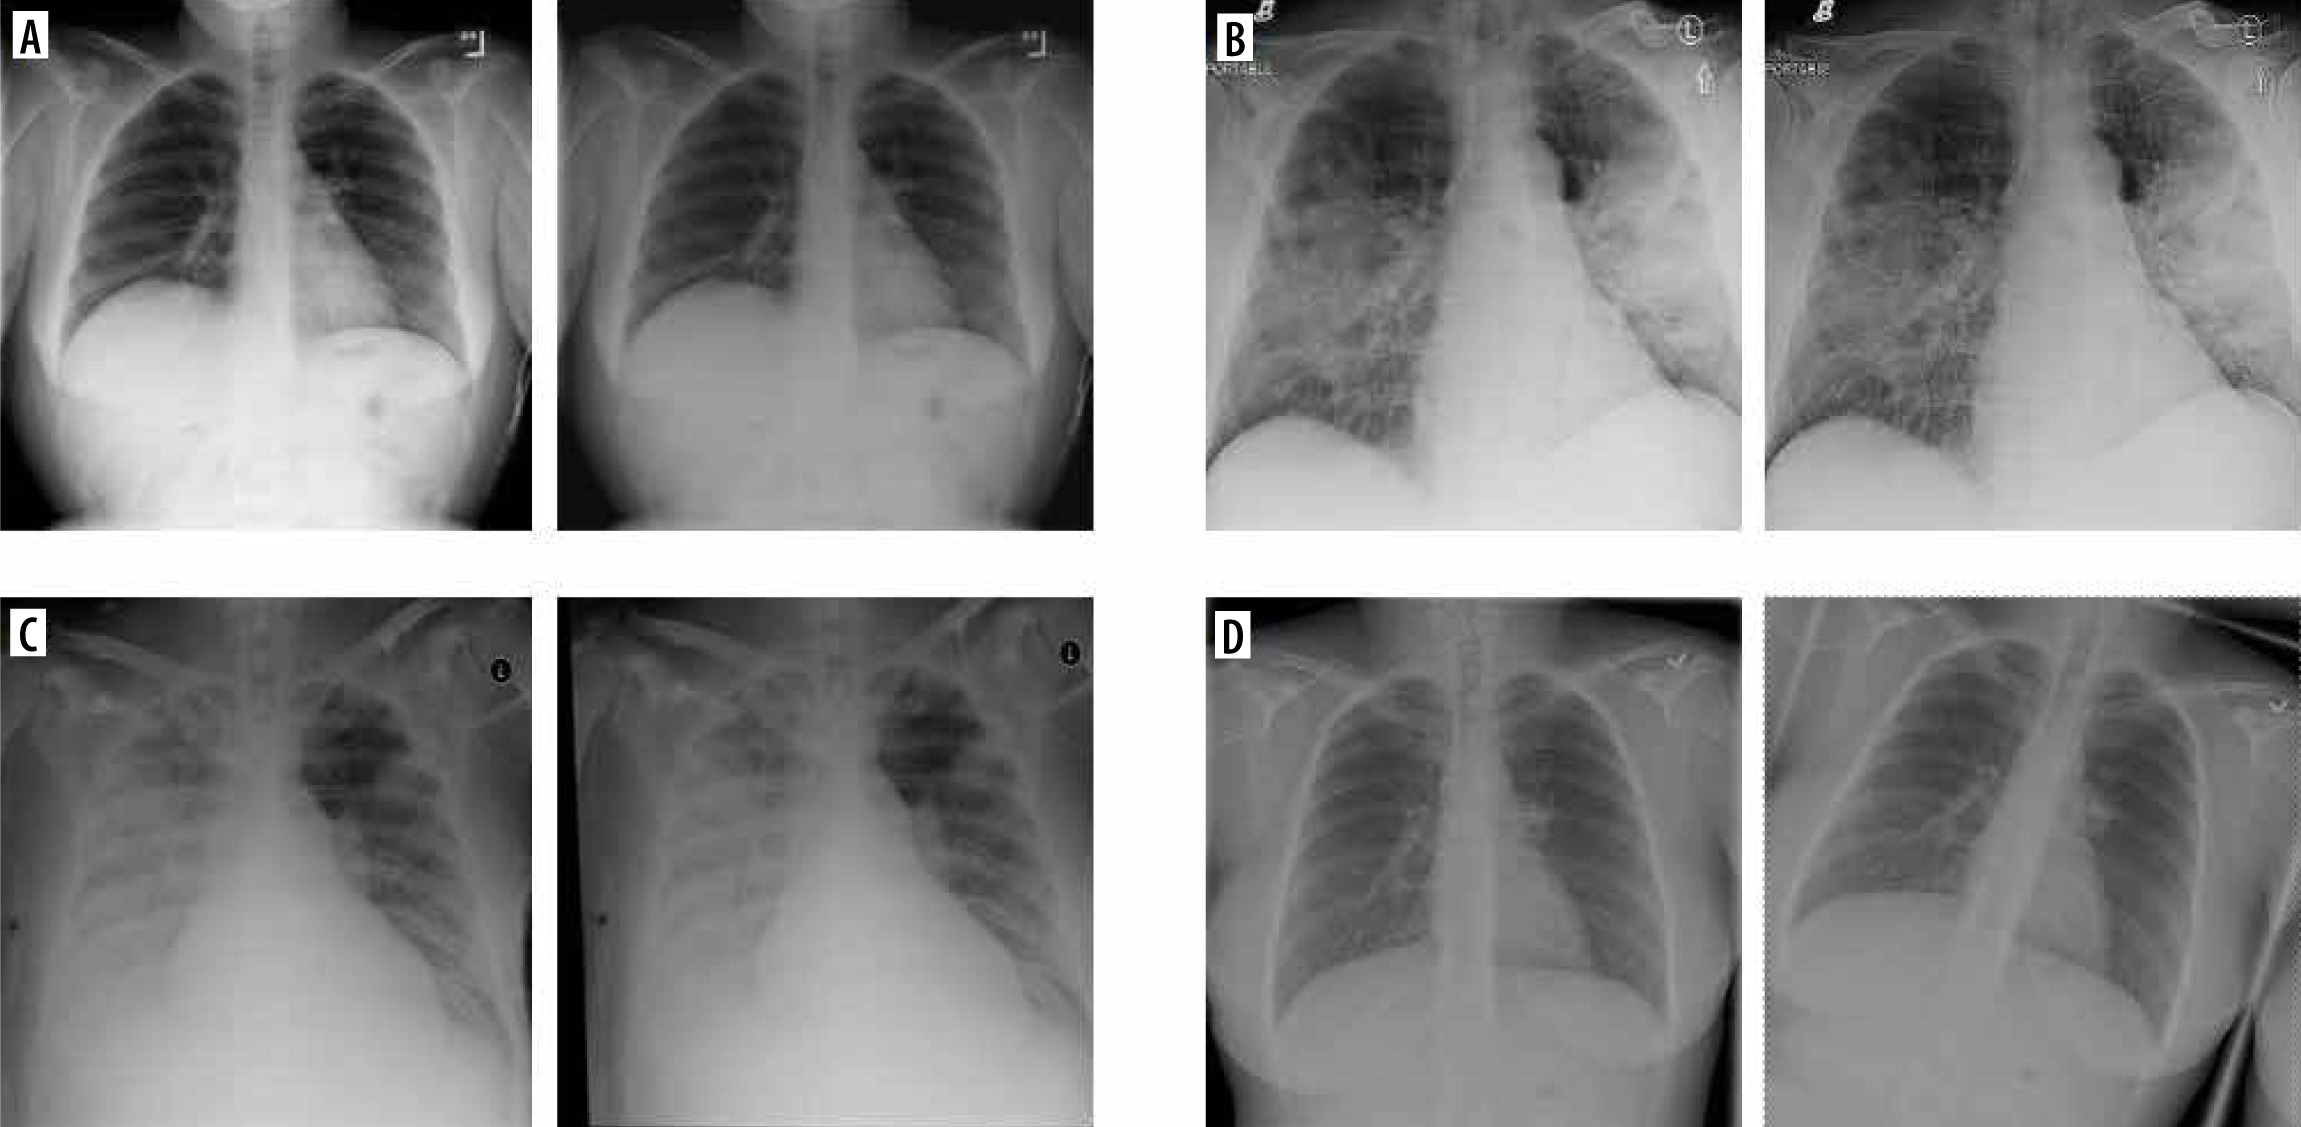
All the used methods come from the Albumentations library [4]. Models for each of the 7 groups were trained and validated independently. At each epoch, one augmentation was randomly (with equal probability) selected from among those available in the group. Only the training data were augmented. Examples of images created by augmentation are presented in Figure 2. In the forementioned Figure 2, baseline images with their modifications from selected group (G1 – colour modification, G2 – contrast and brightness modification, G4 – geometric operations, G5 – rotations) are given. As can be seen, the differences between the baseline and the modified image are sometimes difficult to observe with the naked eye. But, for the computer vision and understanding they are sufficiently different.
Figure 2
Examples of augmentation techniques. A) Baseline and modified images G1. B) Baseline and modified images G2. C) Baseline and modified images G4. D) Baseline and modified images G5
In view of studying the impact of augmentation me-thods, we decided to limit pre-processing methods to resize and apply masks with use of the pretrained segmentation model ResNet34 [5]. However, to evaluate the influence of masking on the classification metrics, we decided to run all experiments twice: with and without segmentation.
ML-based methods
The CNN was implemented for classification. To focus on the augmentation point of the research, a pretrained CNN was used – ResNet18 [5]. ResNet is a type of CNN, the popularity of which continuously increases, also in COVID-19 detection from X-rays [3,6-8]. The whole dataset (14,191 images representing healthy class and 16,194 images representing COVID-19 class) were shuffled and divided into training and validation subsets. Some more detailed experimentally set learning parameters were as follows:
Method evaluation
The method was evaluated on a pre-prepared hospital dataset available at https://github.com/UTP-WTIiE/Xray_data.git and previously described and used in [9]. Images from this dataset are anonymized, realistic data. They were obtained from Antoni Jurasz University Hospital No. 1 in Bydgoszcz, Department of Radiology and Diagnostic Imaging. A total of 62 chest X-ray images were obtained; 30 came from healthy individuals, and 32 came from COVID-19-positive patients, confirmed by a RT-PCR test. The images were provided in a raw form, without masks. The dataset was introduced and described in [9]. Each model in this research was evaluated using 4 validation metrics as follows: accuracy (Eq. 1), precision (Eq. 2), recall (Eq. 3), and F1-score (Eq. 4), which use the measures TP, FP, FN, and TN, as mentioned below. These metrics can be treated as a golden standard in ML-based studies. They can also help in comparison of the proposed method to the state-of-the-art results.
Results
All experiments were performed using the Nvidia Tesla with GPU support. Thanks to its enormous computing power, low price, relatively low demand for electricity, and the CUDA environment support, Tesla systems have become an attractive alternative to traditional high-power computing systems, such as CPU clusters and supercomputers. This kind of device can be extremely helpful in image processing, especially in medical diagnostics.
The results obtained from all augmentation experiments are provided in Table 1. All the evaluated metrics are given: accuracy, precision, recall, and F1-score. Clearly, the augmentations can improve evaluation metrics. For example, F1 metrics value increased from 87.5% (no augmentation, non-masked) to over 95% (mixed augmentations, non-masked). None of the proposed augmentation schema resulted in lowering the evaluation metrics. The most promising scenario both for masked and non-masked images was the last one, i.e. with mixed augmentations. It is also noteworthy that masking can significantly improve the evaluation metrics (raising F1 from 95.2% to 98.5%).
Table 1
The results obtained for the selected augmentation methods. The most promising results, achieved on masked data with mixed augmentation, are highlighted in bold
Discussion
The augmentation method can be a very important element of data pre-processing in the image analysis system, which improves the obtained results [10]. In this paper we presented the baseline schema of COVID-19 detection on lung X-ray images and improved it by proposing a very powerful augmentation technique. However, it should be mentioned that the utility of the augmentations vary; thus making some augmentations more useful and some less useful. In the proposed schema the most promising approach was to join all described groups and to implement them together.
In general, in the image analysis domain the augmentation can be performed by some image processing methods (classical augmentation) or by machine learning (ML) techniques, e.g. GAN (Generative Adversarial Network). The first approach is less complicated computationally but surprisingly effective. GAN-based augmentation was described by Bargshady et al. [11]. In this paper the CycleGAN architecture performed an image-to-image translation. Then, the whole augmented dataset was used for training the finetuned, pretrained Inception V3 network, resulting in an accuracy over 94% [11].
Another key AI-based element in our research is transfer learning. This is an approach extremely useful for image classification. It can be very powerful when the dataset is not sufficiently big. Moreover, using transfer learning allows the creation of a very complicated model without extreme computations. Transfer learning uses a pretrained network, making the learning process far shorter.
As described by Dogan et al. [12], the 3 most excessively used ML-based architectures in research concerning COVID-19 were: convolutional neural networks (CNN), random forest (RF), and ResNet. Whereas for large-scale image classification problems the most commonly used architectures were pre-trained networks: ResNet, UNet, VGG, Xception, GoogleNet, and XGBoost classifier.
Khan et al. [13] proposed the Deep Boosted Hybrid Learning (DBHL) architecture for effective COVID-19 detection in X-ray lung images. This approach used transfer learning and augmentation. The proposed framework was evaluated on radiologists’ authenticated chest X-ray data with satisfying results (accuracy = 98.5%, F1-score = 98.0%, and precision = 98.0%).
Rahman et al. [14] evaluated the importance of the pre-processing step of the ML-based system. Various transfer learning approaches (e.g. Resnet, DenseNet, InceptionV3) were compared with image enhancement methods, such as histogram equalization, contrast limited adaptive histogram equalization (CLAHE), image inversion, Gamma correction, and balance contrast enhancement technique (BCET). Because the used dataset was not balanced, the augmentation was implemented. For segmentation issues, the U-net architecture was used. It was observed that DenseNet201 was the best performing network for the segmented lung CXR images in COVID-19 detection using gamma-corrected samples. The network achieved accuracy of 95.11%, precision of 94.55%, recall of 94.56%, and F1-score of 94.53%.
Motamed et al. [15] used GAN (IAGAN and DCGAN) for augmentation and classification on a dataset from GitHub/IEEE and a second dataset of images of patients with pneumonia. The authors performed classification including 3 classes (healthy, pneumonia, COVID-19). For comparison, the authors performed standard augmentations using random rotations in the range of 20 degrees, width and height shift in the range of 0.2, and zoom in the range of 0.2. In this way, 8 new images each were generated, augmenting the dataset. On the COVID-19 dataset, the best ROC score obtained using IAGAN was 0.76, while the baseline was 0.74, and typical augmentation was 0.75. The approach presented by the authors therefore allowed a slight improvement in the results.
Nishio et al. [16] presented a classification method that use a pretrained VGG-16. The authors utilised an optimal combination of the 3 types of data augmentation methods (conventional method, mixup, and RICAP). Similarly to the above-mentioned studies, the dataset included X-ray images that were derived from patients representing 3 classes: healthy patients, COVID-19 patients, and patients with pneumonia. The authors achieved solid results, with an accuracy of 83.68% on testing data.
Sakib et al. [17] developed a custom CNN model. It was trained on real data and augmented data. The suggested DARI (data augmentation of radiology images) algorithm creates artificial X-ray pictures by using a combination of a specialized GAN structure and common data augmentation methods like zooming and rotation, which are chosen adaptively. The proposed solution achieves promising results: accuracy = 94.3%, precision = 95.3%, recall = 97.8%, and F1-score = 96.5%.
Narin et al. [18] compared some CNN-based models: ResNet50, ResNet101, ResNet152, InceptionV3, and Inception-ResNetV2, for different binary classification issues: COVID-19 vs. viral pneumonia, COVID-19 vs. bacterial pneumonia, and COVID-19 vs. healthy. The dataset was unbalanced and contained only 341 COVID-19 samples (80% for training and 20% for testing). The authors reported ResNet50 as the most promising for COVID-19 vs. normal classification, with the following results: accuracy = 96.1% and F1-score = 83.5%.
Ozturk et al. proposed a novel deep model, called DarkCovidNet, for early detection of COVID-19 cases using X-ray images [19]. In this approach a Darknet-19 model was used as a baseline. The proposed network had fewer layers and filters than the original DarkNet. Even though the dataset was limited, the authors did not use augmentation or pre-processing. The obtained results were the following: sensitivity = 95.13%, specificity = 95.30%, and F1-score = 96.51%.
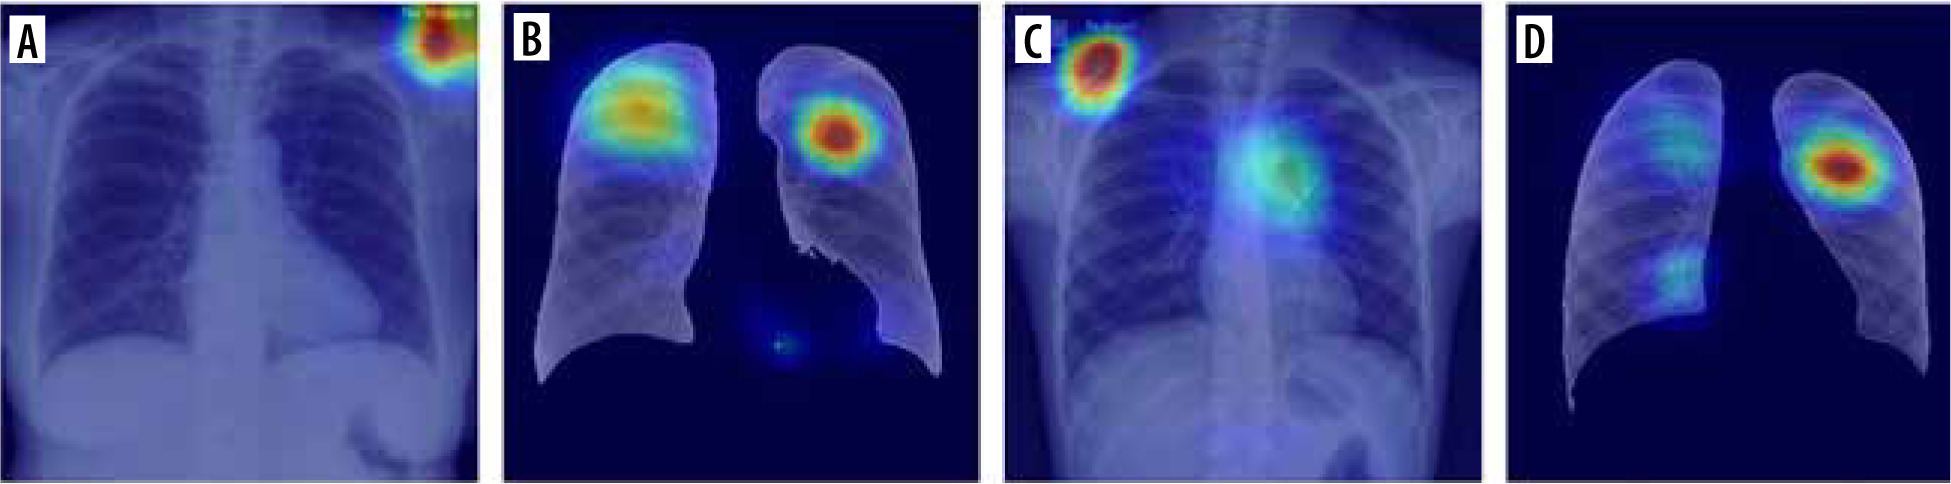
In Table 2 we present some results obtained from a lite-rature review. The table contains summarized results from several papers from the period 2020-2022 and their most promising proposed architecture. Because not all authors provided accuracy, precision, recall, and F1-score, only the accuracy is presented in the table. The comparison proves that the approach proposed in this paper is competitive compared to the other state-of-the-art solutions previously proposed. It is also possible that if the augmentation techniques were used in these approaches, their results could be more remarkable. Furthermore, Table 2 shows that the transfer learning technique is most often used in the case of X-ray image classificationApart from numeric metrics for model evaluation, it is crucial to introduce some explainability to the ML-based system [21,22]. Although AI models have achieved human-like performance, their use is still limited, partly because they are seen as a black box [23,24]. As presented by Jia et al. [25], the explainability in an emerging issue, particularly in ML-based healthcare systems. The problem with the use of AI-based tools in medicine continues to be the lack of confidence of medical professionals in such solutions and the perception that they lack the ‘intuition’ that experienced professionals possess [26,27]. The authors emphasized the role of explainability and its potential implementations: explanation by approximation, explanation by example, feature relevance explanation, and visual explanation. In our research we focused on visual explanation. In Figure 3 some examples of results obtained for selected samples are visually presented as a heatmap. These images show the points that attracted more attention from the network. As presented in section A of the figure, the main focus points are placed outside the lungs. It is significantly improved in section B. It should be noticed that the classifier focused on points inside the lung – there are some patterns suggesting lung changes caused by COVID-19. A similar situation is visualized in sections C and D of the figure: in section C the classifier focused more on points outside the lungs; in section D the focus points were improved.
Table 2
Accuracy comparison between the proposed and SOTA methods
Conclusions
Currently, there are 2 possible future improvements of the proposed schema. The first one is further explainability improvement so that the medical personnel can increase their trust the AI’s predictions. However, this issue is very (technically, mentally, and legally) demanding, and probably it is not possible to achieve this within 2 years. The second possible way of improving the proposed schema would be focusing on complexity reduction of the proposed schema. This would allow for reduction of energy consumption and a decreased carbon footprint of the performed calculations, which is still significant even though modern computers are extremely fast.