


Introduction
In recent years lung ultrasound (LUS) has developed rapidly, and it is growing in popularity in various scenarios. There are constant attempts to introduce it in new fields. In addition, knowledge regarding the lungs has been augmented by the recent pandemic. Unfortunately, this has led to many misconceptions [1]. Information concerning lines, signs, and lung profiles in this review is based mainly on D. Lichtenstein’s research and book “Whole body ultrasound in critically ill” [2]. We consider a huge chunk of this innovative work to be worth popularizing. Sonography requires an extensive hands-on training and some basic knowledge on the physics of ultrasound to understand the modality. Right now the examiners, especially clinicians after short courses, without knowledge of other techniques like CT or X-ray and without much experience in LUS, start to examine patients and make misinterpreted diagnoses. One of the basic findings is lung consolidation often interpreted as bacterial pneumonia, which is obviously not true and leads to unnecessary antibiotic therapy.
This sometimes results in bad habits. The aim of this review is to highlight lines, signs, and phenomena that can be presented by LUS in order to create a single, easily available compendium and promote consistency in LUS nomenclature. On the other hand, we feel that some of the lines are unnecessarily described as lines and have limited value. We are afraid that at some point the alphabet will be too short to name all findings. Some things are misunderstood, others untold, and signs are overused to describe findings. Therefore, we present our simplified suggestions on lines, add our comments, and discuss the usefulness of signs. Lastly, we share our comments on some applications and misconceptions of LUS.
Review
Lines
There were numerous hyperechoic lines described that can be seen when performing lung ultrasound. Lines are a result of a difficult propagation of ultrasound in the chest. Normal lung is strongly hypoechoic or anechoic in LUS. Some pathologies in the lungs result in echogenic lines or areas. In Table 1 we highlight the full extent of ultrasound lines based on the suggestions of D. Lichtenstein (Figures 1-6) [3,4]. Lines arise from the pleural line if not otherwise specified in the description.
Table 1
Lines that can be seen in lung ultrasound (LUS)
| Line | Characteristics |
|---|---|
| Pleural line | Strongly hyperechoic line made of parietal and visceral pleura, may not be distinguished from parietal pericardium at its level |
| Lung line | Line representing visceral pleura in case of pleural fluid |
| Shred/fractal line | Shredded line on border of consolidation and normal lung |
| A-lines (Figure 1A) | • Long horizontal lines • Usually strongly hyperechoic, fading vertically • Reverberations at regular intervals (approximately skin-pleural line distance) • First is A1, second A2, and so forth • If lines in similar length are visible between, they are named A’, A’’, etc. • Indicate presence of air |
| B-lines | Defined by 7 criteria (most B-lines meet all of them): • Ring down artifacts • Arise from pleural line • Usually strongly hyperechoic • Laser-like, well defined, narrow • Do not fade (usually reach end of the screen) • Erase A-lines • Move with lung sliding |
| Sub-B-lines | As B lines, but arise from lung line or from shred line |
| C-lines | Small consolidations |
| E-lines (Figure 6D) | • Mainly ring down artifacts, reverberations, refractions, and posterior acoustic shadowing • Arise from horizontal stripes of subcutaneous gas |
| F-lines (Figure 2A) | • Small • Punctiform/round/discoid/oblique • Weakly hyperechoic • Should not be confused with air bronchograms • Do not move with lung sliding |
| G-lines (Figures 6A, B) | • They resemble A-, B-, and Z-lines (G-A, G-B, G-Z-lines) • Arise from abdominal structures |
| H-lines (Figure 6C) | • Horizontal lines • Mostly strongly hyperechoic reverberations • Arise from bare probe • Show directly adjacent air |
| I-lines (Figures 4A, B) | • Short (max. 2-3 cm) reverberations • Hyperechoic (less than pleural line), fading • Move with lung sliding • More often seen with high frequency probes |
| J-lines | • Small horizontal lines • Usually strongly hyperechoic • Components of a vertical B-line (sum to make one) |
| K-lines | • Electric interference artifacts • Arise anywhere on the screen |
| M-lines (Figure 4C) | • Horizontal artifacts • Interspersing weakly and strongly hyperechoic, fading vertically • Sometimes arising in rib’s acoustic shadow • Seem to be reverberations |
| N-lines | • As B-lines, but hypoechoic • Probably refraction artifacts |
| O-lines | • No lines (no artifacts visible, “black ultrasound lung”) • May be encountered both physiologically and in pneumothorax |
| P-/Pi-/π-lines (Figures 1C, D) | • In same place as A, A’ lines, but shorter • Usually strongly hyperechoic, fading vertically • Reverberations at regular intervals • Nearly forming a vertical artifact • If seen, usually in thin people |
| R-lines | As B-lines, but arise from pericardium (at lung interface) |
| S-lines | • Said to be generated by pacemakers • Characteristic propagation (sinuous) |
| T-lines (Figures 5A, B) | • Vertical artifacts on M-mode • Frequency of heart rate • M-mode equivalent of lung pulse |
| U-lines (Figures 6A, B) | • Shape of inverted U • Strongly hyperechoic • Arise from and represent gas within colonic haustra |
| W-lines (Figure 6D) | Like E-lines, but multiple and chaotic (not aligned) |
| X-lines | Occurrence of “B-line” and A-line on same image (“B-lines” which do not erase A-lines) |
| Z-lines (Figure 2D) | • Vertical lines • Usually weakly hyperechoic • III-defined reverberations • Fade • Do not erase A-lines • Do not move with lung sliding |
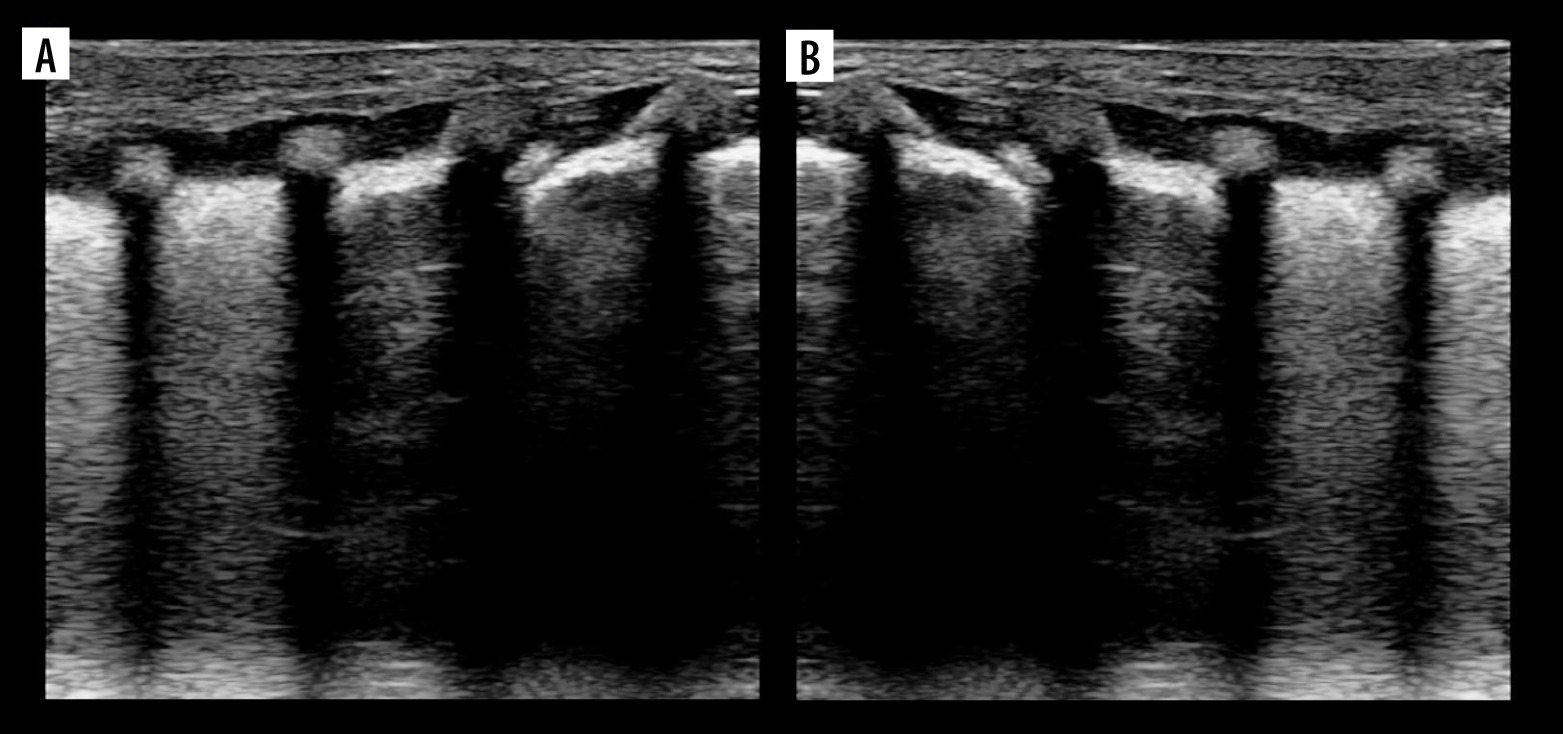
Figure 1
Ultrasound B-mode A- and Pi-lines. A) A-lines (white arrowheads). B) A-line (white arrow) and A’-lines (white arrowheads).Yellow arrowhead indicates pleural line. C) Pi-lines (white arrowheads) nearly forming vertical artifact. D) Pi-lines forming vertical artifact (white arrowheads), which should not be confused with B-line
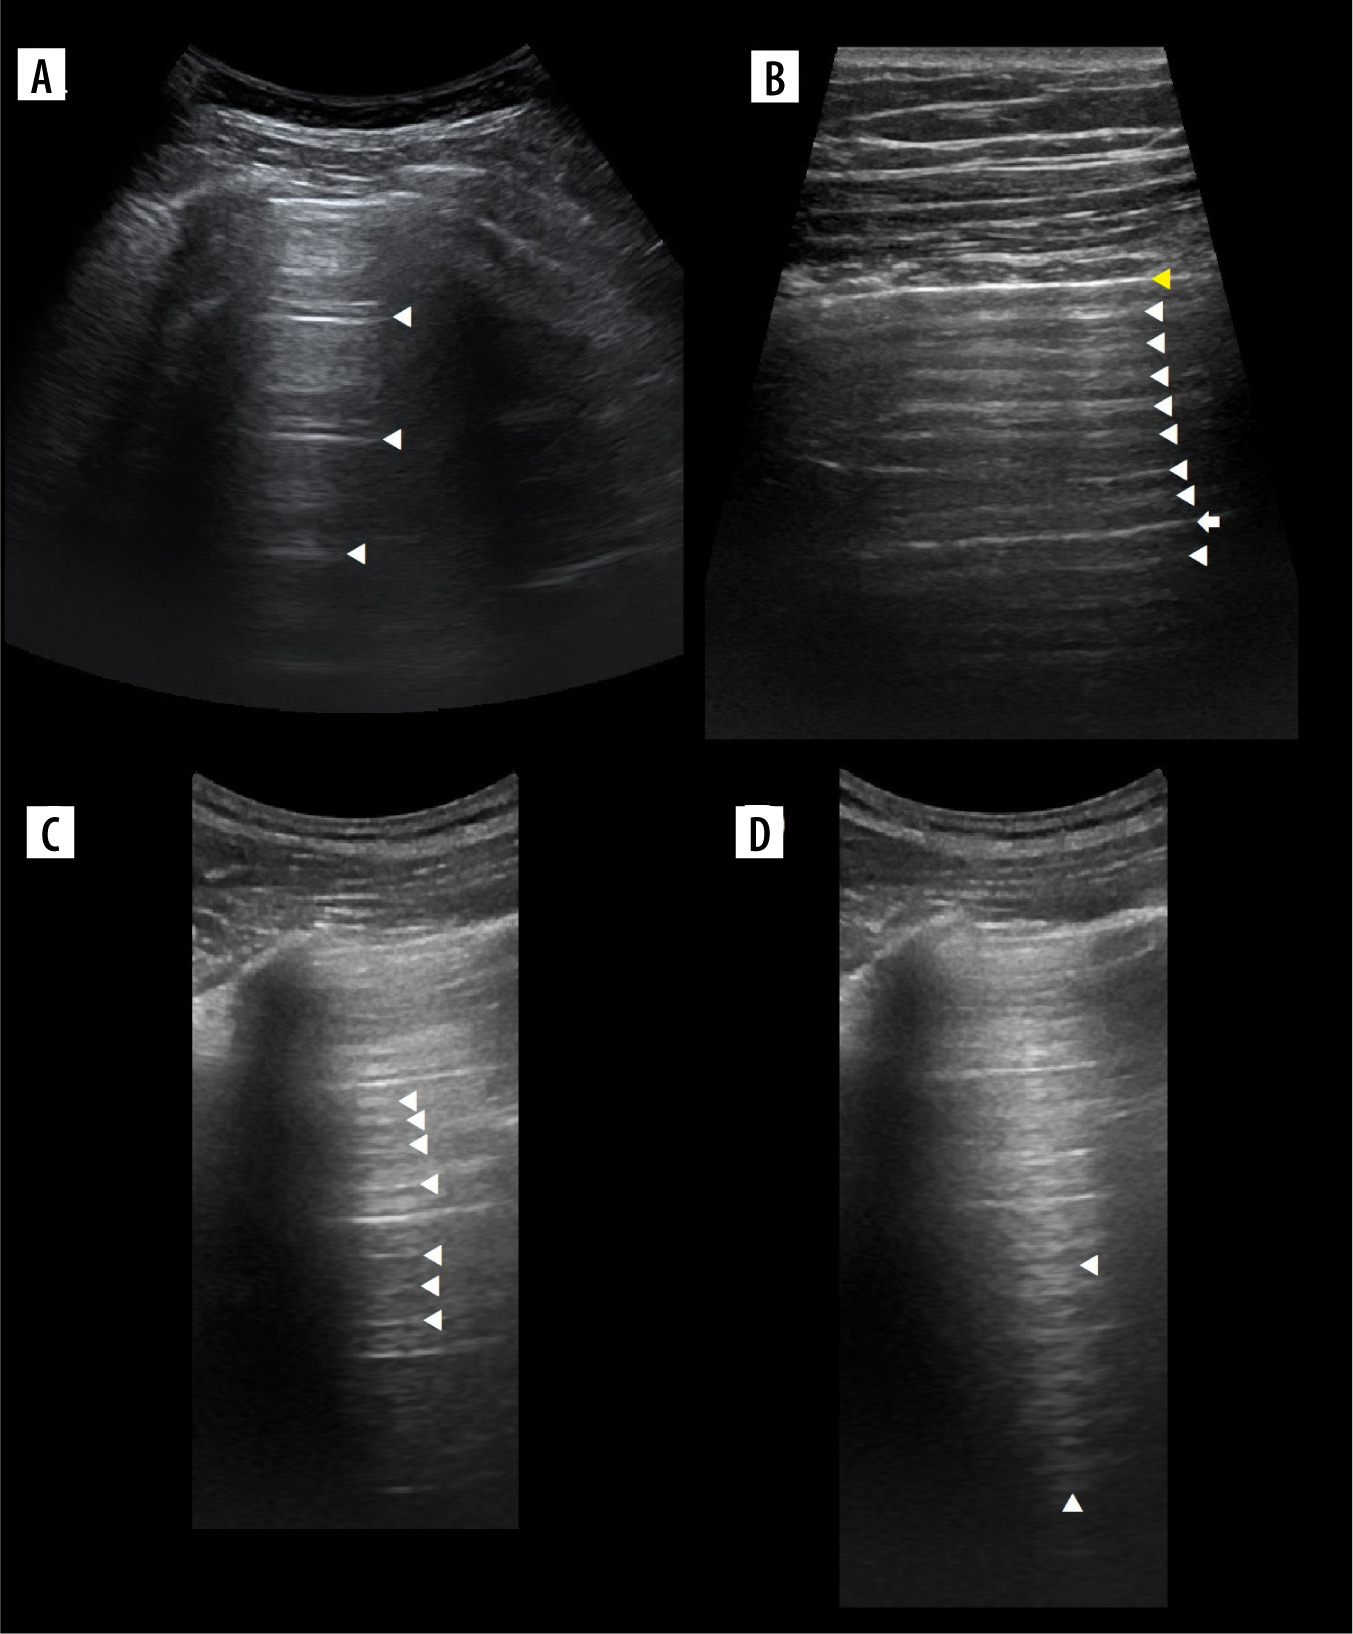
Figure 2
Ultrasound B-mode X-, J-, F-, C-,sub-B-, R-, and Z-lines. A) X-line (white arrowhead) not so obviously arising from pleural line, formed by many J-lines (white arrows). Note F-lines (yellow arrowheads). B) Small consolidation or C-line with confluent sub-B lines (white arrowheads) behind. Note small pleural effusion at the level of consolidation and hypoechoic pleura (yellow arrowhead) nearly confluent with consolidation. C) R-line (white arrowhead) arising from pleural-pericardial interface. D) Faint Z-line (white arrowhead). Note faint A- and A’-lines
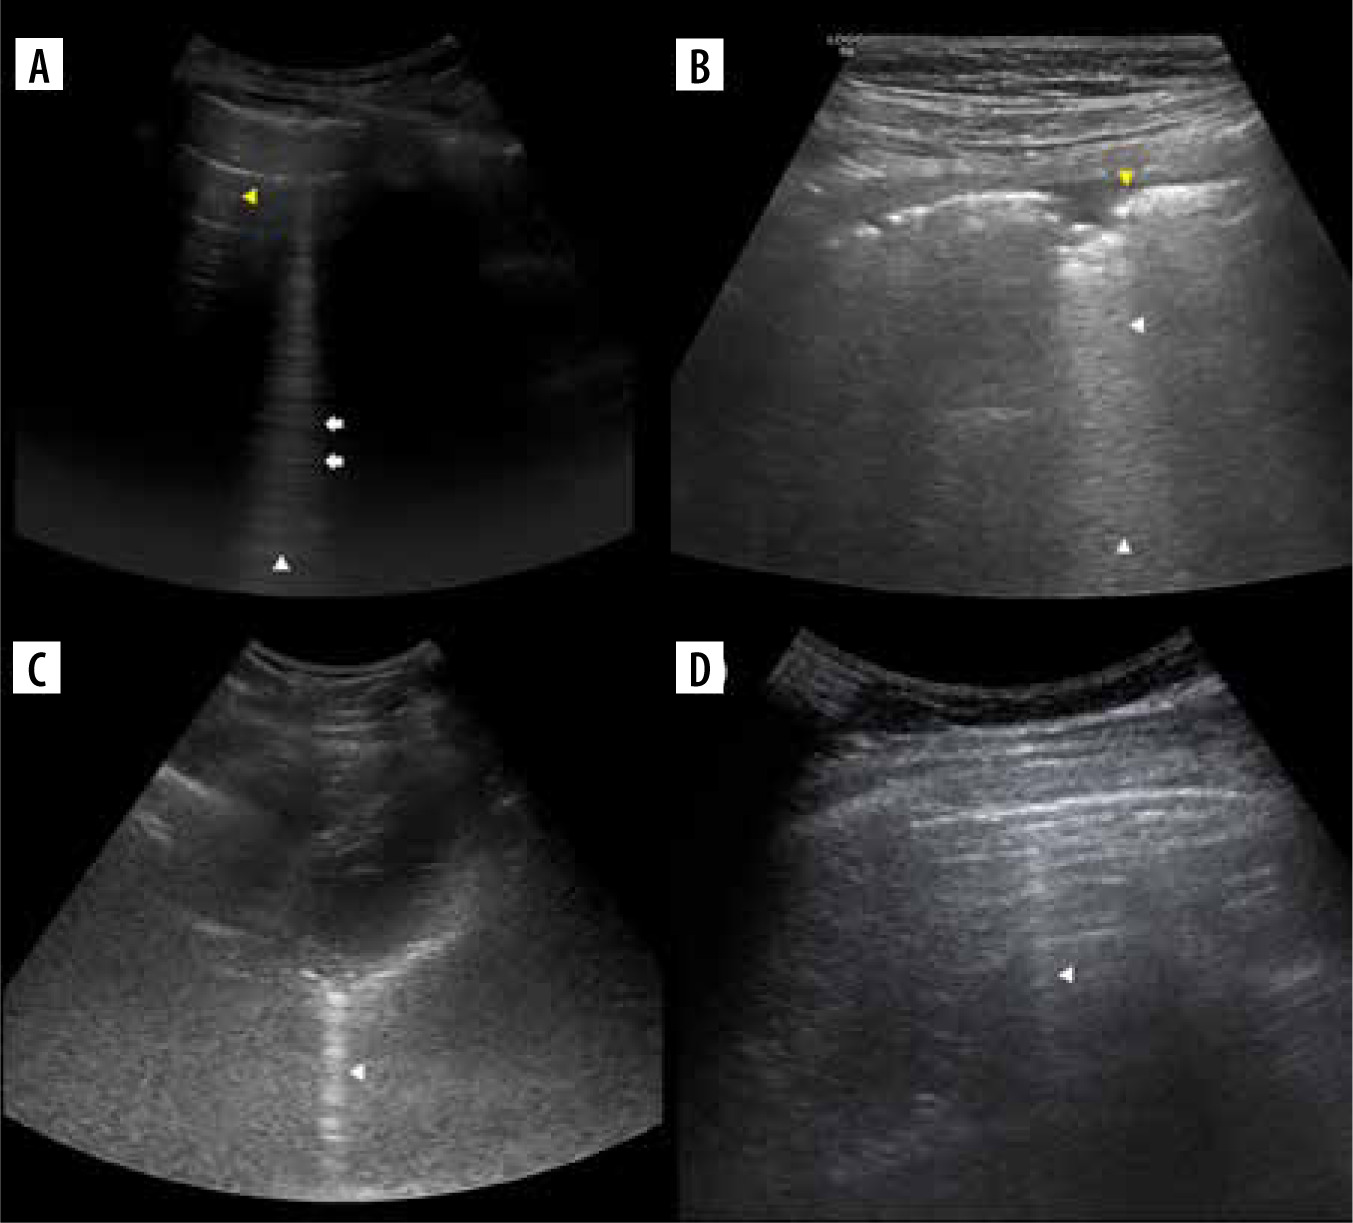
Figure 3
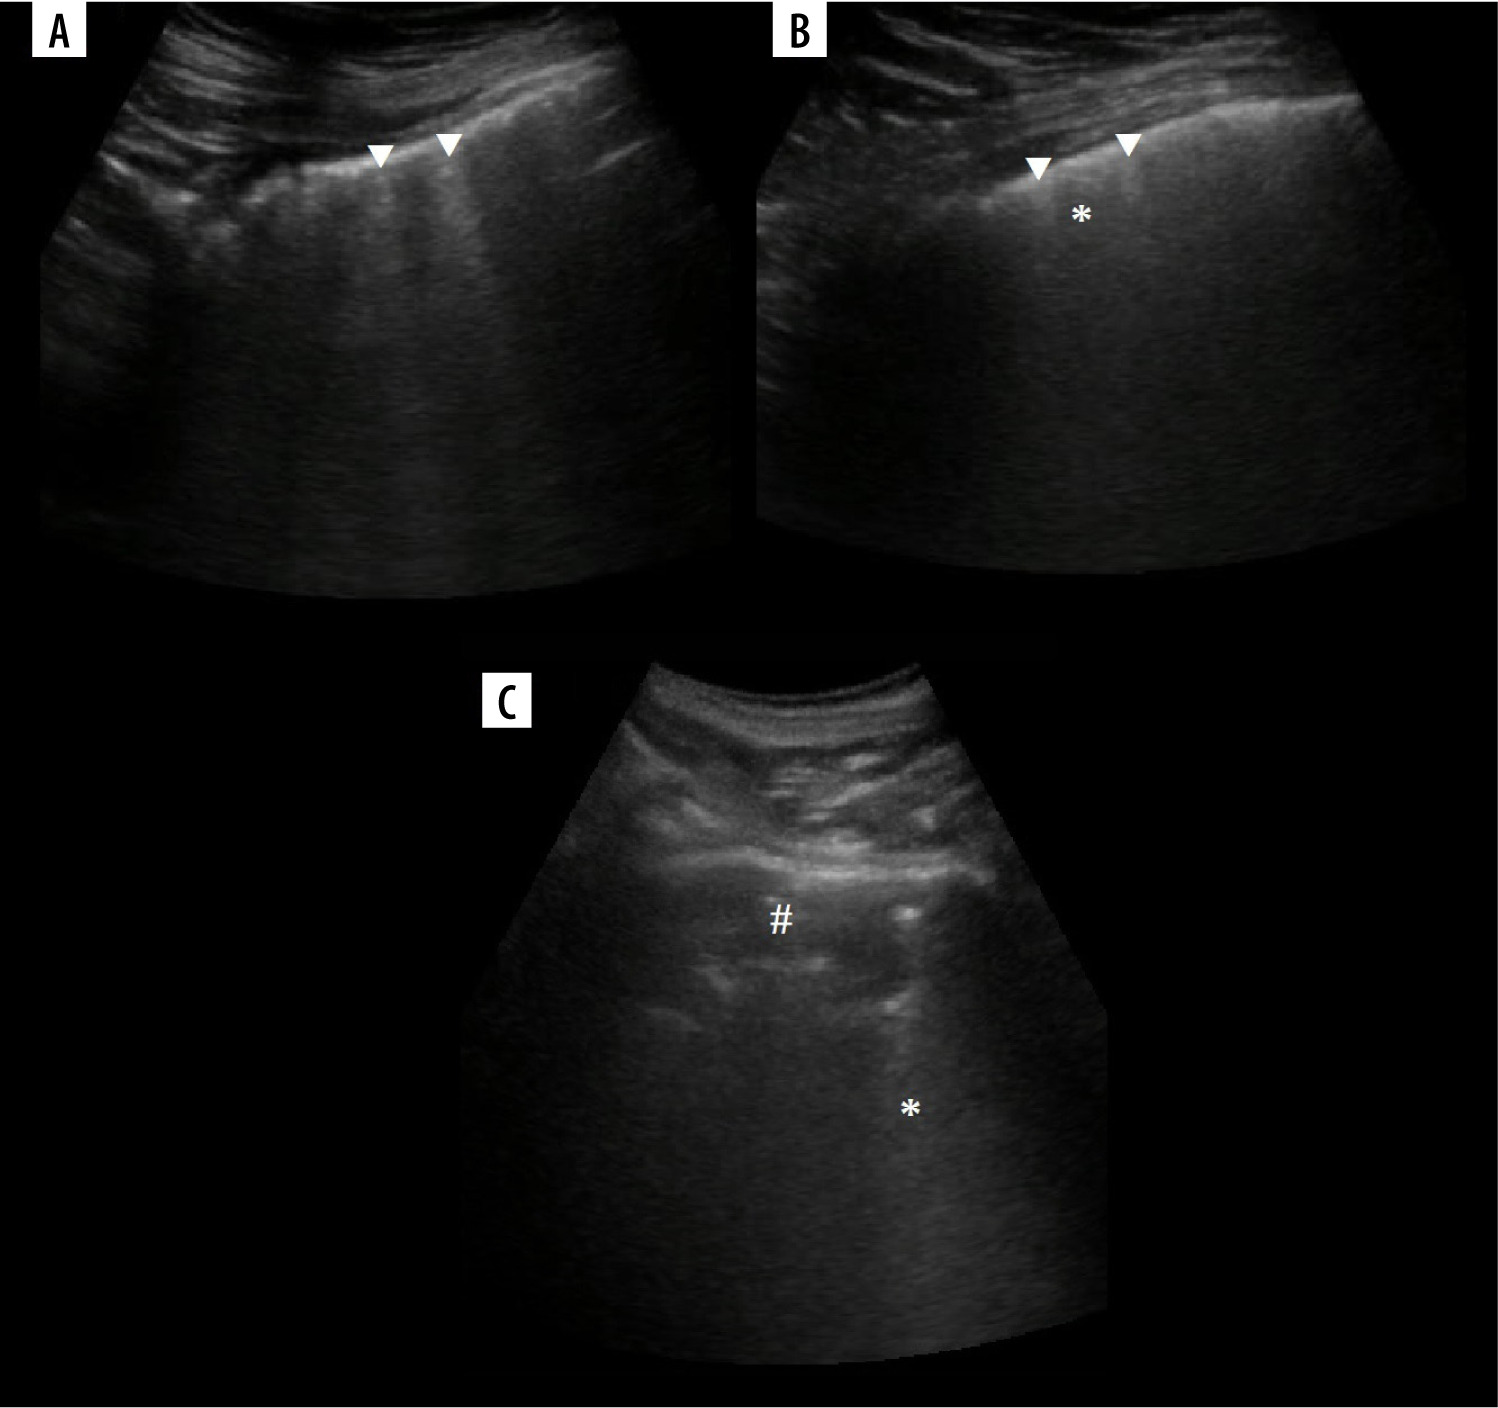
Ultrasound B-mode B- and C-lines. A) Two B-lines (white arrowheads) arising from diaphragmatic dome. Note mirror liver image and small pericardial effusion (yellow arrowhead). B) Ground glass (asterisk) in case of COVID-19 pneumonia. C) Linear probe. Ground glass (asterisk) and small consolidations (white arrowheads) in case of bacterial bronchopneumonia. D) Convex probe. Same as on C
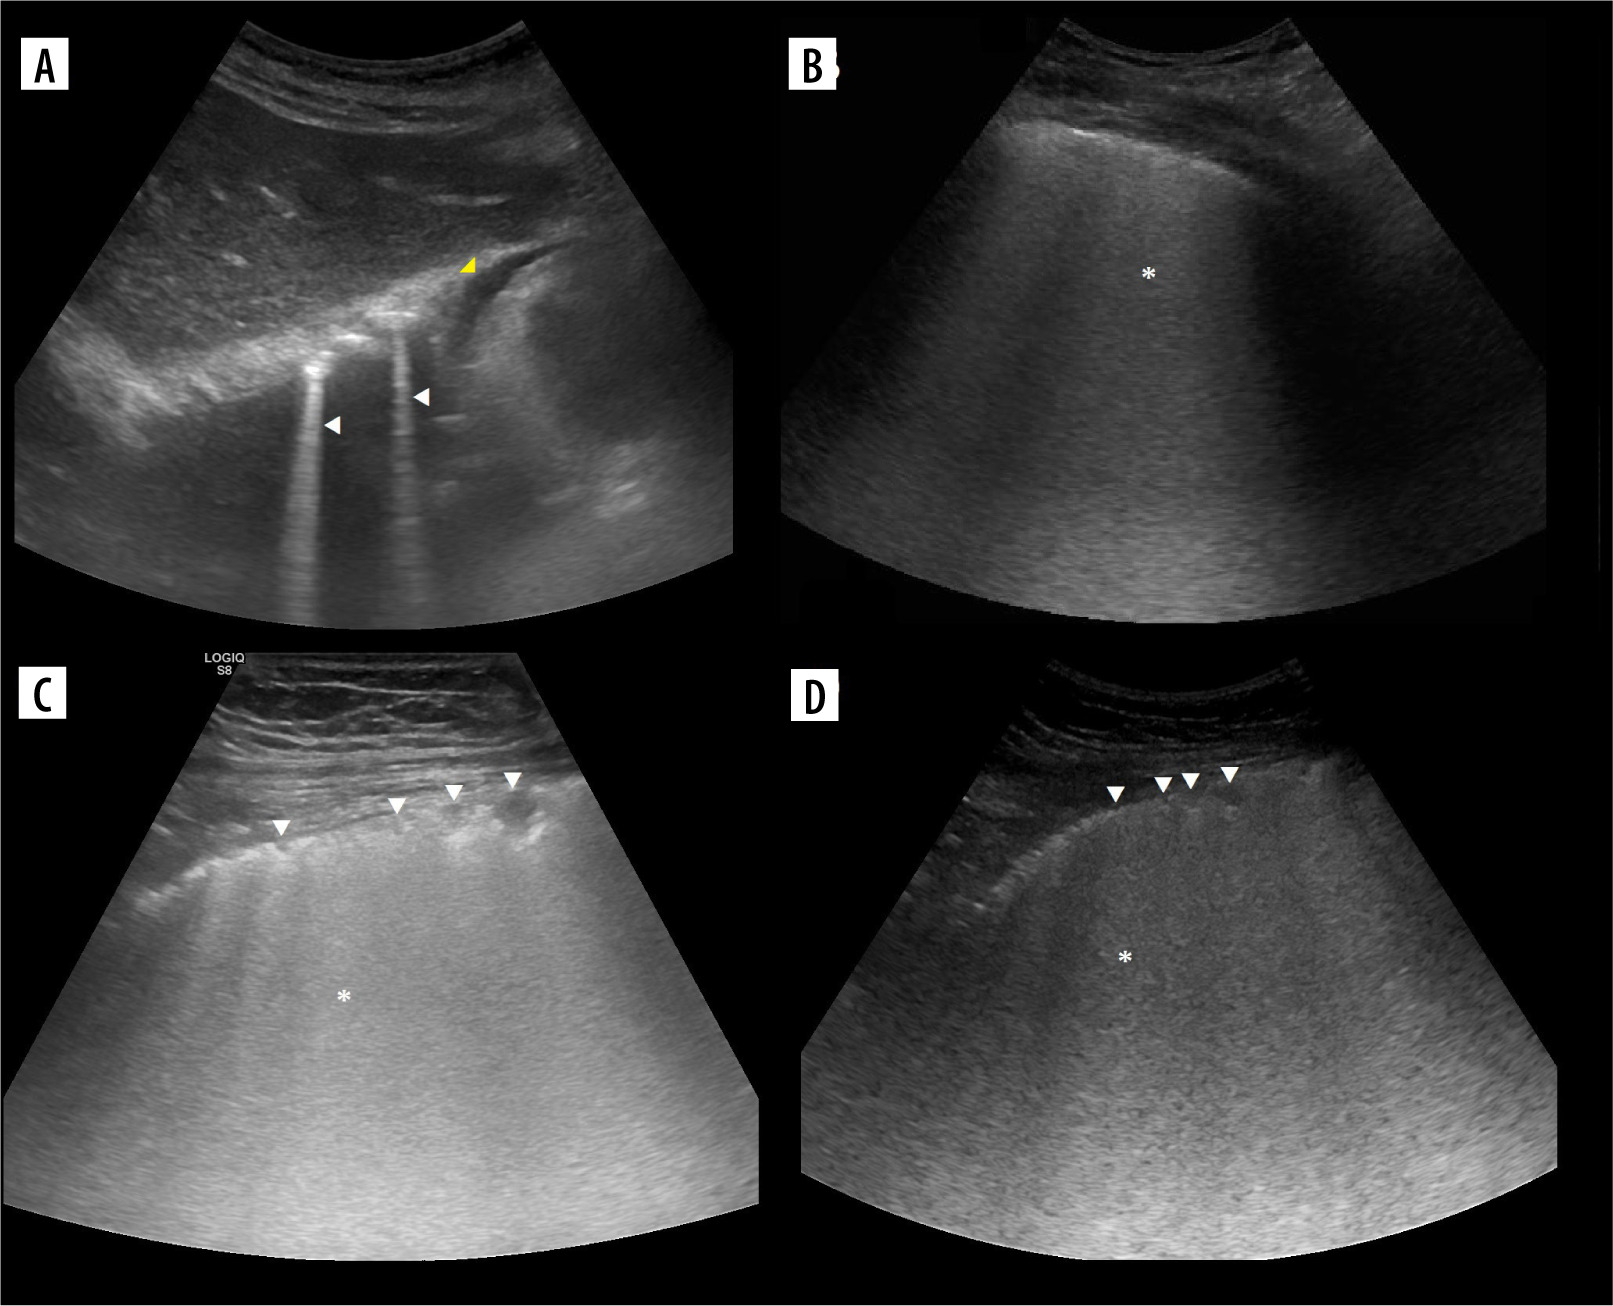
Figure 4
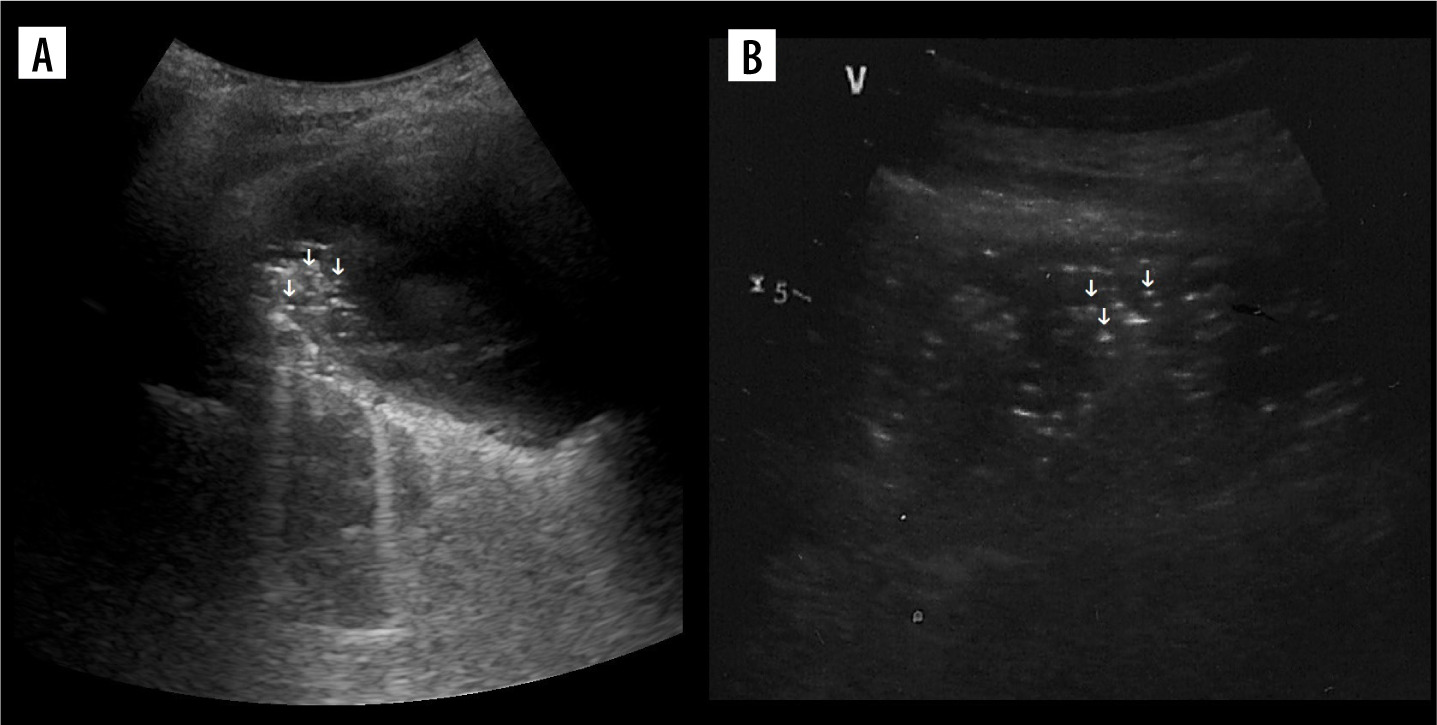
Ultrasound B-mode I-, N- and M-lines. A) I-line (white arrowhead). B) I-line (white arrowhead) combined with acoustic shadow resembling N-line (white arrow). C) M-lines (white arrowhead) in rib’s acoustic shadow
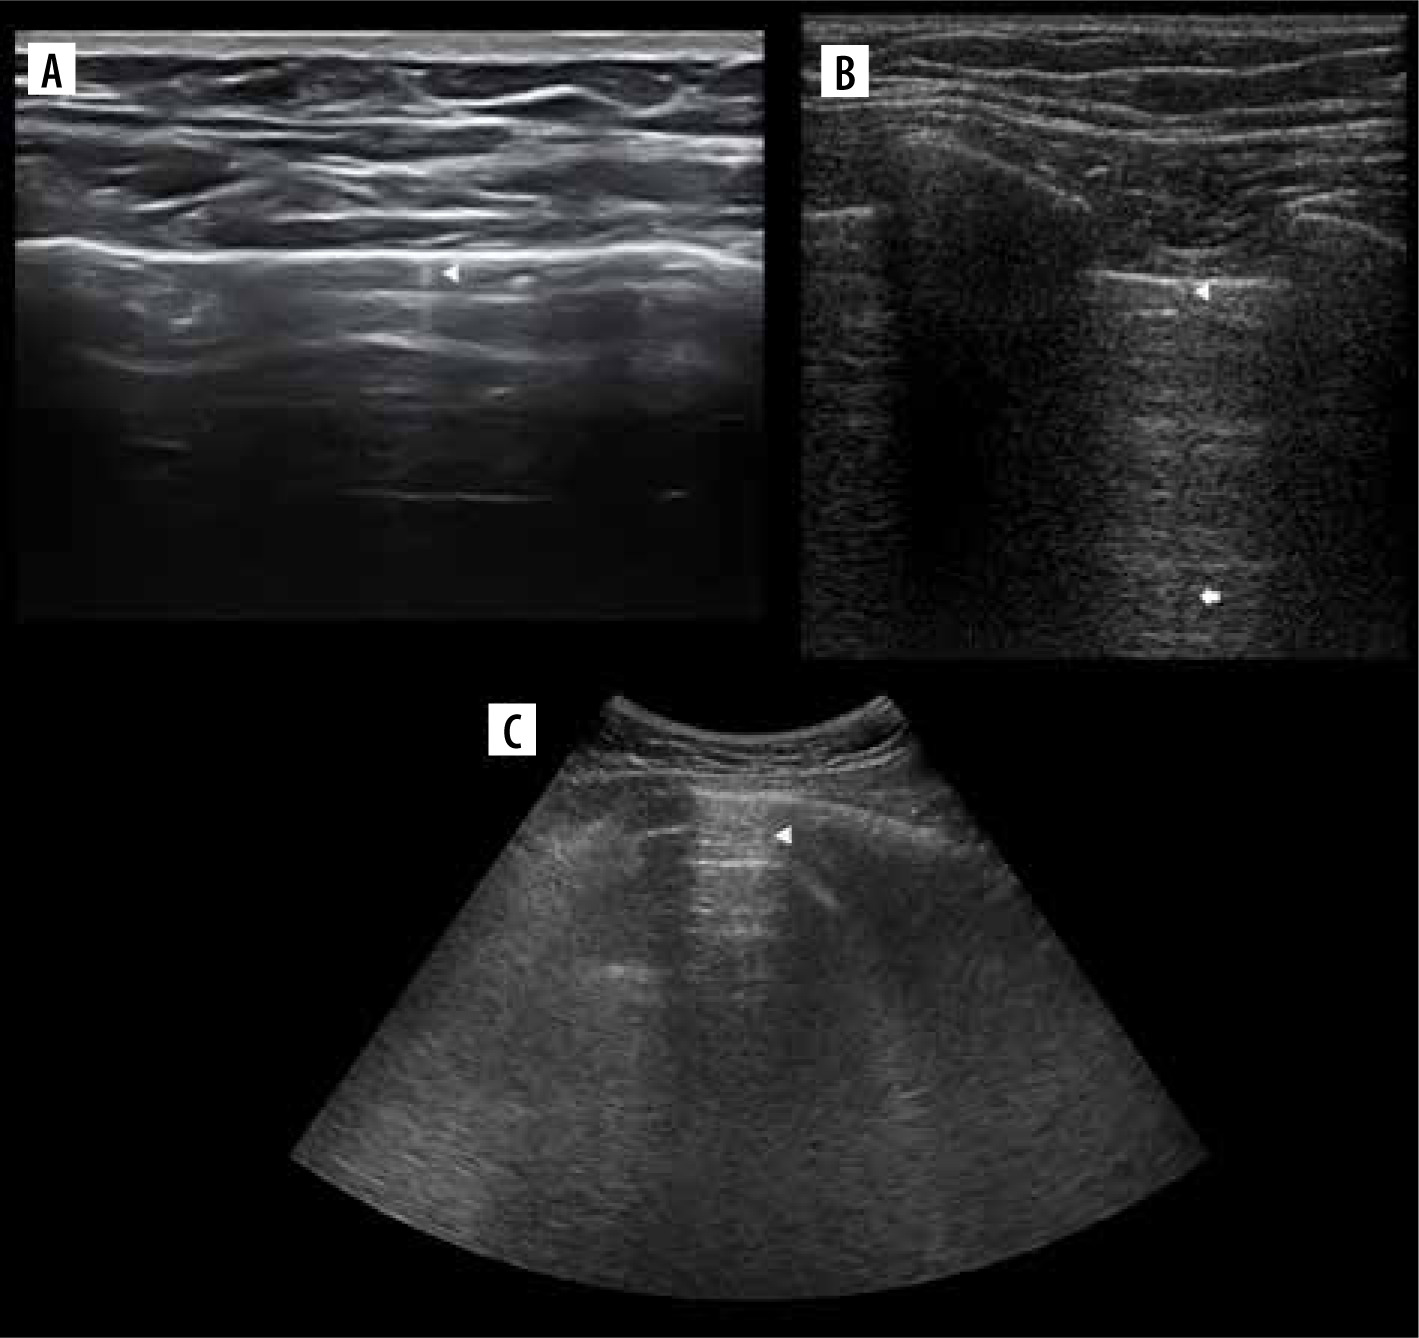
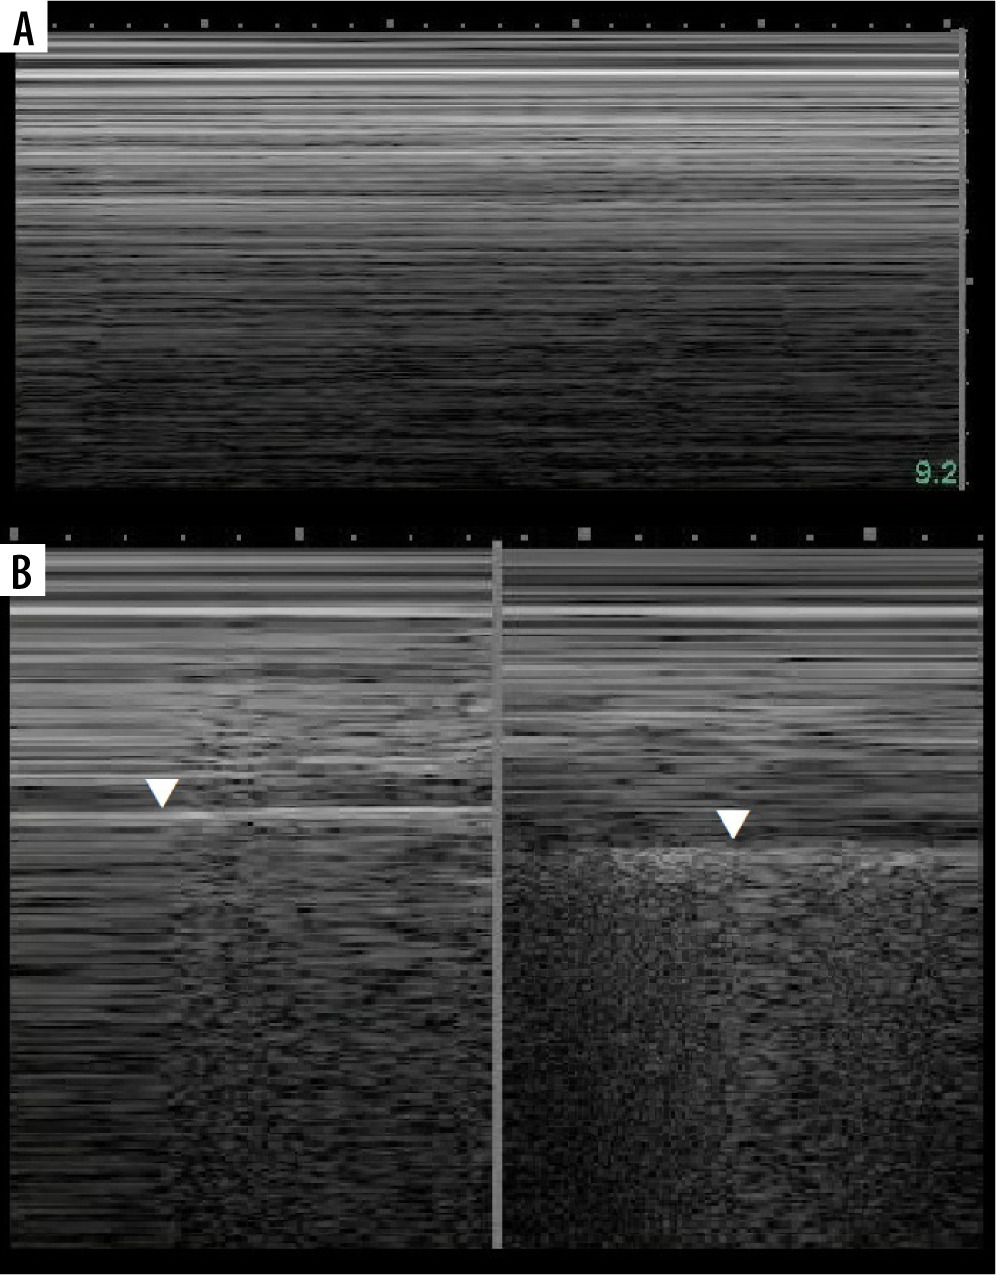
Figure 5
Ultrasound M-mode and B-mode. T- and O-lines, seashore and stratosphere signs (discussed later). A) Physiologic T-lines (white arrowheads) during apnoea on M-mode. There is interspersing seashore and barcode sign. B) Physiologic T-lines (white arrowheads) during apnoea (left, stratosphere sign), not present during breathing (right, seashore sign) presented in M-mode. C) Nearly black ultrasound lung. Note presence of faint A’-lines (white arrows), but not A-line (white arrowhead in expected place)
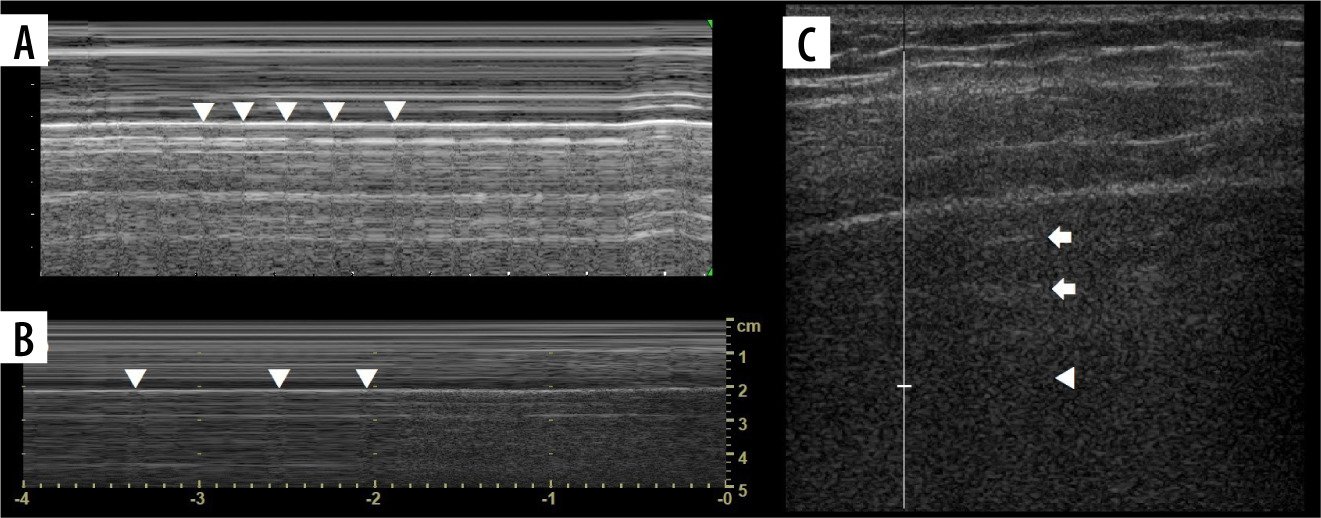
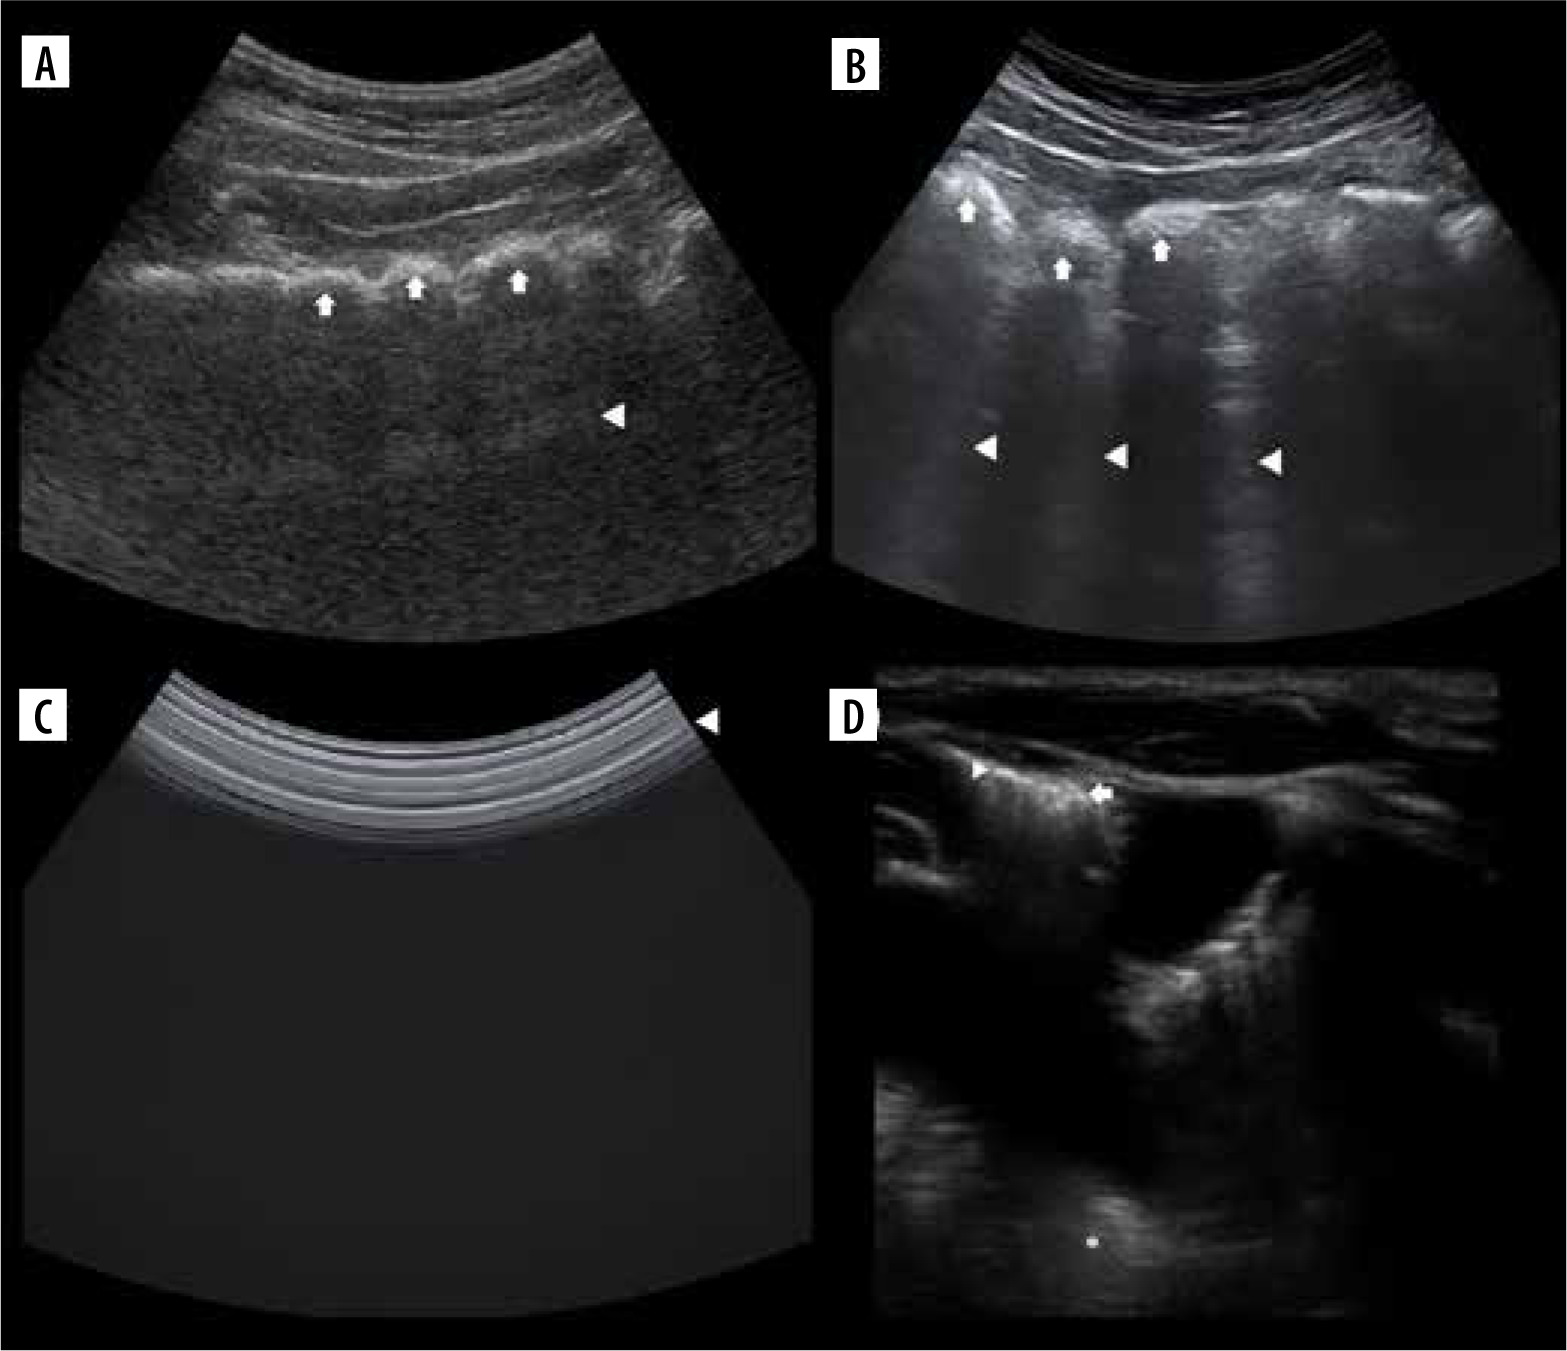
Figure 6
Ultrasound B-mode G-, U-, H-, E- and W-lines. A) G-A-line (white arrowhead) and U-lines (white arrow). B) G-B lines (white arrowheads) and U-lines (white arrow). C) H-lines (white arrowhead). D) E-lines (white arrowhead) becoming less aligned and forming W-lines (white arrow), lung (asterisk)
A-lines
The pleural line should be named the A0 line in A-line nomenclature, so that the next artifacts prior to the A1-line (next pleural line repetition, Figure 1B) can be named A0’, A0’’, and so on. It is in fact sort of A-line archetype. This is contrary to Lichtenstein’s suggestion of naming the O-line A0 line alternatively. Also, primes could be substituted with letters of the alphabet, so that last line prior to the A1 line in Figure 1B could be named A0g instead of A0’’’’’’’. We doubt if it will be useful anyway.
B-lines
Comet tail artifacts are usually described as short-range reverberations that taper distally and fade [5]. They were first described in 1982 in the case of a patient with shotgun pellets [6]. In this article artifacts arising from the chest wall were named ring down artifacts, but they were still thought to be reverberations at that time. A year later 3 authors of a former study described a wide variety of comet tail artifacts [7]. Naturally, knowledge about artifacts has changed over time. Another 2 years later ring down artifact described initially as reverberation turned out to be produced by resonant vibrations of fluid trapped within a tetrahedron of air bubbles [8]. To summarise, although there is a common belief among clinicians that the physical origin of B-lines is unknown or that they are reverberations, we believe they are ring down artifacts. Even though they also eventually fade, giving appearance similar to comet’s tail, they should not be called comet tail artifacts [9]. We see that there are already some attempts to further understand the variance of these artifacts [10].
There is one constant feature of B-lines: they are ring down artifacts. The rest is arguable.
Although they arise from pleural line, sometimes it is less evident (they still arise there, but it is nearly imperceptible, as in Figure 2A). At other times they may originate from somewhere other than the pleural line (sub-B-, R-lines; Figures 2B, C). They are usually strongly hyperechoic, but the intensity may vary (Figure 2). A narrow, usually very well defined, laser-like, but occasionally ill-defined B-line which even does not erase the A-line (X-line) may be encountered (Figure 2A). Reaching the end of the screen, not fading, but again the B-line will eventually fade, which sometimes happens after a relatively short distance. They move with lung sliding, which may be abolished. Such variance with additional unmentioned variance of the ring down artifact itself may be further studied and classified. There were some attempts [11], but its clinical importance has not been proven.
There are some terms associated with B-lines, variably useful, and some overlap:
bb-lines – 2 B-lines;
lung rockets – occurrence of > 2 B-lines between 2 ribs;
septal rockets – B7-lines – 3-4 lines, separated by 6-7 mm between each line (- represent thickened interlobular septa);
ground-glass rockets – B3-lines – 5-10 lines separated by 3 mm between each line (- represent ground-glass opacity);
B+ lines – septal rockets and/or ground-glass rockets;
Birolleau variant (similar to Figures 3B-D) – < 3 mm between, confluent, impossible to count (– represents ground glass opacity);
blinder variant – B-lines disappear during respiratory cycle (go off-plane);
vanishing B-line – B-line that appears or disappears suddenly, not explained by off-plane effect (spotting the very moment of creation or disappearance of a B-line);
pseudo-absent B-line – being in the scanning plane exactly between several B-lines, therefore appreciating none;
squirrel variant (similar to Figure 2A) – thick B-line (up to a third of the pleural line length).
Measurements are acquired on longitudinal scans in single Merlin’s space, which is the area between the pleural line, the end of the screen, and the ribs’ acoustic shadows. The distance between lines is in regard to adults and is used to measure the severity of interstitial syndrome.
In our opinion, both B7 and B3 lines represent thickened septa. Because the size of secondary pulmonary lobule is about 10-25 mm [12], thickened interlobular septa would be expected at such a distance rather than 6-7 mm. It is worth noting is that peripheral lobules are larger than those located centrally and cuboid/pyramidal in shape. Knowing that each secondary pulmonary lobule consists of 30-50 primary pulmonary lobules [13], the size of those could be roughly estimated at about 3-8 mm; therefore, such a distance (or lower) between B-lines would most likely also represent thickening of intralobular septa.
Thus B7, B3, or even denser separate lines may represent not only thickened interlobular but also thickened intralobular septa, and might correlate with increasing grade of oedema. It would be useful to re-verify the distance at which separate B-lines are found in interstitial oedema in various individuals. The best method for that would be a direct comparison of high-resolution computed tomography (HRCT) images of inter- and intralobular septal thickening with LUS [14]. It is possible that ultrasound is more sensitive to subtle changes. Ordinary CT might not be able to distinguish intralobular septal thickening from ground glass opacity. Some studies have tried to quantify congestion or oedema based on the number of B-lines [15-17]. Although there have been some attempts to quantify oedema on CT, no method utilizing the number of thickened septa has been proposed.
Conclusions from LUS exams must be constructed such that even clinicians unfamiliar with artifact nomenclature would be able to understand the core features found in the exam. This forces the operator to link the clinical image with the artifacts found. The Brilloux variant or confluent B-lines could be named simply ground glass, because it looks like such and is the equivalent of ground glass opacity on CT. Using names like ground glass would ease the understanding of LUS descriptions. It does not require the clinician to be familiar with an entirely new artifact nomenclature, it is based on something that is already well known from CT and may be further divided into patchy or diffuse. Similarly, we advocate naming multiple, nonconfluent B-lines simply as septal thickening, because they are always, even in case of fibrosis, literally thickened septa. The only problem is that ultrasound is rather blind to septal thickening superimposed on ground glass, although sometimes more prominent B-lines might be seen on a background of ground glass. It is yet to be studied, but represents either more dense ground glass, septal thickening on a background of ground glass, or both.
M-lines
Similarly to Pi-lines, they are described as horizontal artifacts, but they form vertical artifacts.
O-lines
A situation when there is no artifact visible is where we encounter O-lines. We propose calling absence of a particular A-line a single O-line (Figure 5C, where A’-lines are present, but there is no first A-line) or simply not naming them lung lines at all.
S-lines
According to Lichtenstein’s nomenclature, these are generated by large metallic structures, like pacemakers, and are vertical artifacts with characteristic sinuous propagation. We have never seen such or mistake them.
T-lines
The M-mode images before and after the T-line differ slightly, making the impression of 2 similar pictures glued together at the edges. This “glued” part makes a vertical line of the “T”, and it stops at the pleural line, which makes the horizontal line of the “T”. It is better appreciated if the background granularity of Merlin’s space dynamics is more evident. The circumstance when they might occur in the pneumothorax is explained in the lung point.
X-lines
Because erasing A-lines is in regard to longitudinal scans, we are unsure how to treat transverse scans. Sometimes the B-line erases a piece of the A-line or just attenuates it; therefore, in our opinion, it should be further studied.
Regarding line nomenclature
Our suggestion is that A-, B-, sub-B-, I-, J-, N-(sub-B-), Pi-(sub-A-), R-(sub-B-), T-, X-(sub-B-), and Z-lines should remain in the nomenclature. We find no reason to use rest of the lines. Sub-B-lines might be defined as those not filling all B-line criteria, named Bn (N-line), Bx (X-line), Br (pericardium), Bl (lung line), and Bc (consolidation). This would allow further wide classification of sub-B-lines that are different or linked with certain pathologic states. I-lines could also use subdivision, as shown in Figure 4B (In for I+N). The criteria of B-lines might also need a little reworking.
Lung profiles
They are utilized in BLUE (Basic Lung Ultrasound Examination [18]) protocol of acute respiratory failure. On each side there are 3 points of examination – 2 BLUE points in the anterior zone, which are easily localised by applying hands to the patient’s chest, and PLAPS (Posterior And/or Lateral Alveolar and/or Pleural Syndrome), which is precisely at the intersection of the posterior axillary line (although if possible, as posterior an approach as possible is advised to increase the sensitivity) and transverse plane at the level of the second (lower) BLUE point. Abolished lung sliding is marked by an apostrophe after the profile letter (A’ profile). Finding of A profile implements venous (free veins make V, deep vein thrombosis – DVT) and PLAPS analysis (positive if alveolar or pleural pathology is found at it).
Usage of such a protocol could limit the use of contrast-enhanced CT studies. Lung profiles are described in Table 2.
Table 2
Lung profiles
Signs and phenomena
In the old days, radiological language grew into flowery phrases, including “radiological signs”. Signs were described to suggest pathologies with some uncertainty. Contemporary radiological language should be less baroque and more specific, giving clinical diagnoses instead of impressions. Of course, this became possible with the introduction of more sensitive and more specific imaging modalities. However, the signs came back with the introduction of LUS. A brief summary of selected signs and phenomena that were reported in papers dedicated to LUS is presented in Table 3 [19-28].
Table 3
Selected lung ultrasound (LUS) signs and phenomena
Lung sliding
Lung sliding was initially described as respiratory excursion or gliding [29]. Sometimes it was also referred to as shimmering, glittering, or twinkling, which is a result of movement of multiple millimetre I-lines. It is movement of visceral pleura against parietal pleura and is best appreciated on longitudinal scans basally. It is more easily seen in the presence of B-lines or larger I-lines. Merlin’s space dynamics might also be appreciated, although this is usually more readily seen on M-mode. The sign is sometimes barely perceptible, but its presence rules out, and absence makes one suspect, pneumothorax.
Seashore and stratosphere/barcode signs (Figure 7A)
Care must be taken not to confuse muscle sliding (above the pleural line) with lung sliding (below the pleural line). Physiologically there is an end-expiratory pause, which will cause stratosphere sign in healthy subjects (Figure 7B). Sometimes lung sliding is very discrete, making little granularity (sand). Provoking the lung pulse may be useful in such instances. If stratosphere sign is present, sonographic confirmation of pneumothorax requires finding the lung point.
Lung point
Lung point (Figure 7B) may be localised [30], even in unusual locations [31]. In such situations it was proposed that it be called double lung point, but due to the overlap we would advise using the term localised pneumothorax, without the “new” sign. In a supine patient, more lateral (or then, posterior) lung point, indicates greater pneumothorax volume. In pneumothoraces where pleural contact is partially spared, parts of pleurae touch periodically to a greater degree, due to breathing and vibration. This makes it possible to register the lung point on M-mode while staying still. Lung sliding may be discrete at that point (as is probably the case in Figure 8, where we saw no apparent lung sliding on B-mode in the same spot, only on M-mode, repeatedly). This justifies periodic presence of T-lines and lung sliding, sometimes obvious only on M-mode, especially in thin pneumothoraces, like in our case.
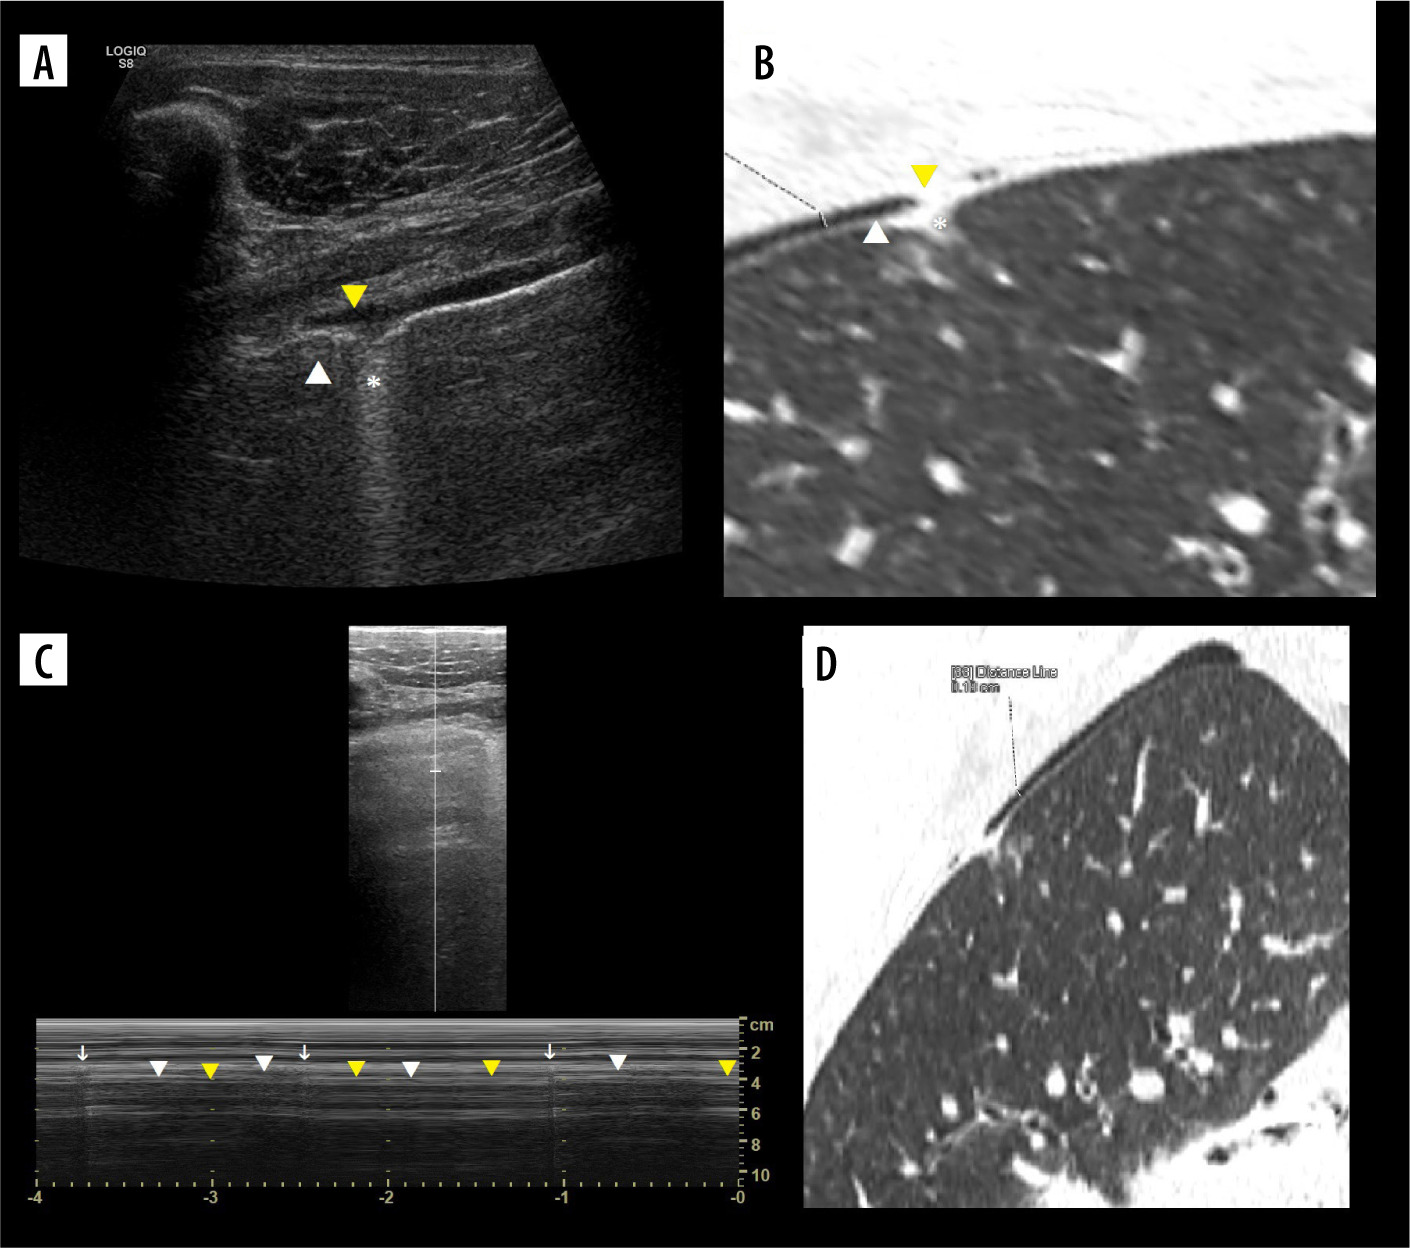
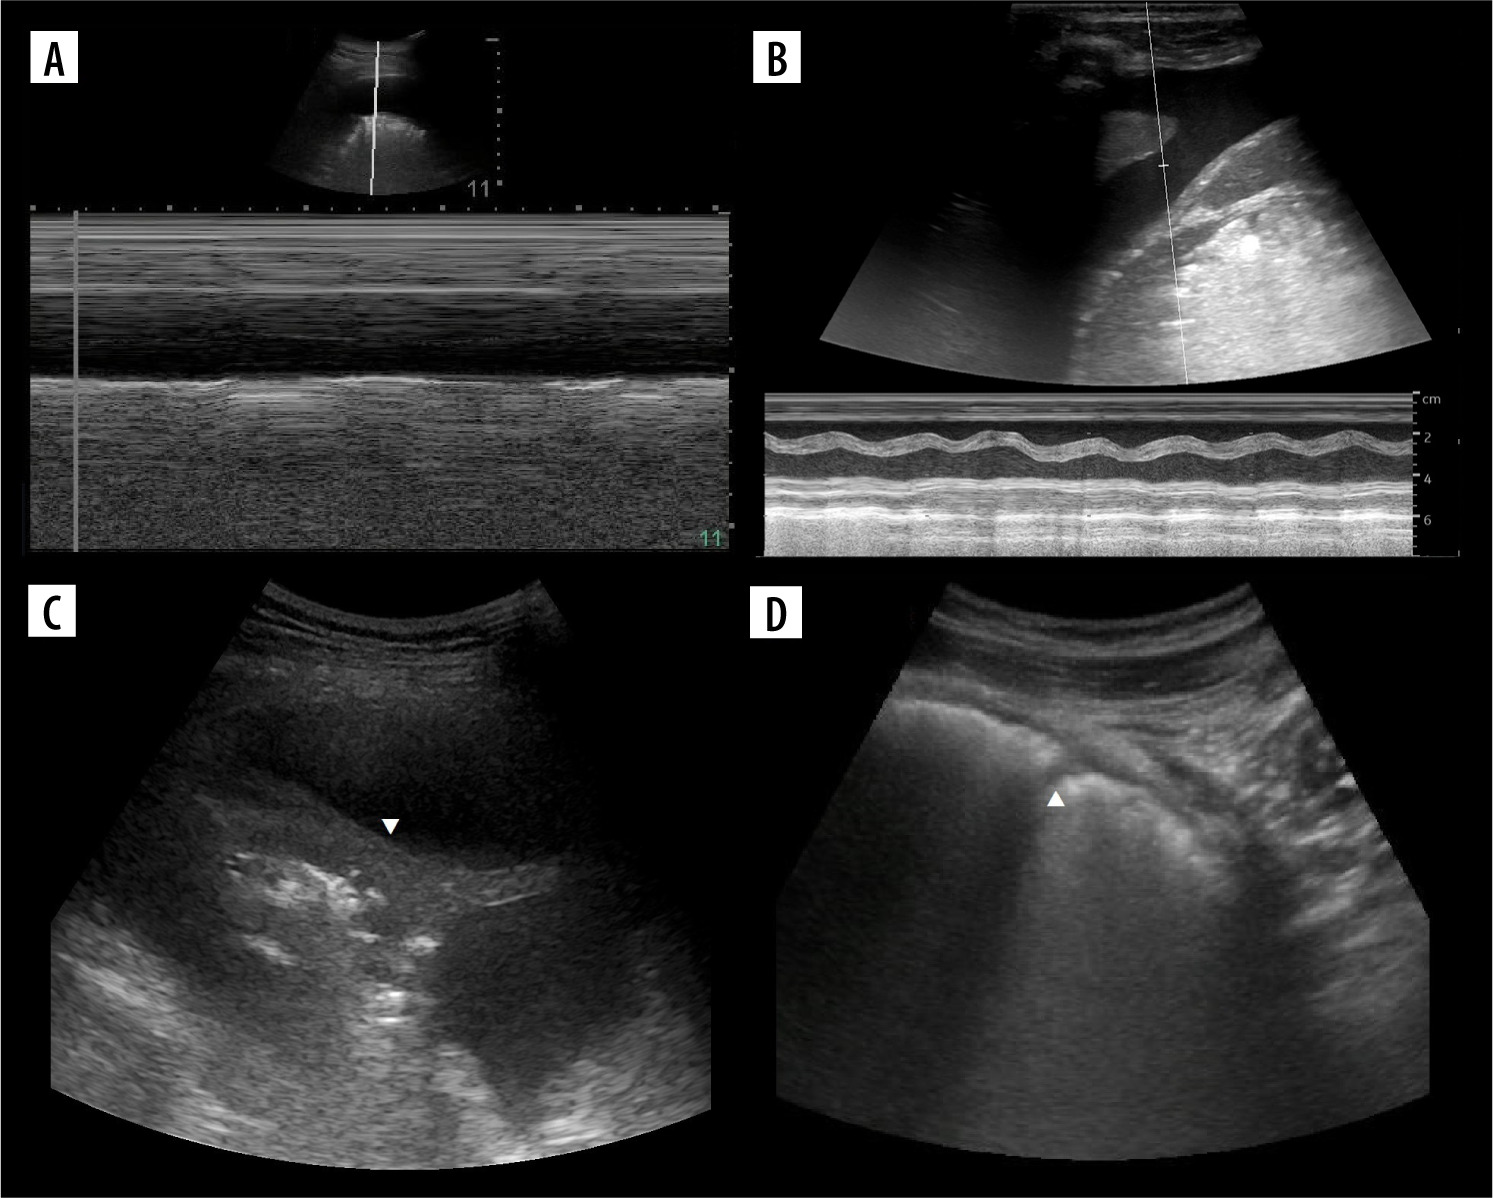
Figure 8
Case of simultaneous thin pneumothorax and effusion on lung ultrasound (LUS) and computed tomography (CT). A) Ultrasound B-mode. Pneumothorax (white arrowhead), effusion (yellow arrowhead), ground glass change (asterisk). B) CT equivalent. Pneumothorax (white arrowhead), effusion (yellow arrowhead), ground glass change (asterisk). C) Ultrasound M-mode interrogation of pneumothorax area. Note T-lines (white arrows) and interspersing seashore (white arrowheads)/stratosphere (yellow arrowheads) signs, without sharp border like in case of regular lung point. D) CT image in ultrasound scanning axis of right upper lobe with 1.8 mm thin pneumothorax
Double lung point (Figure 9B)
It was first described in transient tachypnoea of newborns (TTN), with high specificity, although severe TTN presents as white lung. An inversed sign may be seen, as in our case of TTN during recovery from white lung (Figure 9A). Double lung point may also be present in other aetiologies in adults, e.g. inflammatory changes.
Lung pulse
Initially, it was described in selective intubation with complete atelectasis, and later described in neonatal respiratory distress syndrome [32]. This sign rules out pneumothorax because it needs pleurae opposing each other. It may be of major benefit in excluding pneumothorax during poor ventilation. False positives with pneumothorax may be seen from pulsation of chest wall vessels like the internal thoracic artery [33] or by assessing the lung below, where there is no air between the pleurae. In the case from Figure 8 no obvious lung pulse in B-mode was seen. Physiologically observed in apnoea.
Air and fluid bronchograms
Crowded air bronchograms may be seen sometimes in atelectasis [34], for instance subsegmental resorptive atelectasis in the case of mucoid impaction (Figure 10). The dynamics of bronchograms should be assessed when staying in their longitudinal axes, so as not to confuse static air bronchograms moving with the lung as a whole with dynamic ones. The first study on dynamic and static air bronchograms assessed them in 16 cases of atelectasis and 52 cases of pneumonia. Dynamic air bronchograms were seen in 62% of pneumonias and 6% of atelectases, a remainder that both groups showed static air bronchograms. In the case of trauma, they favour contusion over atelectasis [35]. There are many other processes that can result in consolidation abutting pleura and showing air bronchograms, like alveolar oedema, compressive atelectasis, haemorrhage, infarct, organizing pneumonia, acute interstitial pneumonia, sarcoidosis, lymphoma, and carcinoma. Some of those might turn out to be dynamic because they have not yet been studied well. In the case of atelectasis due to obstruction with movable material, like a mucus plug, real time un-plugging would produce a change in the bronchogram from static to dynamic. Static air bronchograms occur more often in small airway atelectasis, but they are also common in pneumonia where both types can coexist. Fluid bronchograms may be encountered in cases of haemorrhage (along with air bronchograms [36]), oedema, infarctions, pneumonia, and mucus plugging. Naturally echogenicity of blood changes in time, if hyperacute, will be echogenic. Other fluids will be mostly anechoic. Finally, a total absence of air bronchograms in large consolidation without obvious explanation means resorptive atelectasis, most likely with central obstruction by a tumour or less commonly a foreign body [37].
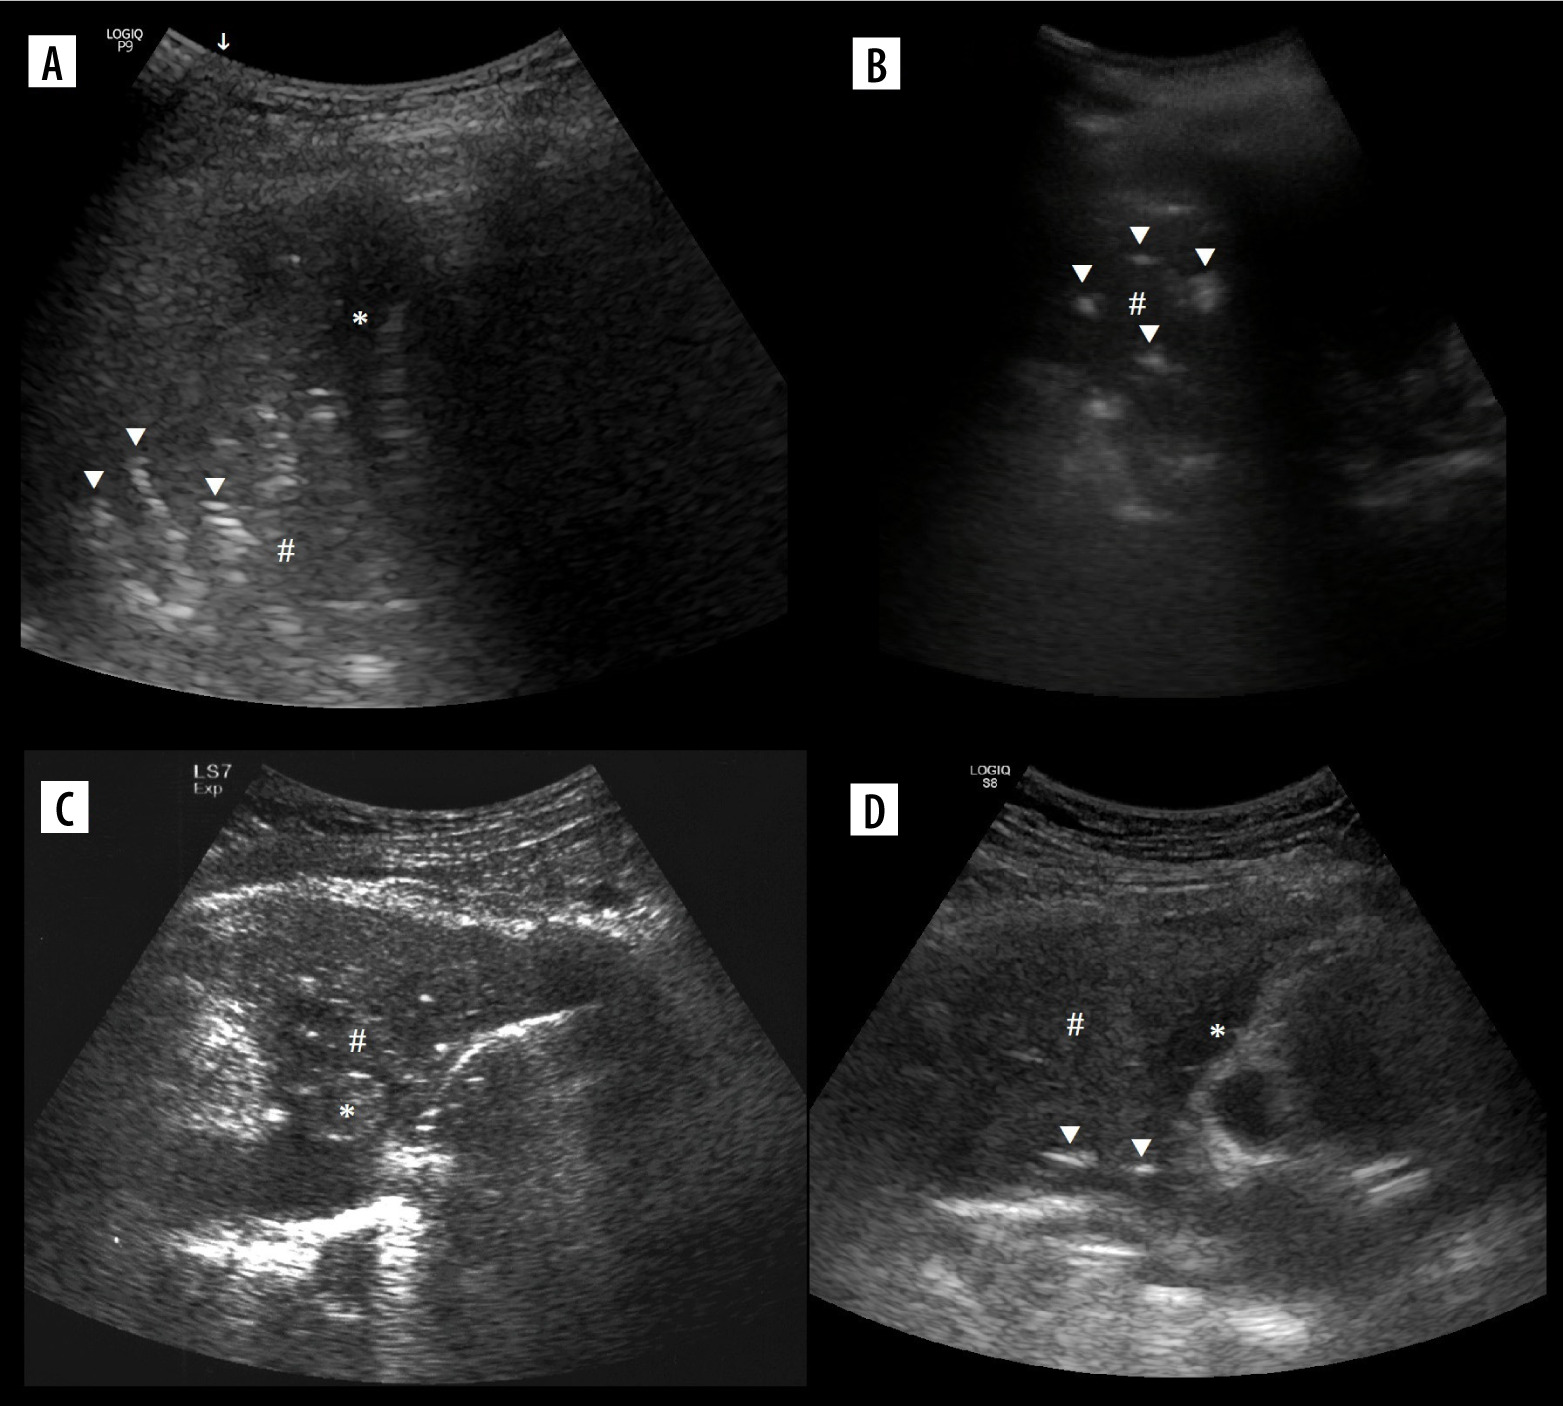
Figure 10
Ultrasound B-mode, consolidations. A) Bacterial pneumonia and atelectasis. Note branching air bronchograms (white arrowheads), effusion (asterisk), consolidation (hash) and artifact from air between probe and skin (white arrow). B) Aspiration pneumonia. Note consolidation (hash) with air bronchograms (white arrowheads), no effusion. C) Obstructive atelectasis. Note nodule (asterisk) at hilum and inhomogenous infiltrate (hash) with calcifications. Rest of atelectatic lung is relatively homogenous. Air bronchograms are absent. D) Combined obstructive atelectasis and neoplastic infiltration. Note that lung is relatively homogenous (hash). There are single air bronchograms (white arrowheads) and small effusion (asterisk)
Lung hepatization
Early A-mode studies showed that consolidation may be visualized on ultrasound [38]. From B-mode appearance similar to hepatic parenchyma, it was named lung hepatization.
It is relatively homogenous. The presence of round hypoechoic or anechoic fluid or gas-fluid collections imply abscesses [39], but it may be also seen in congenital pulmonary airway malformations [40]. Areas of necrosis are similar to abscesses but not so well defined. On Doppler interrogation, such lesions show no central flow [41].
Suspended microbubble sign
It is useful in differentiating some empyemic and nonempyemic hydropneumothoraces. A potential pitfall is positive sign within sterile haematoma (Figure 11A) or sterile necrotic collection. Therefore, in our opinion the usefulness of this sign is mainly in ruling out transudate.
Plankton sign
This sign rules out transudate and implies blood as a possible source. In bloody exudates a haematocrit effect may additionally be seen – it is sedimentation of blood cellular components sometimes seen in haematomas, although more often described in modalities other than ultrasound [42].
Jellyfish sign (Figure 12C), sinusoid sign
Their absence indicate viscous exudate (Figure 12A) or encapsulated fluid, alternatively pleural adhesions or even trapped lung [43]. With low tidal volume the amplitude may be reduced (Figure 12B). We believe the amplitude should be further studied.
Figure 12
Ultrasound M-mode and B-mode of effusions. A) Nearly totally absent sinusoid sign in case of exudate. B) Small (due to low tidal volume) sinusoid sign in case of transudate. C) Jellyfish sign (white arrowhead). D) Small effusion, partially in major fissure (white arrowhead). Note irregularity due to small compressive atelectases and ground glass change – also due to atelectasis (image of B-lines is not so evident due to harmonics, discussed later)
Comment on applications and misconceptions
Lung ultrasound was enthusiastically accepted by some clinicians, especially anaesthesiologists. It was considered as an alternative to plain radiographs (which have limited sensitivity and specificity) and to CT (which requires complicated transportation of the patient to a radiology department). However, due to the growing number of features in LUS terminology, this technique became somehow complicated.
Therefore, some limitations of LUS must be underlined. Firstly, some technical aspects should be strictly followed when performing the exam [44]. Most important are switching off harmonics (Figure 13), spatial compounding (cross-beam), and using an appropriate probe and frequency, depending on what is to be visualized. Setting focus at pleural line, speckle reduction, time-gain compensation, edge enhancement, and dynamic range seem to be less important. We also advise using a single focal zone, to keep the frame rate as high as possible. Scanning should be started with longitudinal axis, to quickly and surely locate the pleural line, but we also advise using transverse scans in a regular exam because they allow more artifacts to be seen during a single respiratory cycle. One also has to keep in mind that most of time only the periphery of the lung may be sufficiently visualized.
Figure 13
Ultrasound B-mode harmonics effect on B-lines. A) Acute exacerbation of interstitial lung disease, fibrotic part, faint B-lines (white arrowheads). B) Acute exacerbation of interstitial lung disease, ground glass part. Note how short are either confluent (asterisk) or more prominent (white arrowheads) B-lines. C) Pleural thickening with associated consolidation (hash) in the apex. Note faint confluent sub-B lines (asterisk)
We agree that in longitudinal scans head-to-the-left is proper position, but we also understand that going upside down or off a certain plane may feel more comfortable and practical in some situations.
As usual, best differentiation of consolidations, between pneumonia, atelectasis, and numerous other causes is possible only if the clinical image is taken into account. Including other image modalities is sometimes inevitable. LUS may confirm pneumonia but cannot rule it out. Differentiating between various aetiologies of pneumonia is sometimes possible to a degree, but such differentiation has to be made very cautiously. To our knowledge, reliable differentiation between viral bronchiolitis and bronchiolitis complicated by bacterial infection in small lesions is not possible, producing false positives [45]. Sonographic image of bronchiolitis and bacterial bronchopneumonia, especially atypical, may be the same. Consolidations may and do occur also in viral pneumonias [46]. Bronchiolitis is a clinical diagnosis. Relying on ultrasound image alone may result in unnecessary antibiotic therapy, when small atelectases are taken for small pneumonic consolidations. In cases where it is possible, like lobar consolidation with dynamic air bronchograms indicating most of time (in community acquired setting) S. pneumoniae, the clinical image is already evident. Some degree of atelectasis as well as oedema is in fact a natural part of the complex image of pneumonia. All the signs are helpful but not absolute, and they are summarised in Table 4. Bronchograms were discussed earlier. The pleura itself may be thickened independently. This is perceptible by ultrasound (for instance asbestos-related plaques [47]); therefore, sometimes other causes should be taken into consideration. Abolished lung sliding favours pneumonia, although massive atelectasis, apnoea, cardiopulmonary arrest, asthma exacerbation, and pleural adherences may also produce such an image [48]. The presence of fluid raises the question of whether consolidation is the consequence or the source. Compressive atelectasis occurs in cases of sufficient pleural fluid (Figure 12C), but concomitant consolidations such as oedema, infarct (embolus [49]), and inflammatory (Figures 10A, B) or tumoural infiltration (Figures 10C, D) may also be a source of fluid. Septations in fluid may be a sign of infection, but sometimes may also be encountered in aseptic collections, for instance in chronic haematomas [50]. Echogenic fluid indicates exudate. Gas bubbles may be a sign of infection with gas-producing bacteria (Figure 11B), but also might be iatrogenic, coming from airway/lung injury or an undetermined source (Figure 11A). For differentiation between pleural effusion (Figure 12D), empyema, and peripheral abscess there are multiple other features (shape, angles, symmetry, consolidation) to be checked. Rarely there will be a need to press the Doppler button. A last note: empyema and abscess may coexist. Signs related to fluid were discussed. Finally, remember to verify fluid found with an abdominal approach by intercostal approach; if the lung is not visible, one may be tricked sometimes by apparent fluid collection behind the diaphragm. The same is true for consolidations, although the mirror image (Figure 3A) is perfect, what makes it easily recognised. Pneumonia undergoes evolution and may take many forms.
Table 4
Signs differentiating atelectasis and pneumonia
Ultrasound image, if available, will depend not only on the time since infection [51], but also on aetiological factors [52,53] and the immunological status of the patient [54]. Knowledge of possible images of lung pathologies with zonal distribution (for instance by extrapolating familiarity of CT appearances) might be useful in attempts to further differentiate the aetiology and remain aware of other causes of visible artifacts.
On some occasions LUS may provide a quicker diagnosis, such as in acute cases of pneumothorax [55,56], to treat it prior to CT scan. Clinical correlation is mandatory to not harm the patient. In studies regarding post-biopsy pneumothorax control sensitivity ranges 20-100% [57-59], which clearly shows how operator dependent it is and raises the question of the reliable application of the method.
Lung ultrasound in neonatal care is well described in references [60,61]. It has well-established applications due to sufficient beam penetration and a significant reduction of radiation.
Many studies on LUS in PE focused on consolidations alone. Such an approach in a larger group of patients was reported by Mathis et al. with sensitivity 43.4% and specificity 98.7% [62]. Two study protocols used vein interrogations in different settings. The first was the BLUE protocol, with 81% sensitivity and 99% specificity (acute respiratory failure). The second was ultrasound enhanced Wells score [63] with sensitivity/specificity of 69.6%/88.2% (emergency PE-suspected patients). Although infarcts are usually wedge-shaped, they may also be rounded, and it has been proposed that consolidations may not be differentiated between pneumonia and infarct by LUS alone [64]. On CT they usually show no enhancement centrally, but the perimeter characteristically enhances; air bronchograms are rarely observed due to filling with blood. In preliminary contrast-enhanced ultrasound (CEUS) studies 40% of embolic consolidations showed no enhancement, 40% enhanced inhomogenously, while 20% enhanced [65]. As for Doppler ultrasound, studies describe “little flow” [66] or no flow [67] in case of infarcts, without any mention of increased flow peripherally. This should be verified in larger studies. It is interesting because bronchial flow may enhance dramatically during PE [68] and may be measured on ultrasound [69] and it can be seen on CEUS [70]. In our case of chronic infarct (Figure 14) there was little flow with diastolic reversal (Figure 14C), which is a well-known finding upstream to occlusion [71], but it might also be part of the normal spectrum in the peripheral pulmonary branch.
Figure 14
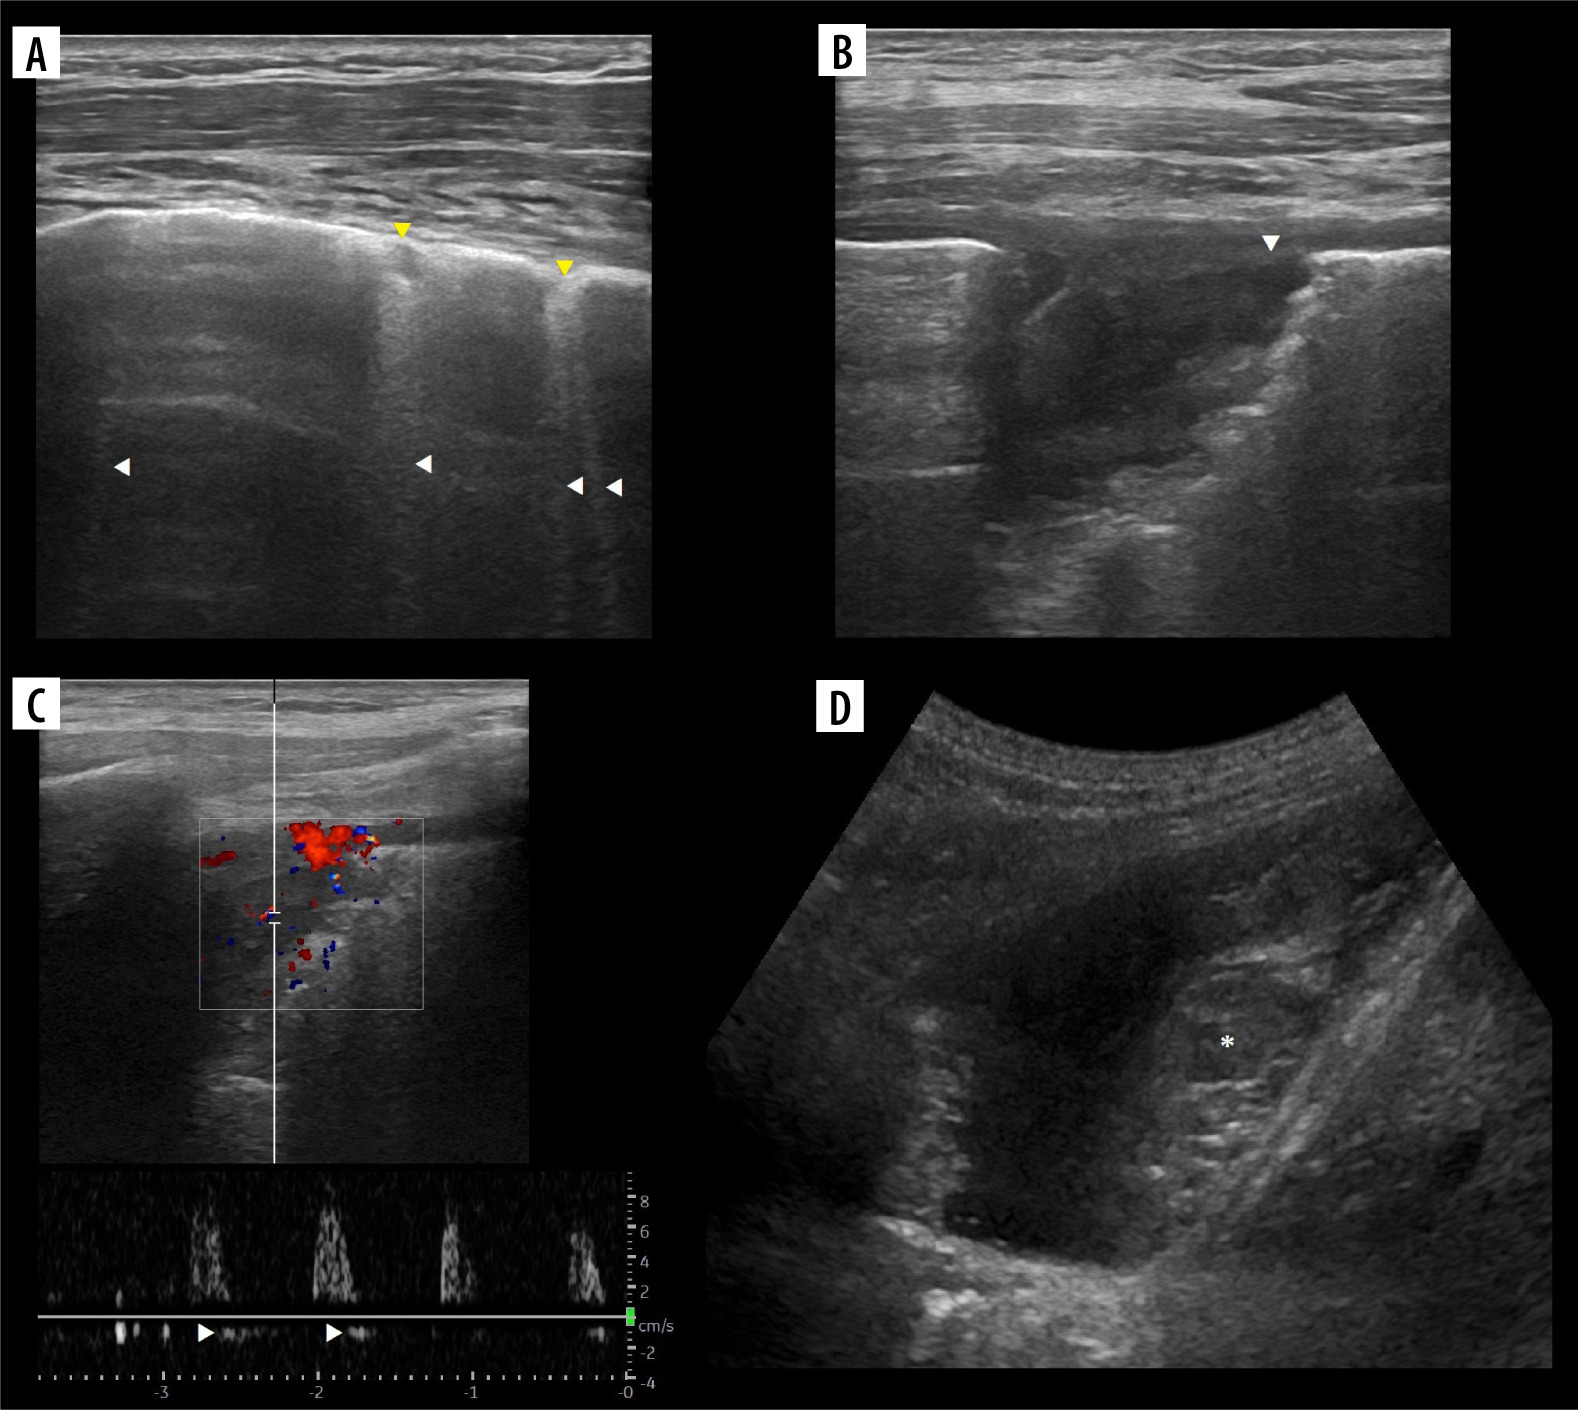
Ultrasound B-mode of chronic pulmonary embolism. A) Fibrotic bands (B-, sub-B and X-lines, white arrowheads) and chronic infarcts (consolidations, yellow arrowheads). B) Close up at chronic infarct. Note inhomogeneity and hypoechoic pleural line (white arrowhead). C) Doppler interrogation shows high resistance, low velocity flow with diastolic reversal (white arrowheads). D) Partially organised (asterisk) hematoma in pleural cavity, due to bloody exudate in pulmonary embolism
We believe that there is a need for well-constructed, large research regarding Doppler flow in embolic and other consolidations, carried out by experienced Doppler operators. Alternatively, use of contrast [72] or transthoracic parametric Doppler [73] may expand the diagnostic possibilities in acute settings in future.
BLUE is by far the best option for the assessment of PE along with other causes of acute respiratory distress by LUS. It may be expanded by echocardiography in order to assess right heart strain [74], to further increase sensitivity. There are 2 more protocols that use modified BLUE:
SESAME (abbreviation from SESAMOOSSIC – Sequential Echographic Scanning Assessing Mechanism Or Origin of Severe Shock of Indistinct Cause [75]) focuses on rapid, cause-oriented assessment in cardiac arrest;
FALLS (Fluid Administration Limited by Lung Sonography [76]) in circulatory failure.
Other examples of protocols that use LUS are eFAST (Extended Focused Assessment with Sonography for Trauma), CA-FAST (Chest Abdominal-Focused Assessment Sonography for Trauma) [77], ShoC (Sonography in Hypotension and Cardiac arrest [78]), PEA (name from pulseless electrical activity [79]), and RADiUS (Rapid Assessment of Dyspnoea in Ultrasound [80]). Detailed information are given in the references, as they are beyond the scope of this article.
Regarding the inelegance of LUS abbreviation, we cannot expect a perfect order in abbreviations in medicine, and most of them have various meanings. US is the widely accepted abbreviation for ultrasound. There are just few uses of LUS, 2 regarding lung – 2008 lung ultrasound [81] and 2015 lung ultrasound score [82].
Maybe some other time we will cover other applications and misconceptions.
Conclusions
This paper was written to briefly summarise the very wide and complicated terminology used in LUS. Unfortunately, radiologists did not contribute much to the development of LUS, and even today many of us do not consider it worth learning or helpful when we have CT. Being a radiologist gives a unique ability to link what you see with other modalities, so it should not be wasted. In our opinion, LUS should be added to regular radiology ultrasound training. We have been learning LUS from scratch in recent years, starting from describing pleural fluid and consolidations on abdominal exams, through looking at abnormalities spotted in different modalities if we came across them, performing biopsies, inserting tubes, and ending with chest exams in neonatal and COVID patients. We tried many things, which allowed us to see a wide spectrum of LUS findings, and therefore we have created this compendium and shared our opinions on a few topics. After all, ultrasound is one of the basic methods we use in imaging. It may be a useful tool for the monitoring of patients in intensive care units due to its availability and non-invasiveness. It also has some applications in emergency medicine, neonatology, internal medicine, and paediatrics. In general, it should never stand prior to the clinical image and should always be conducted by well-trained, experienced operators. The examination protocol has to fit the needs, and in most cases it will be focused evaluation. Rarely, the surface of the whole lungs has to be scanned (e.g. in neonatal patients). We strongly disagree with the uncritical enthusiasm towards LUS that is presented in some publications, which sometimes call this modality a golden solution for all possible chest pathologies. Instead, we consider LUS as a useful technique but within reasonable limitations. We believe that there is much more to discover and link to different pathological and physiological states. If you seek detailed information about the presented lines and signs, we encourage you to check above-mentioned book. In our opinion, the role of other imaging modalities is slightly underappreciated and the role of ultrasound is slightly overappreciated by the author. We cannot fully agree on absolutely everything that is in there. Nonetheless, it is worth checking because the author keeps working hard and incessantly to show the world that, after all, much in LUS is possible, and that ultrasound in general is capable of much more than we are aware of.