


Introduction
Diagnosing pulmonary emboli (PE) involves a combination of clinical assessment, imaging studies, and laboratory tests [1]. Computed tomography pulmonary angiography (CTPA) is an important and frequently ordered examination, which is considered the gold standard for the diagnosis of PE. The diagnostic utility of CTPA relies on marked discrimination between intraluminal iodinated contrast and in situ pulmonary embolus. Therefore, CTPA protocols are often optimised around increasing contrast attenuation within the main pulmonary artery as a proxy for the contrast-to-noise ratio (CNR), the rationale being that increased attenuation provides increasing visual conspicuity of an embolus to a reader. Optimising the protocol for performing CTPA involves several considerations to ensure accurate diagnosis while minimising radiation exposure and contrast agent usage. This includes patient preparation, optimised scan parameters including contrast amount and injection rate, and image post-processing [2,3].
One technique used in post-processing images involves generating virtual monoenergetic images (VMI). These monoenergetic images depict tissue attenuation as though they were scanned using a particular energy level. This approach enhances contrast and visualisation, leading to better diagnostic accuracy [4]. The generation of VMI is feasible when a patient undergoes scanning with either dual-energy CT (DECT) or photon counting detector CT (PCD-CT). DECT creates VMI by acquiring CT data at 2 different mean X-ray energies. These energies highlight distinct attenuation properties of various tissues and materials within the body. The resulting monoenergetic images represent tissue attenuation as if scanned at a specific energy, offering enhanced contrast at low energy reconstructions and artifact reduction such as metal at higher energy reconstructions [5-7]. The technique for generation of VMI is similar on PCD-CT, but PCD-CT allows benefits such as lack of electronic noise, equal weighting of low- and high-energy photons, and higher spatial resolution than conventional CT. Furthermore, PCD-CT has a 50 cm field of view for VMI and an “always on” spectral acquisition mode rather than specific DE protocols, allowing for broader applications of multiple reconstructions [8].
There are many studies that have evaluated the impact of different VMIs for the diagnosis of PE on DECT [9-11]. However, there are few investigations that focus on the optimal settings detection to produce the highest CNR for VMI on PCD-CT. The authors hypothesise that low-keV virtual reconstructions will be most diagnostic in alignment with the current literature, but the relative performance for different keV reconstructions is unknown. The first aim of the study was to evaluate both subjective and objective image quality parameters of various VMI levels of PCD-CT in the detection of PE. The second aim was to choose the optimal PCD-CT reconstruction for PE detection.
Material and methods
Subjects and ethical statement
This retrospective cohort study was approved by the Institutional Review Board at the performing institution, and the need for written informed consent was waived. Patient data, including identifiers, were recorded and stored, in compliance with the Health Insurance Portability and Accountability Act, in an encrypted web database in institutional storage. Patient data were de-identified prior to statistical analysis, and no individual patient information was shared with third-party entities. A total of 25 patients, from June 2023 to July 2023, who underwent PCD-CT angiography of the chest for the diagnosis of PE at a single institution, were enrolled in this study. Exclusion criteria included age < 18 years, significant respiratory motion or metal artifact, or non-diagnostic contrast bolus.
Image acquisition
PCD-CT image acquisitions were performed on a first-generation dual-source PCD-CT system (NAEOTOM Alpha, Siemens Healthineers, Forchheim, Germany). This system contains 2 photon-counting cadmium telluride (CdTe) detectors with 144 ´ 0.4 mm collimation on each detector, allowing spectral CT data acquisition at high temporal resolution. Patients underwent enhanced chest CT using the PCD-CT. Examinations were performed by use of the institution’s standard clinical protocol for CT pulmonary angiography studies. Scans were acquired at full inspiration in the craniocaudal direction at 140 kV, pitch of 2, rotation time of 0.25 s, and collimation of 0.4 mm using bolus tracking techniques. VMIs were performed post image acquisition at the scanner workstation. 40-100 keV reconstructions were created in 20-keV increments using a quantum iterative reconstruction (QIR) setting of 3 and a Br40f kernel with 1-mm slice thickness.
Quantitative imaging evaluation
Single slice CNR, and SNR were calculated for the region of interest (ROI) within the opacified main pulmonary artery (MPA) using the following equations:
The circular ROI was placed in the main pulmonary artery in the same position (copied) on all keV reconstructions. The size of the ROIs was as large as possible due to interpatient variation, ensuring a maximum contrast bolus representation. Noise was defined as the standard deviation (SD) of the Hounsfield units comprising the background noise – in this case the left pectoral muscle.
Qualitative evaluation
Two independent fellowship-trained thoracic radiologists (with 12 and 5 years of experience) rated the main pulmonary artery and lobar/segmental/subsegmental branches for diagnostic quality on all VMI for each of the 25 patients. The raters used an ordinal 5-point modified Likert performance scale with one representing deficient diagnostic quality for pulmonary emboli detection, 3 representing meeting standards, and 5 representing far above standard. Mean performances were aggregated and compared.
Statistical analysis
Means and SDs were calculated for all quantitative measurements. A power analysis was performed, which determined the power for 25-patient inclusion to be 0.83 for detecting differences in quantitative characteristics of keV reconstructions for an effect size of at least 0.5 with a standard alpha of 0.05. Two-way ICC (average random raters) was calculated for all qualitative metrics by anatomic segment. All data analysis was performed in R v 4.2.1 (R Foundation for Statistical Programming, Vienna, Austria).
Results
Quantitative results
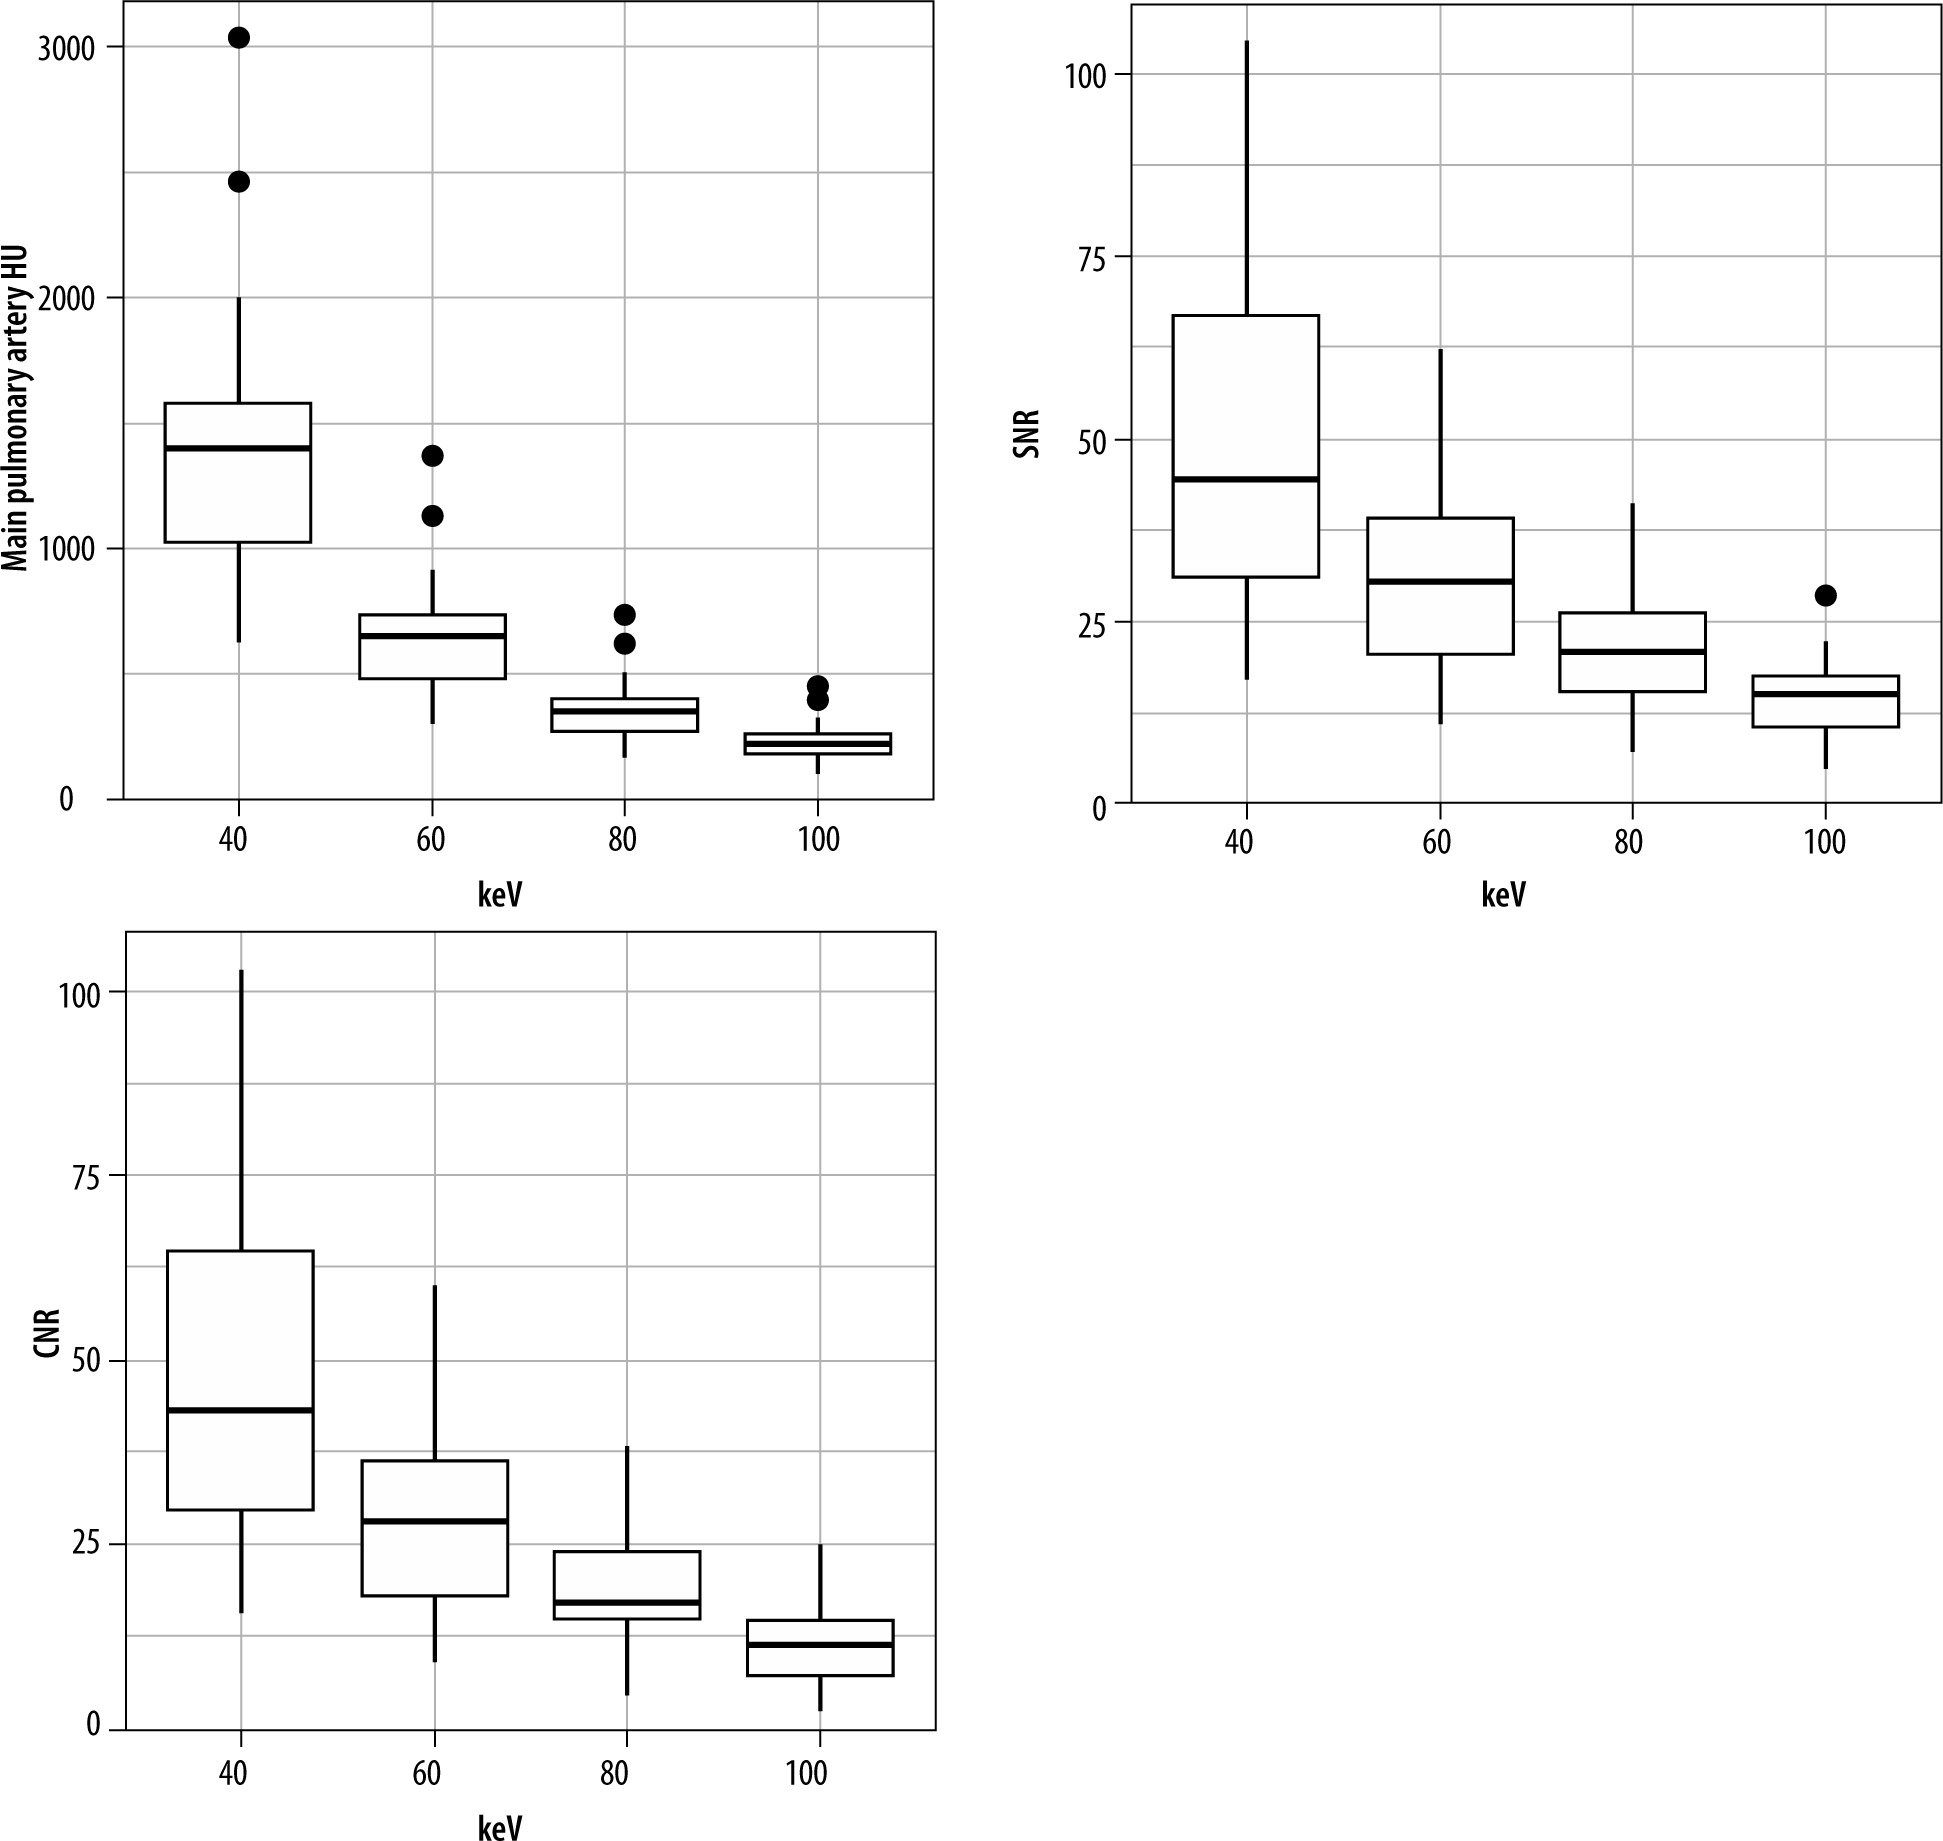
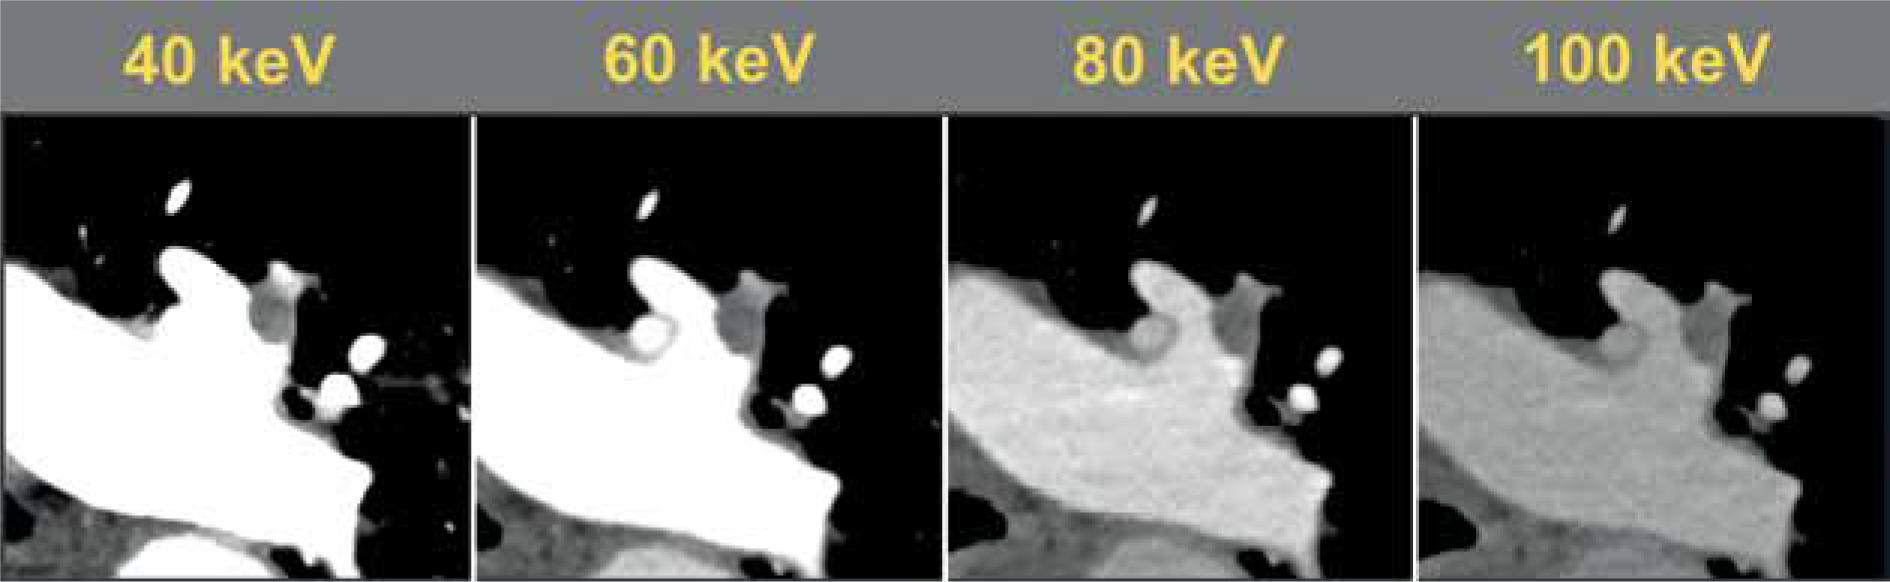
The magnitude of the background attenuation (muscle) increased with increasing keV. 40 keV had the lowest mean background attenuation (32.5 ± 29.0 HU), increasing to a mean of 51.3 ± 16.8 HU at 100 keV. The attenuation of the main pulmonary artery was highest at 40 keV (1405 ± 535 HU), decreasing to 232 ± 76 HU at 100 keV. The highest SNR was at 40 keV (49.3 ± 22.2) decreasing to 14.9 ± 6.9 at 100 keV. The same pattern was observed with CNR (48.2 ± 22.1 to 11.6 ± 5.6) (Table 1, Figure 1). Figure 2 visualises the findings of increased intraluminal opacification on low keV reconstructions. The magnitude of the background noise decreased less sharply than the corresponding decrease in attenuation as the keV increased, resulting in worsening SNR/CNR at higher monoenergetic reconstructions and explaining the visualised trend.
Table 1
Quantitative comparison of signal and noise for the tested monoenergetic reconstructions (N = 25)
Qualitative results
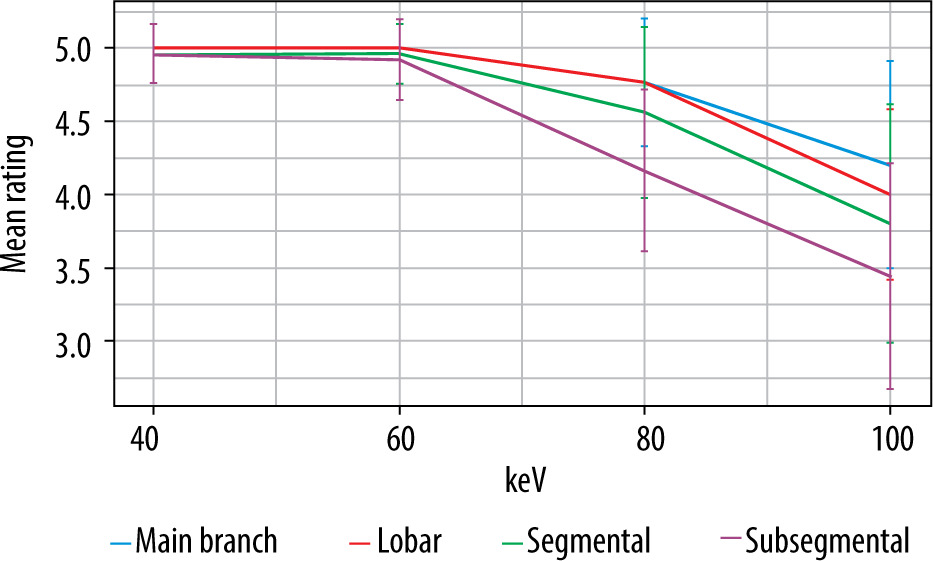
The highest quality ratings were observed with the 40- and 60-keV monoenergetic reconstructions, with a mean rating of 5.0 ± 0 for both main branch and lobar pulmonary arteries. Segmental and subsegmental pulmonary arteries had near perfect ratings for diagnostic quality at 40 and 60 keV (4.9 ± 0.1). The general trend was for decreasing quality at higher keV. 80 keV and 100 keV had main pulmonary artery diagnostic quality ratings of 4.8 ± 0.3 and 4.2 ± 0.7, respectively. Qualitative impact was seen most at the segmental and subsegmental level (mean 100 keV segmental = 3.8 ± 0.8; mean 100 keV subsegmental = 3.4 ± 0.8) (Table 2, Figure 3). Figure 4 demonstrates that 40 and 60 keV had very similar qualitative ratings, and quality diminished almost linearly with increasing keV after 60 keV. The sharpest decrease in quality was observed with distal vessels.
Table 2
Qualitative comparison of monoenergetic reconstructions by subjective one-rater measurements through the distal pulmonary artery branches. Ratings were standardized using a 5-point Likert scale, with 5 representing the best quality. Intraclass correlation coefficient between 2 raters was calculated for each. Krippendorff’s alpha (KA) was calculated for each anatomic segment. N = 25
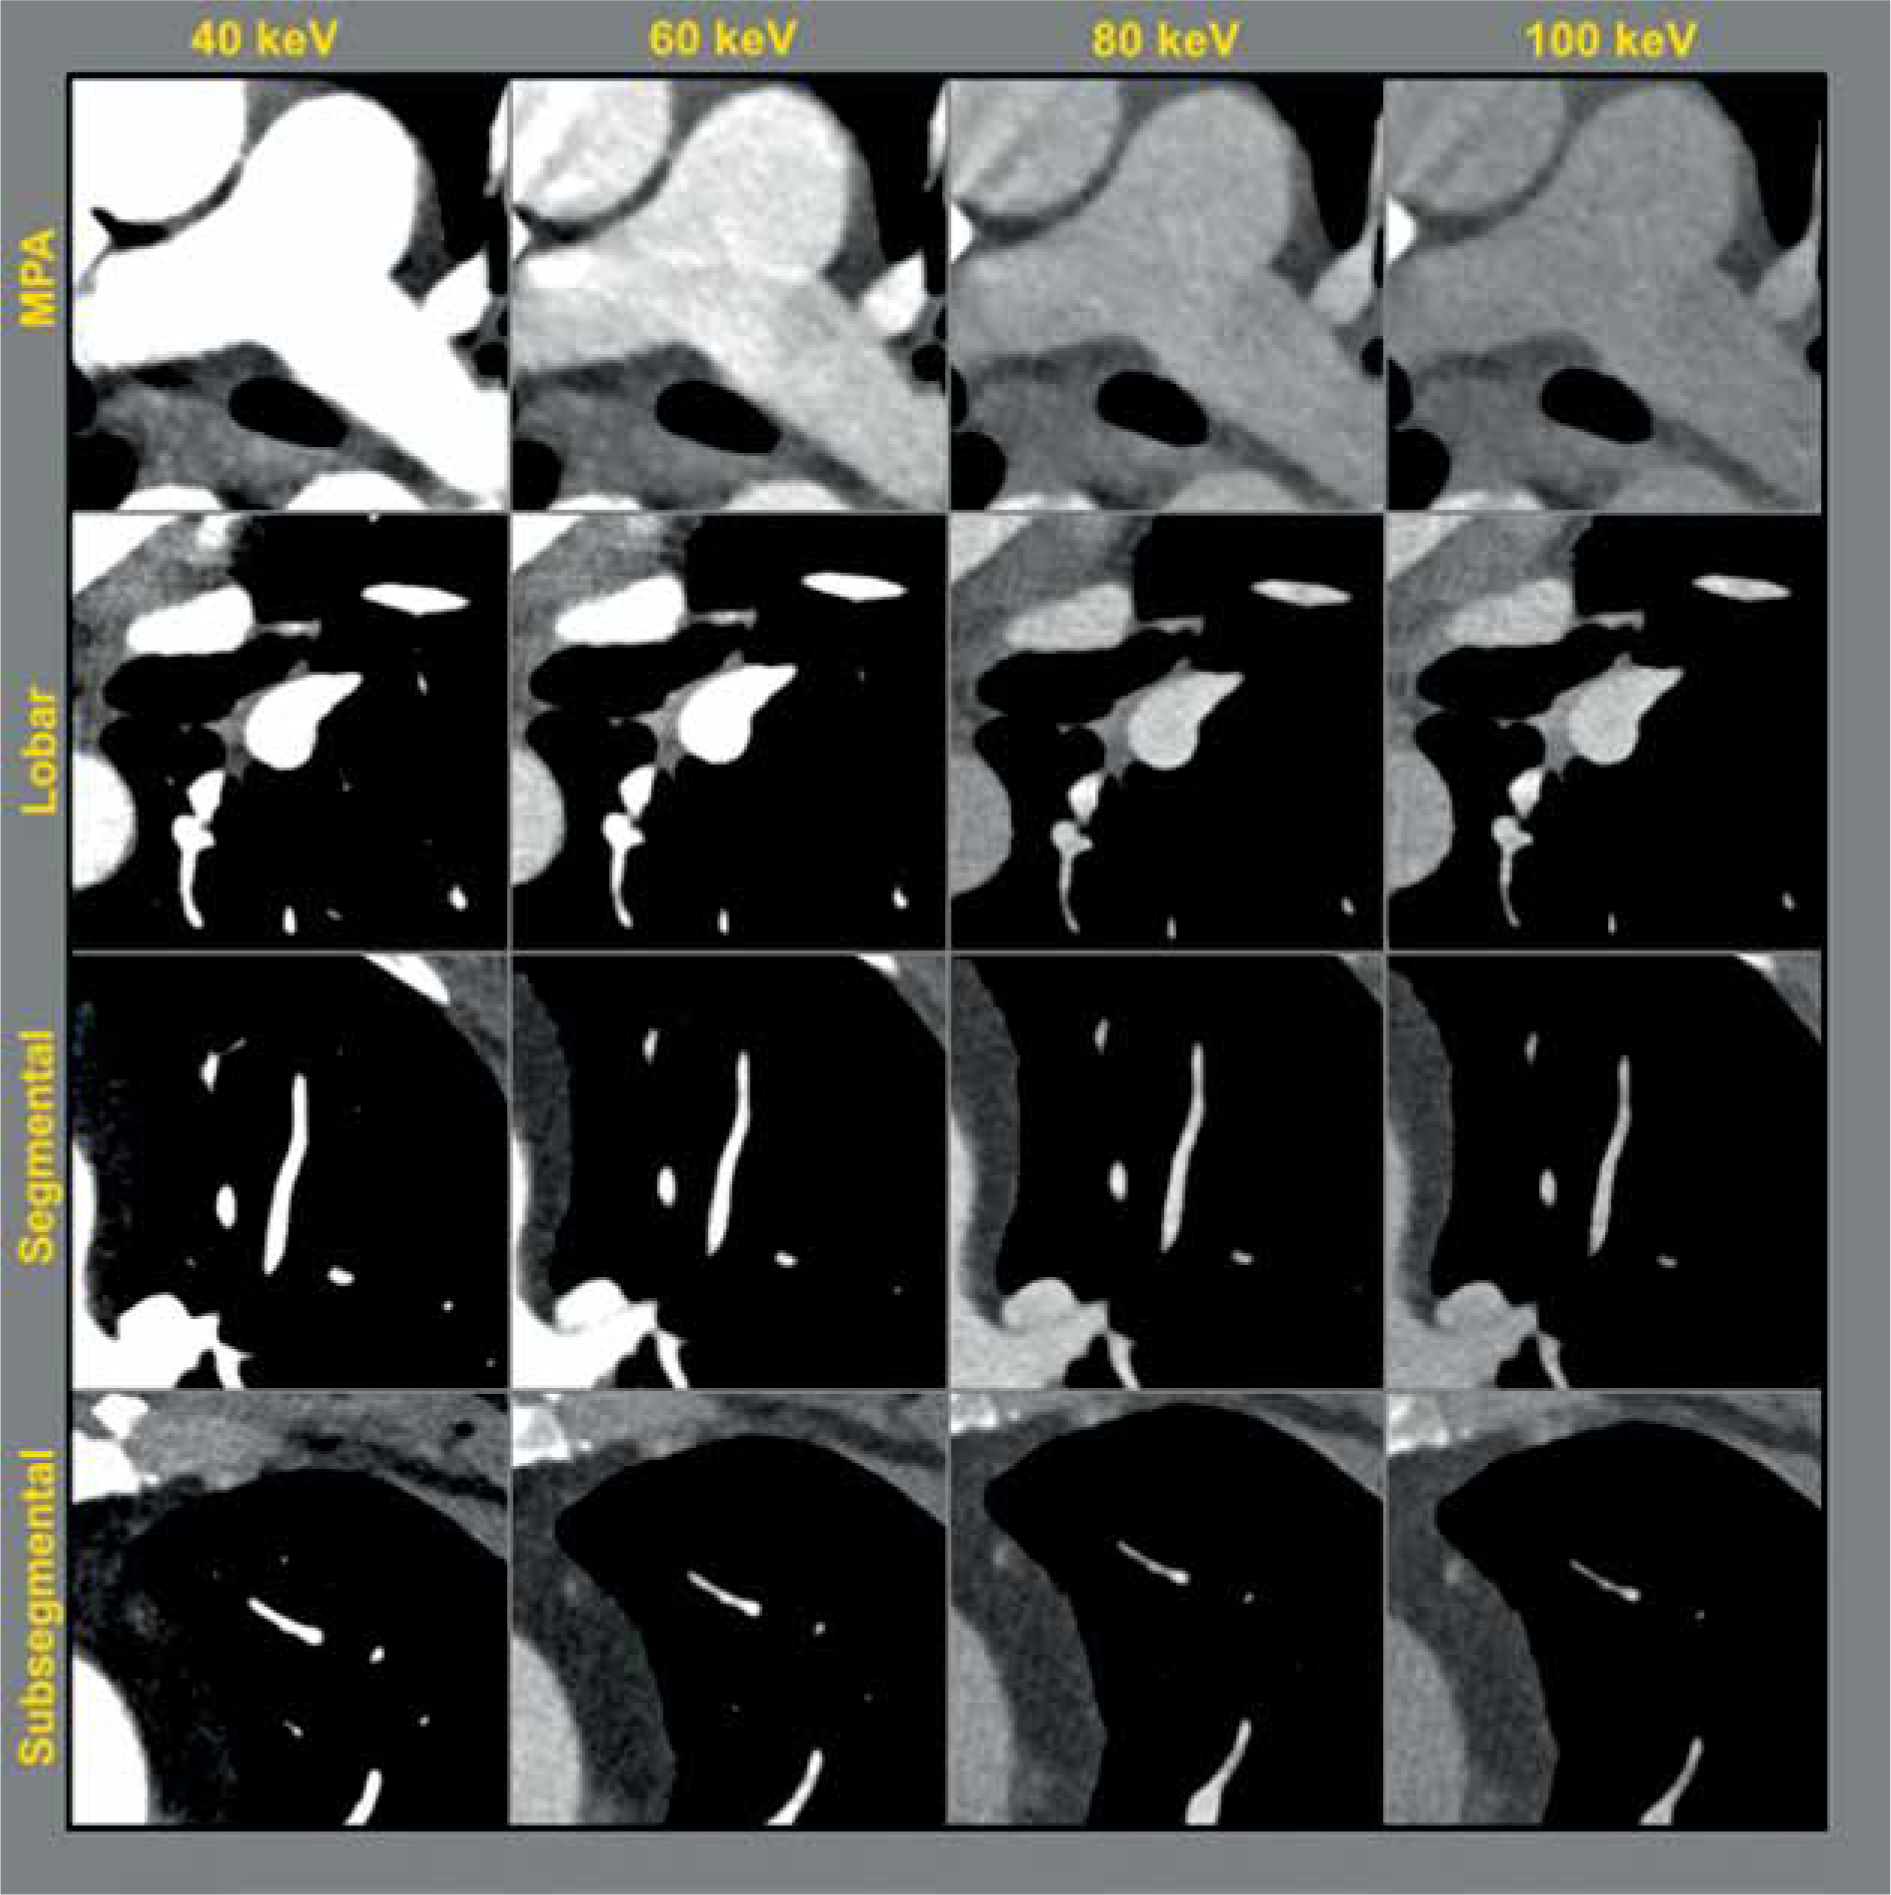
Figure 3
Side-by-side anatomic comparison of intraluminal opacification from the main pulmonary artery (MPA) distal to the subsegmental pulmonary arteries in a single patient with no acute cardiopulmonary abnormalities. Window level was standardized as centred at 100 with width of 700 (–250 to 450). Diminished opacification is visualized in the higher keV monoenergetic reconstructions, especially distally
Discussion
The purpose of this study was to compare different keV for VMI on PCD-CT-CTPA. The authors found that 40 keV had the best SNR and CNR by quantitative measurements, but both 40 keV and 60 keV reconstructions performed nearly perfectly with regards to diagnostic quality. Deleterious effects of increased keV reconstructions were observed in the smaller vasculature, including segmental and subsegmental arteries. The best opacification was predictably observed in the 40-keV reconstructions, the SNT was also the lowest. These results suggest that 40 keV is the optimal monoenergetic reconstruction for use with PCD-CT, but reconstructions up to 60 keV may also be acceptable based on the qualitative analysis.
Computed tomography pulmonary angiography is a European Society of Cardiology guidelines class I indication for ruling out pulmonary embolism, the diagnosis of which is based on acceptable opacification of the main pulmonary artery [12]. This threshold has been described as > 250 HU, with suboptimal opacification relating to inferior detection for pulmonary embolisms [13,14]. This basic concept can be crudely reduced to discriminating densely opacified pulmonary artery lumen and a less densely attenuating thrombus. Thus, the optimal parameters would maximise intraluminal opacification to make distal emboli more conspicuous while simultaneously providing for diagnostic quality of the lung parenchyma and other thoracic structures. This is traditionally difficult to accomplish, but dual-energy CT (DECT) has made progress in this regard by using monoenergetic reconstructions at the k-edge of iodine to intensify the attenuation in the pulmonary artery and increase CNR this way [15,16]. PCD-CT has the opportunity to use spectral imaging to characterise tissues and exclude energies that contribute poorly to the diagnostic purpose [17-19]. Indeed, prior studies have found increased iodine contrast with PCD-CT, suggesting that increased image quality and dose reduction is possible for PCD-CT applications in thoracic imaging [20,21].
Hence, a key impact of PCD-CT in this area is reduction of noise by exclusion of electronic noise. This noise represents the denominator of the SNR and CNR equations, and so decreasing noise will increase conspicuity. Conventionally, low-energy monoenergetic reconstructions are thought to have the highest CNR but a low SNR in the context of increased image noise [22,23]. Several research studies have indicated that the optimal SNR is achieved at lower keV, specifically within the range of 40-70 keV, depending on the body region and lower energy bin weighting [24-27]. In this study we demonstrated that the lowest energy (40 keV) monoenergetic reconstruction had the highest attenuation, highest CNR, and highest SNR [19]. The authors therefore contend that 40 keV is the optimal monoenergetic reconstruction to use for the diagnosis of pulmonary embolism to maximise the advantages conferred by the PCD-CT technology. However, subjective rater measurements found 40 keV and 60 keV to be nearly identical in quality, and it is therefore likely that any threshold between 40 and 60 keV would be sufficient for diagnosis and is open to institutional preference. Higher-energy monoenergetic reconstructions should not be used for the express purpose of pulmonary embolism detection because the capability for distal embolism detection falls off relatively fast according to qualitative analysis. Additional monoenergetic reconstructions should be directed at characterising other findings of interest in the thorax, taking full advantage of the spectral capability of PCD-CT. Numerous studies conducted on dual-energy CT (DECT) have yielded comparable findings, indicating that virtual monoenergetic reconstruction at 40 keV is ideal for achieving optimal pulmonary artery opacification and effective detection of pulmonary emboli [9-11,28]. As far as the authors are aware, as of the current date, only one investigation (Yalynska et al.) has been conducted on PCD-CT using different image reconstruction parameters, including a 2-mm slice thickness and keV values ranging from 40 to 70 keV [29]. Yalynska et al. found that while the SNR reached its peak at 40 keV, the subjective visibility of pulmonary emboli was rated highest at 50 keV. In our study, we observed that both SNR and CNR were optimized at 40 keV, and the subjective visibility of pulmonary emboli was rated highest at 40 and 60 keV, consistent with their conclusions and contributing additional clinical information about the impact of CNR, SNR, and keV on PCD-CT.
The limitations of this study include the lack of a diagnostic analysis for pulmonary emboli because this study focused on intraluminal CNR. There were only 2 pulmonary emboli among the 25 sequential patients included in this study, which is a normal finding in United States cohorts. Therefore, diagnostic performance for the detection of pulmonary emboli could not be examined. In addition, mixed or polyenergetic reconstructions were not examined, and additional variables such as kernels and quantum iterative reconstruction parameters were not examined. The authors suggest that each variable be studied individually to avoid a large matrix of moving parameters and to avoid uncertainty of contribution.
Conclusions
40-keV monoenergetic reconstruction possessed the highest CNR for intraluminal opacification of the main pulmonary artery and is recommended as the virtual monoenergetic reconstruction of choice for monoenergetic imaging for pulmonary embolisms. In practice, 40-60 keV reconstructions may be used because the diagnostic quality was deemed above par.