


Introduction
Hepatocellular carcinoma (HCC) is a common malignant tumour with a high mortality rate throughout the world. In 2018, the World Health Organization reported liver cancer to be the first cancer-related mortality rate and have second highest incidence rate of all cancers in Thailand [1]. The risk factors related to HCC in the general Thai people are chronic hepatitis B virus (HBV) infection, alcohol consumption, chronic hepatitis C virus (HCV) infection, and cryptogenic cirrhosis.
From many previous studies, we found that microvascular invasion (MVI) was related to the recurrence and survival rates in patients after surgical resection or liver transplant [2-5]. Currently, many studies try to use multiple imaging modalities to detect MVI, such as compute-rized tomography (CT) scan, magnetic resonance imaging (MRI), or positron emission tomography (PET) scan. At present, the CT scan is a widely used diagnostic tool for diagnosis and pre-operative planning of HCC. Lim et al. [4] reported that disruption of the capsule by CT was correlated with tumour invasion. Another study by Chou et al. [6] reported that a non-smooth tumour margin is associated with MVI, but the pathology report is still the gold standard.
From the previous studies, pathologic findings of HCC fibrous capsule tend to protect the tumour invasion [3, 4, 7]. Therefore, some studies have attempted to use CT scans to detect fibrous capsules to predict MVI; however, the accuracy of CT scan for this detection was varied.
Therefore, the purpose of this research was to study the findings and accuracy for detecting MVI from CT scans.
Material and methods
Patients
This retrospective study at Maharaj Nakorn Chiang Mai Hospital was approved by the Research Ethics Committee, Faculty of Medicine, Chiang Mai University (Study Code: RAD-2563-07224), and informed consent was not required.
The inclusion criteria were as follows: pathological report of HCC from surgery by the Department of Pathology with a pre-operative CT scan in the picture archiving and communication system (PACS). Patients with age less than 15 years or evidence of macrovascular invasion were excluded from this study. During the period from January 2013 to August 2017, 53 patients were identified.
Imaging acquisition
CT images of the liver were obtained with one of two multidetector CT scanners (SOMATOM FORCE and SOMATOM DEFINITION, Siemens Medical Solutions, Forchheim, Germany). The patients were in a supine position. The images were obtained in a craniocaudal direction. First, pre-contrast CT images of the liver were scanned. 100 ml of a non-ionic iodinated contrast media (350 mg/ml) were injected through the antecubital vein at 3-4 ml/s using a power injector. The hepatic arterial phase (HAP), portovenous phase (PVP), and delay phase (DP) of scanning began 35, 80, and 180 seconds after the injection of contrast media, respectively. Coronal and sagittal images were reconstructed with a 5-mm slice thickness using raw imaging data for portovenous-phase CT.
Imaging analysis
The CT image was reviewed on PACS and using a Syna-pse workstation, by a board-certificated diagnosis radio-logist and a third-year resident training in radiology, based on consensus. The CT scan was evaluated depending on the phase.
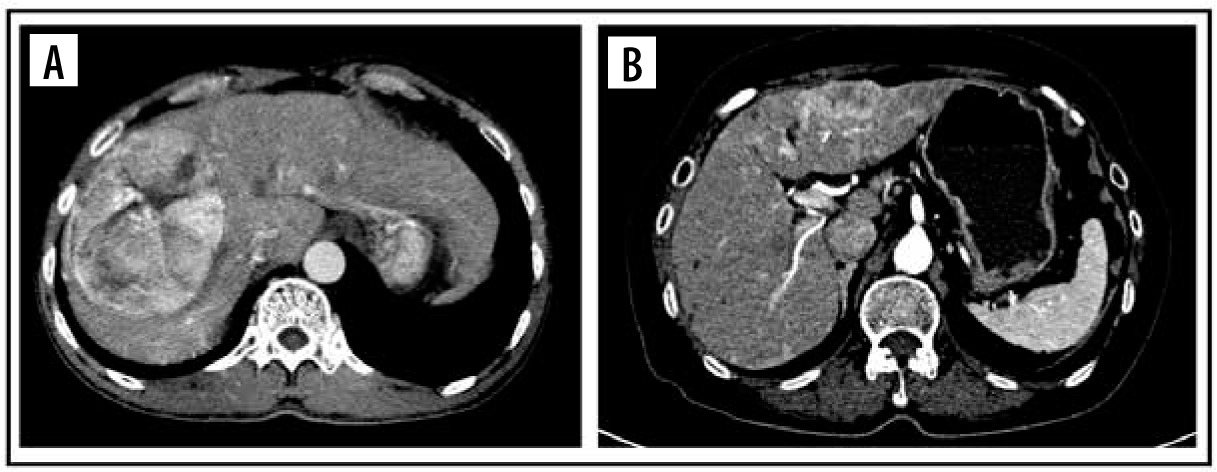
The imaging features on HAP were classified as no peritumoral enhancement, presence of peritumoral enhancement, and rim-arterial enhancement. The peritumoral enhancement was defined as the existence of a detectable arterial-enhancing area adjacent to the tumour border on the arterial phase and became iso-enhanced similar to the liver parenchyma on the delay phase. Rim-arterial enhancement was a rim-like enhancement at the peripheral aspect of the tumour (Figures 1 and 2).
Figure 1
Illustration shows 3 patterns of peripheral enhancement on the arterial phase. No peritumoral enhancement, presence of peritumoral enhancement, and rim-arterial enhancement
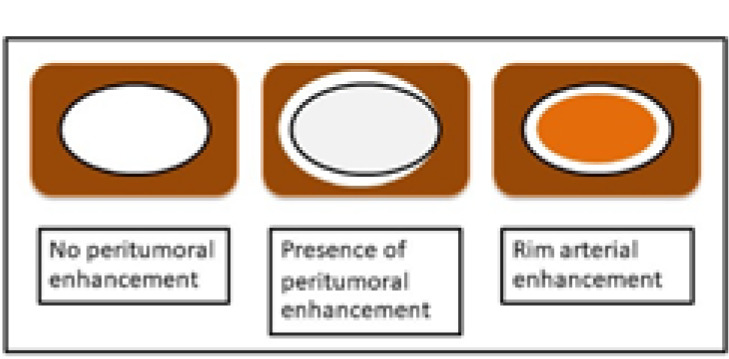
Figure 2
Computed tomography images of pattern enhancement on arterial phase. Peritumoral enhancement (A) and rim-enhancement (B)
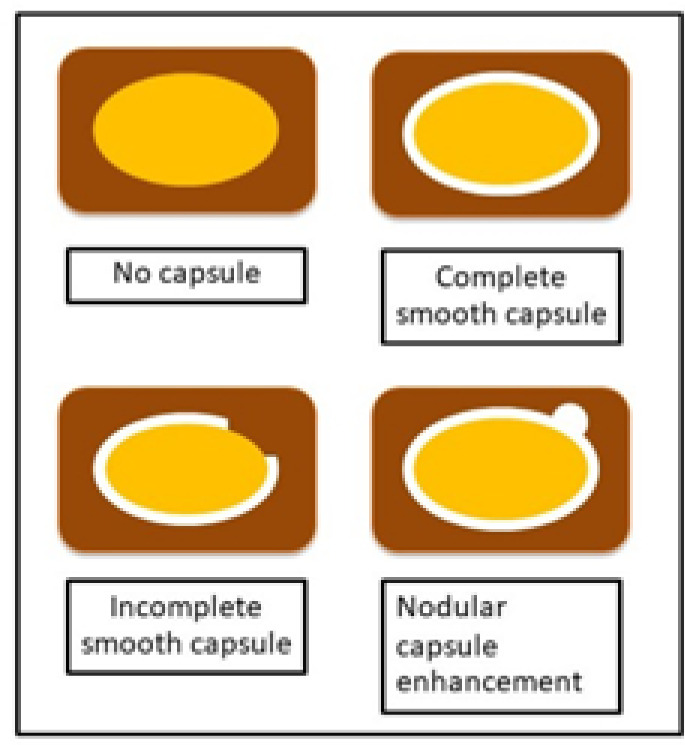
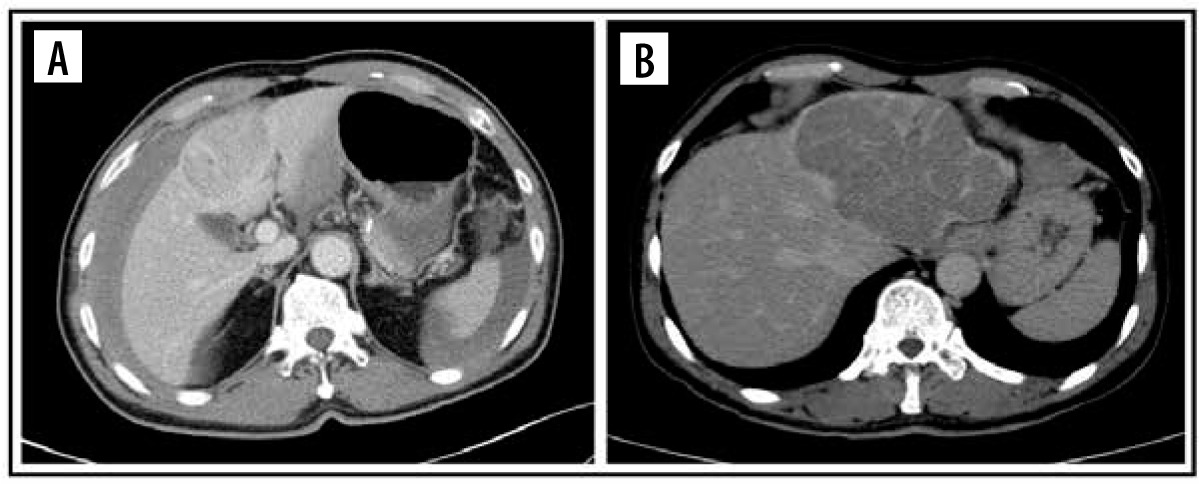
The tumour margin enhancement on PVP and DP were evaluated as capsule enhancement. The capsule was defined as a thin, linear, enhanced structure encasing the tumour. We classified capsule enhancement as one of four following groups: no capsule, complete smooth capsule, incomplete capsule, and nodular capsule enhancement. No capsule is defined as a non-visualized enhancement of the capsule. Complete smooth capsule enhancement was a smooth enhancement at the normal liver-tumour interface in all axial, coronary, and sagittal images. The incomplete capsule was an interrupted capsule enhancement without nodular appearance. Nodular capsule enhancement was a focal outgrowth of enhancing capsule protruding into the normal liver parenchyma (Figures 3 and 4).
Histopathological examination
The histopathological findings and MVI were recorded based on pathology reports. No re-examination of pathological slices was done. The degree of tumour differentiation was categorized according to the Edmondson-Steiner classification.
Statistical analyses
Statistical analyses were performed by using the software STATA ver.15.1. The quantitative data were as follows: age, size of the tumour, and interval time results, presented as mean and standard deviation or median and interquartile range depending on data distribution. Categoric variables, such as peritumoral enhancement, tumour capsule, daughter nodule, and background liver, were analysed by the chi-square test. The parameters found to have statistical significance by univariate analysis were entered into multivariate analysis. The parameters that showed statistical significance by multivariate analysis were calculated and presented as the sensitivity, specificity, positive predictive value (PPV), negative predictive value (NPV), and accuracy.
Results
Patient characteristics
A total of 53 HCC patients were included in the study. Tables 1 and 2 summarize the CT imaging features and histological characteristics of patients in the MVI-present group and MVI-absent group.
Table 1
Comparison of computed tomography imaging features according to microvascular invasion. Unless otherwise indicated, data are the number of patients with the percentage in parentheses. Categorical variables were compared by using the χ2 test or Fisher exact test
Table 2
Comparison of histological features according to microvascular invasion. Unless otherwise indicated, data are the number of patients with the percentage in parentheses. Categorical variables were compared by using the χ2 test or Fisher exact test
The mean age was 55.91 years and was comparable between the 2 groups. The background of liver cirrhosis found 64.15% of patients and comparable between the MVI present group and MVI absent group.
The mean tumour size at diagnosis detected by CT was significantly bigger in the MVI-present group than in the MVI-absent group (7.34 cm vs. 2.69 cm, p = 0.001).
Regarding histological features, HCCs with MVI and HCCs without MVI showed similar cell types and cell differentiation. Most of the HCCs showed a trabecular pattern; 76.67% of the MVI-present group and 66.67% of the MVI-absent group.
Computed tomography imaging features of the 2 groups
The presence of daughter nodules was uncommon in our study, at only 13.21%.
Peritumoral enhancement in HAP was seen in 11/33 (28.20%) in the MVI-present group versus 1/14 (7.14%) in the MVI-absent group. Rim arterial enhancement was seen in only one case in our study, 1.89%.
Nodular capsule enhancement in PVP was significantly more common in the MVI-present group than the MVI-absent group, at 66.67% versus 7.14%, respectively.
The nodular capsule enhancement in DP was seen 28/39 (71.79%) in the MVI-present group versus 1/14 (7.14%) in the MVI-absent group; the difference between the 2 groups was statistically significant.
In univariate analysis (Table 3), nodular capsule enhancement on PVP (odds ratio [OR] = 29.250; 95% confidence interval [CI]: 3.425-259.757; p = 0.002) and nodular capsule enhancement on DP (OR = 33.090; 95% CI: 3.853-284.138; p = 0.001) were significant independent predictors of MVI.
Table 3
Univariate and multivariate analyses of computed tomography imaging features in predicting microvascular invasion
The sensitivity, specificity, accuracy, PPV, and NPV for significant imaging findings and their combination for predicting MVI are shown in Table 4.
Table 4
Diagnostic performance of computed tomography imaging features in predicting microvascular invasion. Data are presented as percentages. Data in parentheses are the number of subjects used to calculate the percentage
Discussion
The presence of MVI in pathological specimens predicts the risk of tumour recurrence and long-term survival after surgery [7,8]. One study showed one-year recurrence rates in a patient with and without MVI as 23.3% and 7.5%, respectively [9]. Li developed a nanogram using MVI as the predictive variable to predict lung metastasis [10]. So, the prediction of MVI on preoperative imaging is essential in clinical practices, including prognostic evaluation, choosing the width of margin in different treatment options (hepatectomy, transplantation, ablation, or trans-arterial chemoembolization), and monitoring tumour recurrence. CT is widely used to evaluate patients with HCC. Therefore, it is acceptable to identify MVI by pre-operative CT.
Lee et al. demonstrated peritumoral enhancement and rim enhancement on the arterial phase of gadoxetic acid-enhanced MRI, which was an independent and significant predictor of MVI [11]. Our study showed that peritumoral enhancement was an independent predictor of MVI with an OR of 5.107, but it was not statistically significant. The specificity of peritumoral enhancement and rim enhancement was greater than 90%, but the sensitivity was less than 30%. These arterial margin enhancement patterns were not statistically significant because of the small number of patients. The presence of daughter nodule was not a statistical calculation in our study either. Further study with more sample size is needed.
Peripheral enhancement surrounding hepatic nodule in PVP and DP represent capsule enhancement. The capsule enhancement in CT or MR images is one of the criteria for diagnosis of HCC in the Liver Imaging Reporting and Data System (LI-RADS) [12]. This capsule could be a fibrous capsule or pseudocapsule in histological findings. Previous studies found that capsule enhancement on imaging varied from 43% to 64% of cases [4]. Capsule enhancement was more frequently found in our study, i.e. 60.38% on PVP and 71.70% on DP. Furthermore, the result of our study was similar to that of Kim et al., who reported that capsule enhancement was better visualized on DP than on PVP [13].
Many studies found that non-smooth capsule enhancement was a predictor of MVI [2,6,9,13-16]. A prospective study by Chou demonstrated that a non-smooth tumour margin correlated with the presence of MVI [3]. The univariate analysis in our study showed that nodular capsule enhancement on PVP and DP were associated with MVI. The nodular capsule enhancement on DP had a sensitivity of 71.79% and specificity of 92.86%.
Our study had several limitations. First, due to the retrospective study design, selection bias may have been present. Some small HCCs were not included in our study because the patient underwent radiofrequency ablation instead of surgery. Also some intermediate and advance HCCs were not included in our study because patients were not surgical candidates. Secondly, histological analysis was based on pathology reports without re-examination of pathological slides. Thirdly, our study was performed in an institution with a small sample size.