


Introduction
According to the estimations of the American Cancer Society, 3% of new cancer cases in both men and women in 2022 were malignancies originating from the pancreas [1]. Despite its relatively low incidence rate, it is one of the cancers with the worst prognosis and ranks 4th among the causes of cancer-related death in both sexes [1]. There are many factors affecting survival, such as tumour size, lymph node status, presence of metastasis, histological subtype, and histopathological grade of the tumour [2].
Pancreatic ductal adenocarcinoma (PDAC) constitutes approximately 80% of solid pancreatic tumours [3]. The second most common tumour after PDAC is pancrea-tic neuroendocrine tumour (PNET) [4]. Other causes include solid pseudopapillary tumour, sarcomatoid carcinoma (SC), metastasis, and rare (pancreoblastoma, lymphoma, plasmacytoma, tumours of mesenchymal origin, etc.) pancreatic tumours [3]. SC has been defined as a subtype of undifferentiated PDAC in the 2019-WHO classification and constitutes 2-3% of all PDACs [5,6]. It is an aggressive subtype with a poor prognosis [7]. The prognosis and management of pancreatic tumours differ according to the histopathological subtype. Curative treatment of PDAC requires a multimodal approach; if resectability is possible, the mandatory step and primary method of treatment is surgical resection. In PNEN, surgical resection is recommended if the tumour is resectable and larger than 2 cm, while surveillance is an option for low-grade tumours smaller than 2 cm [3]. While only systemic treatment is available in patients with metastatic PDAC, surgical resection of the primary tumour and metastasis may be possible in patients with metastatic disease confined to the liver in patients with PNET [3]. Although surgical resection is the gold standard method for curative treatment in SC, this strategy is only possible in a minority of patients due to early metastasis [7].
Computed tomography (CT) is the gold standard exa-mination in the evaluation of solid pancreatic masses due to its excellent spatial and temporal resolution, its ability to display large anatomical planes, high tissue contrast, and easy application [3,8]. Although the primary purposes of imaging are tumour detection and local-distant staging, non-invasive detection of histopathological subtype and tumour grade is also very important, especially in terms of prognosis prediction and different management options [3,8,9]. Depending on the histopathological subtype and the grade of the tumour, the amount of contrast enhancement and the presence of a cystic-solid or necrotic component on CT may vary [8,9]. A multiphasic CT imaging (preferably 4-phase; non-contrast, pancreatic/late arterial phase, portal/venous phase, and late phase) protocol may allow these distinctions to be made [8,9]. However, in most patients with a pancreatic mass, initially routine portal venous phase imaging is performed to investigate the cause of non-specific symptoms such as abdominal pain, nausea, vomiting, and weight loss [9]. In this phase, pancreatic tumours with different histopathological subtypes and tumour grades may have overlapping imaging features. Therefore, in this study, we aimed to investigate the relationship between the qualitative (tumour localisation, internal structure feature, tumour border feature, visual tumour density, presence of cystic and necrotic components) and quantitative (tumour size, tumour density [Tmden], tumour-portal venous phase density ratio [Tmden/VPden], tumour-non-tumour pancreatic parenchyma density ratio [Tmden/PanPden]) imaging features of portal venous phase abdominal CT and tumour type and tumour grade in common solid pancreatic tumours.
Material and methods
The study was undertaken in a tertiary-care hospital. It was approved by the Ethics Committee of the Faculty of Medicine of Eskişehir University (No: E-25403353-050.99-294656 11 Date: 14.12.2021). The study was conducted in accordance with the principles of the Helsinki Declaration. Approval and informed consent were not necessary due to the retrospective nature of the study and were waived by our local institutional review board.
Study participants
A study group of 159 patients with solid pancreas tumours detected on portal venous phase abdominal CT examination, remaining after the exclusion criteria, in the time period between January 2017 and September 2021 was formed. The exclusion criteria were as follows: 1) patients whose pathology results could not be obtained, 2) patients in whom evaluation was not possible due to motion artifacts of CT, 3) patients without suitable portal venous phase imaging such as vascular access problems, 4) patients with portal venous system thrombus, 5) patients who had had previous pancreatic surgery, 6) patients with a stent in the common bile duct or pancreatic duct due to drainage procedure, and 7) rare pancreatic masses (one pancreatic lymphoma, one plasmacytoma, and one schwannoma), because evaluation could not be made for statistical analysis.
According to the pathology results, the patients were divided into 3 groups as PDAC (n = 137), PNET (n = 15), and SC (n = 7). In addition, PDAC and PNET patients were evaluated in 3 groups according to the degree of differentiation, as good (grade 1), moderate (grade 2), and poor (grade 3).
Image acquisition
All CT imaging was performed using 64-slice (Toshiba, Aquilion 64, Japan) or 128-slice (GE, Revolution EVO, USA) multi-detector CT scanners with the following parameters: 1:0.984/1.35 pitch, automated dose modulation (200-350 mAs), 120 kVp, and 05-0.625 mm isotropic spatial resolution. The subjects were examined in a supine position with their arms extended above their heads.
Weight-adapted (1-1.5 ml/kg, maximum allowable 150 ml) iodinated intravenous contrast agent was administered through the antecubital veins with an automatic injector at a rate of 3 ml/s. 20 ml saline was injected both prior to and following the injection of the contrast media, with the same flow rate. Optimal scan time was detected by the automated bolus tracking method by placing the region of interest over the descending aorta and setting the trigger threshold to 150 HU and 40-s delay time. Images were obtained in portal venous phases.
Image analysis and interpretation
The images were evaluated by 2 radiologists, blinded to the clinical data, and one experienced in abdominal radiology, using a workstation (Advantage WorkStation AW 4.7 software, GE Healthcare, WI, USA).
The qualitative characteristics of the tumour (tumour localisation, internal structure feature, tumour border feature, visual tumour density, presence of cystic or necrotic component) were determined by evaluating all planes. Quantitative features (tumour size, Tmden, Tmden/VPden, Tmden/PanPden) were measured on axial plane images.
The portal confluence section was taken as the refe-rence point for tumour localisation. A parenchyma area approximately 1 cm long in front of the confluence was classified as neck, and the area to the right of the confluence was classified as head and uncinate process. Because there was no real anatomical distinction, the area to the left of the confluence was classified as body and tail. Internal imaging structure was categorised as homogeneous and heterogeneous. For the visual tumour density evaluation, the tumour density was compared with the non-tumour pancreatic parenchymal density and divided into 3 groups as hypodense, isodense, and hyperdense. The tumour border feature was determined according to the border relationship of the tumour with the pancreas and neighbouring organs, and it was considered as well-defined regular margin when the border could be clearly distinguished and there was no invasion, and ill-defined irregular margin in the opposite case. The presence of well-defined and clearly distinguishable spherical or ovoid-shaped areas of water density was considered positive for the cystic component, while areas with irregular infiltrative borders, amorphic and prominently hypodense for the tumour, were considered positive for the presence of necrosis.
Tumour size was determined by measuring the longest axis in the horizontal plane. Circular regions of interest (ROIs) were drawn in the tumour to measure CT attenuation values (Hounsfield Unit [HU]). In the measurements, necrosis areas, cystic component, adjacent pancreatic parenchyma, and large vessels were avoided, and sampling was made from the central 2/3 of the tumour to prevent the partial volume effect. Non-tumour pancreatic parenchymal density and portal density value from the main portal vein were measured with ROIs of approximately 1 cm2. Ratios were obtained by dividing these values by tumour density.
Statistical analysis
SPSS software v. 22.0 (IBM Corp.) was used for statistical analysis. The normality analysis was performed with the Shapiro-Wilk and Kolmogorov-Smirnov tests. Descriptive statistics were presented as mean, maximum, minimum, and standard deviation (SD) for the continuous data, and percentage values were used for discrete data. The Kruskal-Wallis analysis of variance (ANOVA) and the Mann-Whitney U test were used to evaluate differences among the groups. A post hoc analysis was used after the analysis of the variance test to determine the group that caused a significant difference. A p-value of less than 0.05 was considered significant.
Results
A total of 159 patients with 137 PDAC, 15 PNET, and 7 SC were included in the study. The mean age of the patients was 65.54 ± 11.09 (17-87) years. There were 60 (37.7%) female and 99 (62.3%) male patients. There was no difference between the groups in terms of age and gender (p = 0.23, p = 0.81, respectively). The histopathological grade of 135 PDAC and 7 PNET patients could be evaluated. The clinical features of the patients are summarised in Table 1.
Table 1
Patient characteristics
The tumour was located in the head-uncinate process in 102 (64.2%) patients, in the neck in 17 (10.7%) patients, and in the body-tail location in 40 (25.2%) patients. There was no difference in tumour location between the groups (p = 0.19). The tumour was homogeneous in 48 (30.18%) patients and heterogeneous in 111 (69.81%) patients. There was no difference between the groups (p = 0.94). The tumours had ill-defined irregular margin features in 79 (49.68%) patients (Figure 1A), but the tumour border features had well-defined regular margins in 80 (50.31%) patients (Figure 1B); there was a statistically significant difference between the groups (p = 0.01). This difference was between PDAC and PNET (p = 0.002), but no difference was found between SC and PDAC (p = 0.19) and PNET (p = 0.48). Visual tumour density differed between groups (p = 0.0001) (Figure 2A-B). This difference was between PDAC and PNET (p = 0.0001). There was no difference between SC and PNET (p = 0.48) and PDAC (p = 0.19). There was a difference between the groups in terms of containing a cystic component (p = 0.002) (Figure 3). This difference was between PDAC and PNET (p = 0.001); no difference was found between SC and PDAC (p = 1.00) and PNET (p = 0.08). There was a difference between the groups in terms of presence of necrosis (p = 0.004) (Figure 4). This difference was between SC and PDAC (p = 0.02) and PNET (p = 0.003). There was no difference between PDAC and PNET (p = 0.15). Qualitative characteristics by groups are summarised in Table 2.
Figure 1
The tumour border feature. A) The tumour located at pancreas body (black star) has invaded the celiac trunk (white arrow), portal vein, portosplenic confluence, and lesser curvature of the stomach (black arrow), and this was categorised as ill-defined irregular margin border feature (histopathologically proven as pancreatic ductal adenocarcinoma). B) Isodense mass located at the level of the uncinate process of the pancreas (black star) is in close proximity to the superior mesenteric vein and mesentery, but there is no invasion (white arrow), so this lesion is categorised as well-defined regular margin (histopathologically proven as pancreatic neuroendocrine tumour)
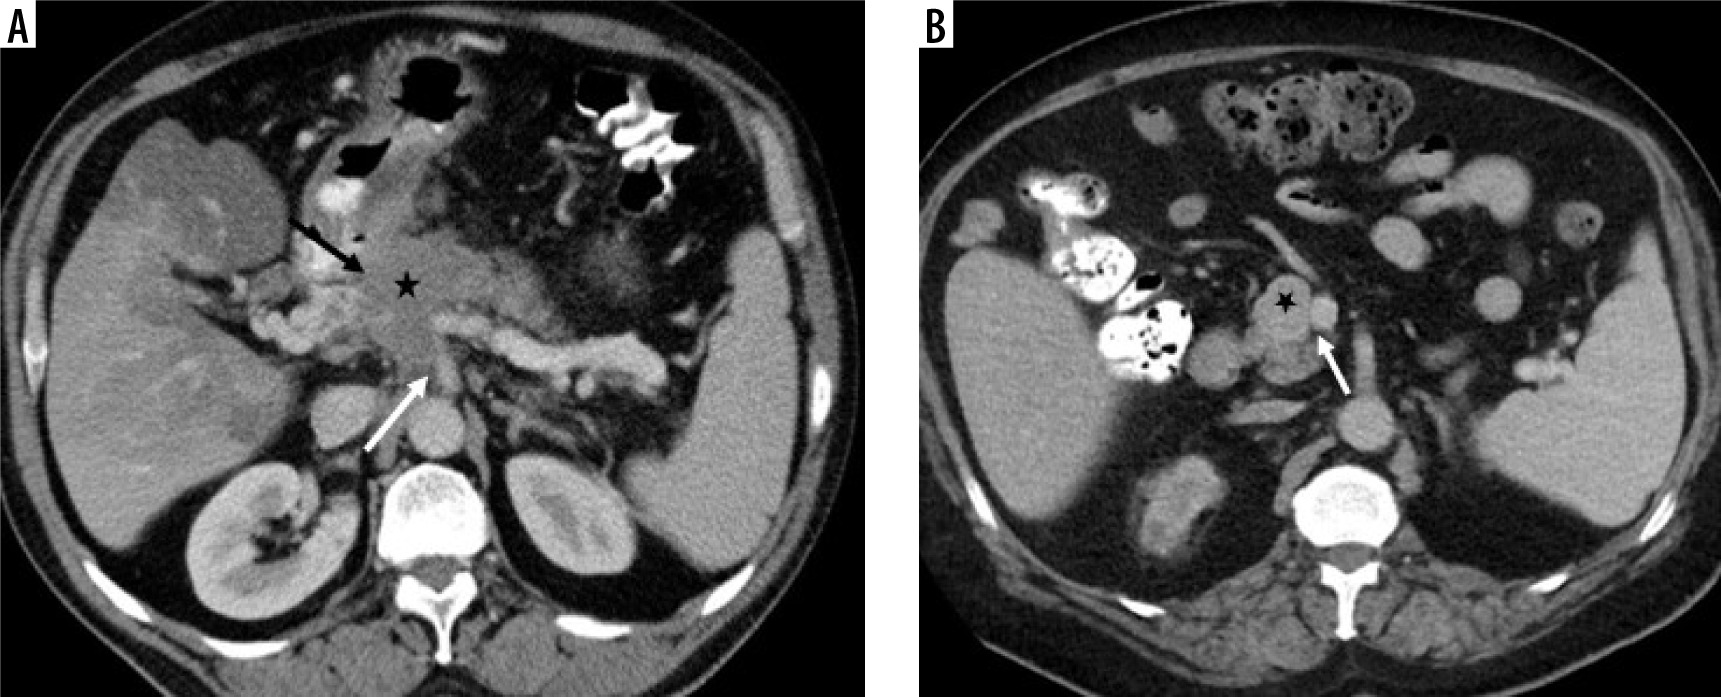
Figure 2
Visual tumour density. A) The mass located at the level of pancreatic head-uncinate process (white arrow) visual tumour density was evaluated as isodense (histopathologically proven as pancreatic neuroendocrine tumour). B) The visual tumour density of the poorly circumscribed mass (white arrow) located in the tail part of the pancreas was evaluated as hypodense (histopathologically proven as pancreatic ductal adenocarcinoma), and there are metastases with similar features in the liver (black arrows)
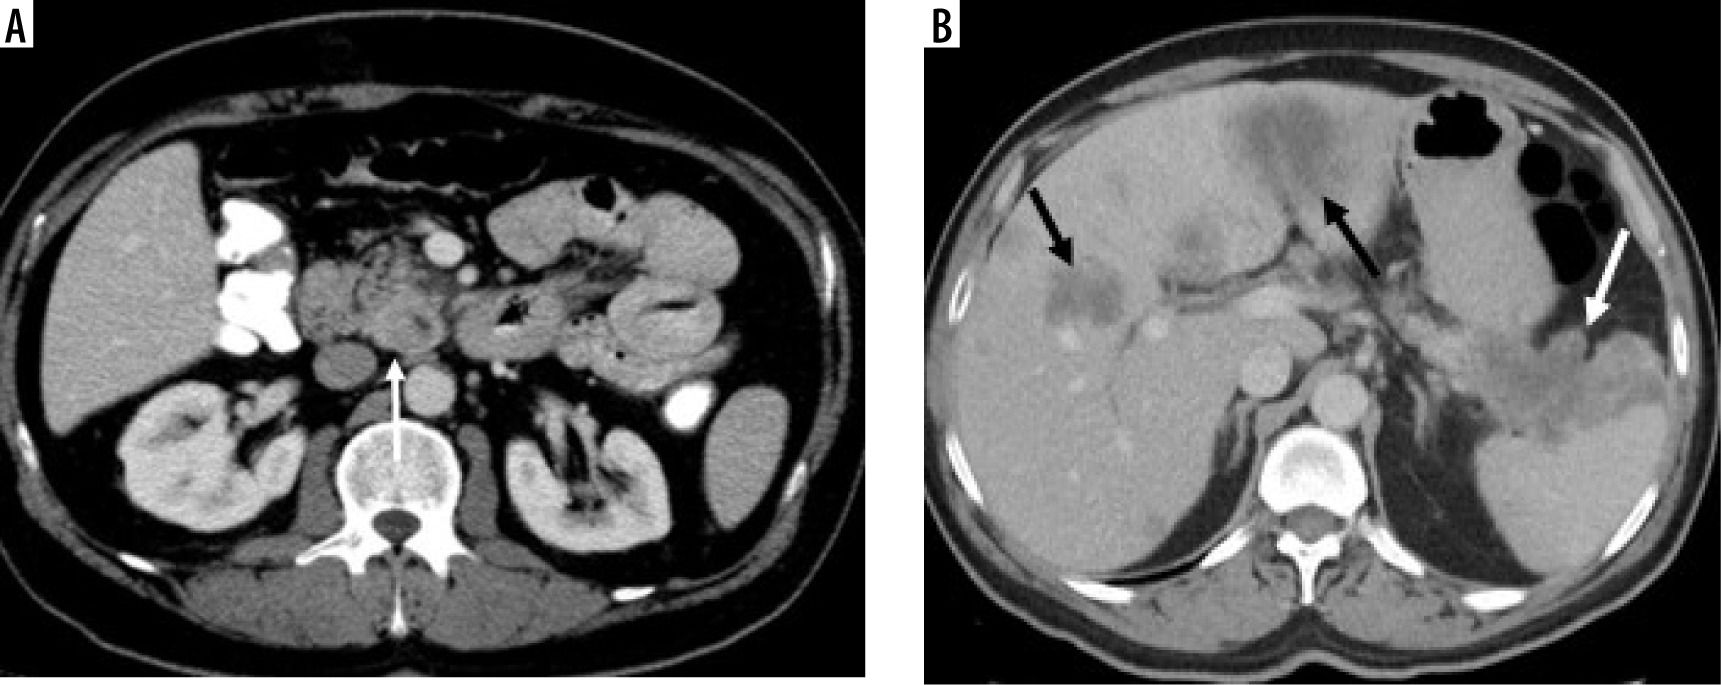
Figure 3
A mass with regular borders, located in the neck of the pancreas, with a cystic component in the central of tumour and hyperdense peripheral solid components (white arrow) (histopathologically proven as pancreatic neuroendocrine tumour)
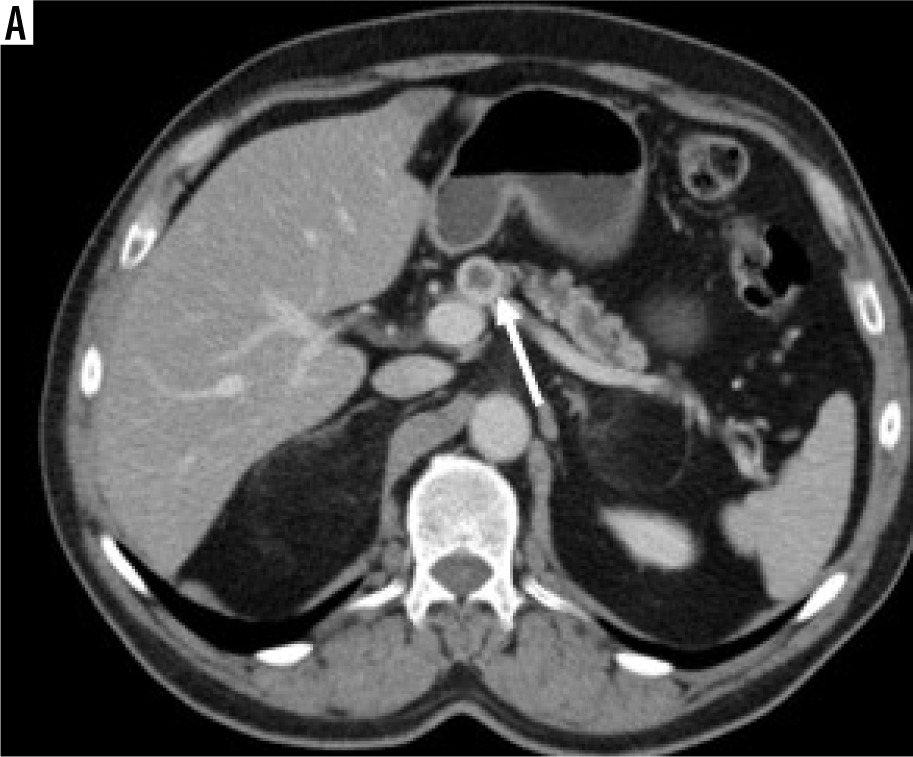
Figure 4
Large mass in the body and tail of the pancreas (white arrows) has irregularly hypodense areas without contrast enhancement (black stars), consistent with necrosis (histopathologically proven as sarcomatoid carcinoma)
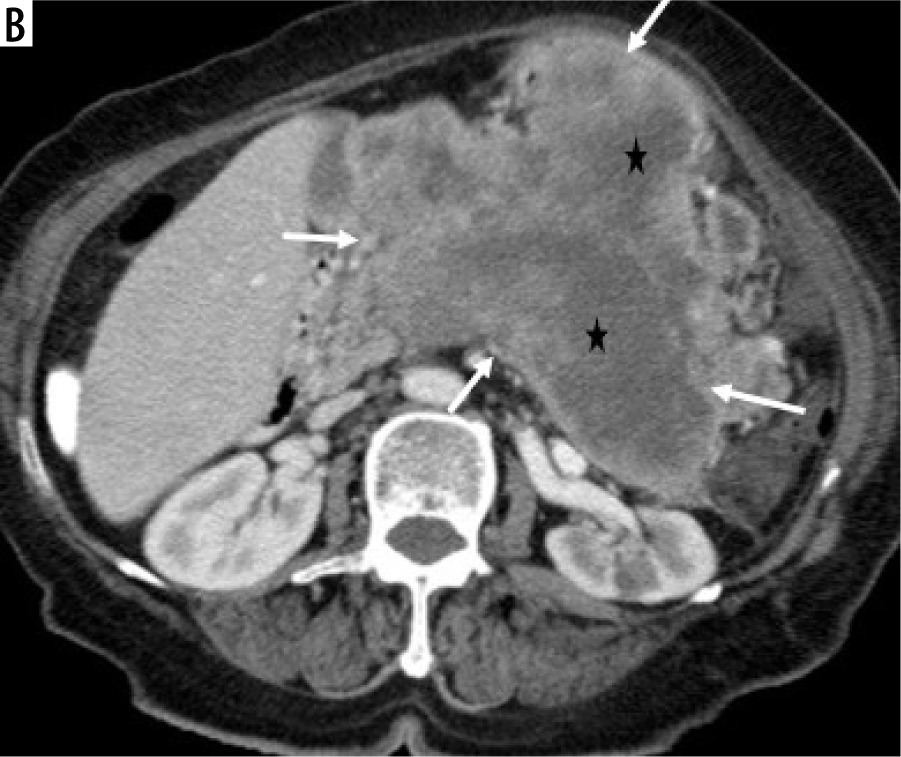
Table 2
Qualitative CT characteristics by histopathological group
In quantitative analysis, the group with the largest tumour size was SC, the difference between this group and the PDAC and PNET groups was significant (p = 0.0001 for both). Tmden differed between groups, with the difference between PDAC and PNET (p = 0.002). Tmden/VPden and Tmden/PanPden also differed between groups, with the difference being between PDAC and PNET for both (p = 0.0001 for both). Quantitative characteristics by groups are summarised in Table 3.
Table 3
Quantitative CT characteristics by histopathological group
It was investigated whether quantitative and qualitative parameters differ according to tumour grade in PDAC and PNET patients. Grade information was available in 135 (98.54%) of 137 patients with PDAC. Twenty-three (17%) patients were grade 1, 67 (49.6%) patients were grade 2, and 45 (33.3%) patients were grade 3. Except for the presence of cystic density in the tumour (p = 0.01), other parameters (tumour localisation p = 0.39, internal structure feature p = 0.08, tumour border feature p = 0.29, presence of necrosis p = 0.10, visual tumour density p = 0.05, tumour size p = 0.05, Tmden p = 0.84, Tmden/VPden p = 0.64, anf Tmden/PanPden p = 0.23) were not different between the groups. This difference (presence of cystic density) was between grade 3 PDACs and grade 1 and grade 2 (p = 0.02, p = 0.04, respectively). Grade information was available for 7 (46.6%) patients with PNET. 5 (71.4%) patients were grade 1, one (14.3%) patient was grade 2, and one (14.3%) patient was grade 3. Because only 2 of the patients with PNET had necrosis, statistical evaluation could not be made in this respect. There was no difference between the groups in any other parameter (tumour localisation p = 0.74, internal structure feature p = 0.49, tumour border feature p = 0.87, presence of cystic component p = 0.75, visual tumour density p = 0.10, tumour size p = 0.84, Tmden p = 0.39, and Tmden/VPden p = 0.15, Tmden/PanPden p = 0.37).
Table 4 shows significant qualitative and quantitative imaging features and their presence in the tumour types.
Table 4
Significant qualitative and quantitative imaging features and their presence in the tumour types
Discussion
In this study we evaluated the relationship between the qualitative and quantitative imaging features of portal venous phase abdominal CT in solid pancreatic tumours with tumour type and tumour grade, and concluded that it is possible to predict tumour type (PDAC, PNET or SC) and tumour grade in patients with PDAC with some quantitative and qualitative features. The tumour’s border feature being well-circumscribed and regular, iso- or hyper-dense, containing a cystic component, having higher Tmden, and high Tmden/VPden and Tmden/PanPden ratios were helpful parameters in differentiating PNET from PDAC. While SC can mimic the imaging features of both PDAC and PNET, necrosis, and tumour being larger are the para-meters that can be used to differentiate it from both tumour types. We found that the presence of a cystic component is a significant parameter in predicting histopathological grade in PDAC patients. Patients with high-grade (grade 3) PDAC could be differentiated from those with grade 1 and 2 PDAC by the presence of a cystic component.
Although PDAC is a hypovascular tumour due to the high amount of fibrous stroma it contains, there are studies reporting that intratumoural microvascular density and the degree of enhancement can vary according to pathological grade [9-11]. Although PNETs are hypervascular tumours, it has been reported in the literature that there are atypical hypovascular PNETs whose imaging findings are similar with PDAC [12,13]. In our study, we found that 94.9% of the PDACs were hypo- or isodense in the portal venous phase image, and the tumour was hyperdense in only 5.1% of the patients. PNETs were iso- or hyperdense in 93.3% and hypodense in 6.7%. Tumour density in the portal venous phase was a useful parameter to distinguish between the 2 tumour subtypes. Jeon et al. reported that hyper- or isointense signal features in portal venous phase MRI are useful imaging features in distinguishing between PNET and PDAC, and they are seen more frequently in PNET patients [13]. Although that study was performed with MRI, the results are similar to those of our study. Reinert et al. examined the distinction between PDAC and PNET in portal phase images and concluded that both visual evaluation and quantitative evaluation (Tmden/PanPden) were not significant [8]. In our study, both visual and quantitative evaluation parameters (Tmden, Tmden/VPden, and Tmden/PanPden) were significant parameters that could be used in differentiation. In the Reinert study, while determining the ROI for HU measurement in the lesion and normal pancreatic parenchyma, the patient’s 18F-FDG-PET/CT, 68Ga-DOMITATE-PET/CT and MRI images were also evaluated, and the ROI was decided accordingly. We only used portal venous phase images for ROI location selection, and the difference in the number of patients in both general and subgroups may have caused inconsistent results. The common similar result of their and our study is that it is not useful to use the homogeneous/heterogeneous internal structure feature in the distinction. In our study, it was not possible to distinguish SC from PDAC and PNET by tumour density. SC is a rare tumour subtype, and there is limited information in the literature about the imaging features of SC. According to the results of our study, the tumour density of SC can mimic both PDAC and PNET, so based on tumour density, it is not possible to distinguish this tumour from PDAC and PNET. However, it is known that the prognosis of SCs is poor, so the pre-sence of necrosis and reaching large sizes, which are para-meters that can be used to distinguish imaging features from other tumours (PDAC and PNET), are compatible with this tumour behaviour. These 2 features are more common in malignant and aggressive tumours. According to the results of our study, because it can point to SC, it can also predict poor prognosis.
The degree of contrast enhancement is a parameter that has been studied for predicting grade in patients with both PNET and PDAC. Kim et al. found that hypo-dense enhancement in the portal venous phase was more common in high-grade PNETs [12]. Similar to this study, Chen et al. also reported in their study that poorly differentiated PNETs are hypovascular, and quantitative CT parameters support this [14]. In our study, no significant relationship was found between PNET grade and tumour density, but this may be due to the small number of patients with histopathological grade information in the study group. Grade information was available for only 7 patients, of which one was grade 3 tumour, and this tumour was hypodense, as stated in the literature. Seo et al. evaluated the tumour enhancement parameters with patho-logical grade in PDAC patients and found that the tumour-to-aortic enhancement fraction was higher in poorly differentiated tumours [9]. Their study was performed in triphasic CT (arterial, pancreatic, and late phase) protocol, and there is no information on late phase image analysis. Wang et al. used pancreatic phase CT in their study and found that pathological grade and tumour enhancement were negatively correlated (the higher the tumour grade, the lower the contrast enhancement). In this phase, all poorly differentiated tumours were observed as hypodense [10]. In our study, however, no correlation was found between tumour grade and visual tumour density in PDAC patients. This may be because the CT images in our study were obtained in the portal venous phase.
In our study, we found that the well-circumscribed regular border feature can be used to differentiate PNETs from PDAC. Similar to our study, Jeon et al. reported that this feature is seen more frequently in PNETs in portal venous phase MR studies and may be useful in distinguishing it from PDAC [13]. This feature has also been used in some studies to evaluate the grade of PNETs [12,15]. They reported that well-circumscribed regular border feature is more common in low-grade tumours, and poorly defined irregular border feature is more common in high-grade tumours [12,15]. In our study, we found that this feature was not significant in determining the PNET grade. This may be due to the small number of patients. There was one poorly differentiated tumour and 6 well and moderately differentiated tumours. The border features of all patients was well-defined and regular. Due to the small number of patients in both the total and subgroup, our results may not be generalisable in this sense.
It has been reported in the literature that both PNETs and PDACs can contain a cystic component [12,16-18]. However, there is no information about whether this feature can be used in the differentiation between 2 tumours. We found that the cystic component can be used to differentiate between these 2 tumours and is seen at higher rates in PNETs. It has been reported that the presence of a cystic component is more common in large and non-functioning tumours in PNET patients [18]. We did not evaluate tumour functions in our study, but there was no correlation between tumour size and the presence of a cystic component. In addition, the presence of a cystic component was associated with poor histopathological grade in PDAC patients, and there is no information in the literature on this subject. However, we think that this may be because PDACs are tumours that cause solid and desmoplastic reactions in general, and this situation is associated with undifferentiation. According to this result, we can speculate that the presence of a cystic component in the tumour in PDAC patients predicts a poor prognosis.
There were some limitations of our study. The first of these is the retrospective nature of the study. The other limitations of the study are that the examination was performed in a single centre, the number of patients in some subgroups was low, and the histopathological grade information of each patient, especially in patients with PNET, could not be obtained.
Conclusions
In portal venous phase abdominal CT, while ill-defined irregular margins, hypodense visual tumour density, no cystic component, low value of Tmden, low ratio of Tmden/VPden and Tmden/PanPden indicate PDAC; regular margins, iso-or hyperdense visual tumour density, cystic component, high value of Tmden, high ratio of Tmden/VPden and Tmden/PanPden indicate PNET. SC can be differentiated from PDAC and PNET by containing necrosis and reaching larger sizes. The presence of a cystic component in PDAC patients indicates high grade.