


Introduction
Progress in imaging techniques has led to the deve-lopment of new diagnostic imaging modalities and the production of vast amounts of data. At the same time, methods have been developed for selecting and processing the obtained information into quantitative data and then analysing them automatically. This process has become the basis of radiomics.
Visual analysis of images in daily clinical practice is based on qualitative descriptors (such as signal intensity, density, heterogeneity, and level of contrast enhancement) or simple quantitative characteristics (for example, dimension, volume, and number of lesions). The sensitivity and repeatability of such measurements are low, with high measurement errors, and they are strongly dependent on the experience of the evaluating radiologist. Computational methods eliminate these disadvantages with automatic extraction of the right features from the imaging data and objectification of the analysis.
Neurooncology is one of the specialties in which the advances in radiomics are most noticeable. Furthermore, researchers are working on targeted therapy for the treatment of gliomas, especially glioblastomas (WHO grade 4). Precise selection of therapy based on quantitative features extracted from magnetic resonance imaging (MRI) performed at the beginning of the diagnostic pathway could have a beneficial impact on these patients’ length of survival.
In this article, the authors describe the methodology and their first experience in creating a predictive model based on radiomic features obtained from the preoperative MRI examination of patients with glioblastoma. The endpoint of the model is a correlation between radiomic features of glioblastomas (WHO IV) and progression-free survival. High-grade glioblastomas are the most common malignant brain tumours, and they represent one of the most serious challenges in modern neurooncology [1]. It should be emphasized that current attempts are being made to build an even more detailed predictive model correlating quantitative features with genetic test results (radiogenomics).
Overview of the radiomics process
Several main stages can be distinguished in the process of creating a radiomics-based predictive model (Figure 1), which include the following:
Performance of magnetic resonance imaging (MRI) of the head in patients with glioblastoma, as in the pre-viously approved protocol.
Identification of the region of interest (ROI) and segmentation of the selected area.
Preprocessing and extraction of the radiomic features of gliomas.
Analysis of the acquired data based on machine learning.

In the authors’ case, they supplemented the obtained database with clinical data, i.e. the time to recurrence. Finally, they expect to obtain a predictive model that, based on radiomic features of glioblastoma, gives the result of the individually predicted time to recurrence.
Magnetic resonance imaging
MRI is the gold standard for the diagnosis and monitoring of gliomas [2]. The basic MR examination protocol, which consists of T1-weighted images (T1WI), T2-weighted images (T2WI), fluid-attenuated inversion recovery (FLAIR) sequence, and contrast-enhanced T1-weighted images (CE-T1WI), can be extended to provide additional sequences. The authors base their analyses on an extended study protocol with apparent diffusion coefficient (ADC) maps. These advanced MR imaging methods provide a better view of the tumour morphology and biology.
Identification of a region of interest and segmentation
Malignant regions of tumour may be divided into sub-compartments [3]. Enhancing tumours (ET) are represented on CE-T1WI. Necrosis (NCR) and non-enhancing tumours (NET), which can be delineated based on CE-T1WI images and T2WI-FLAIR sequences, are commonly located in the central region of the tumour.
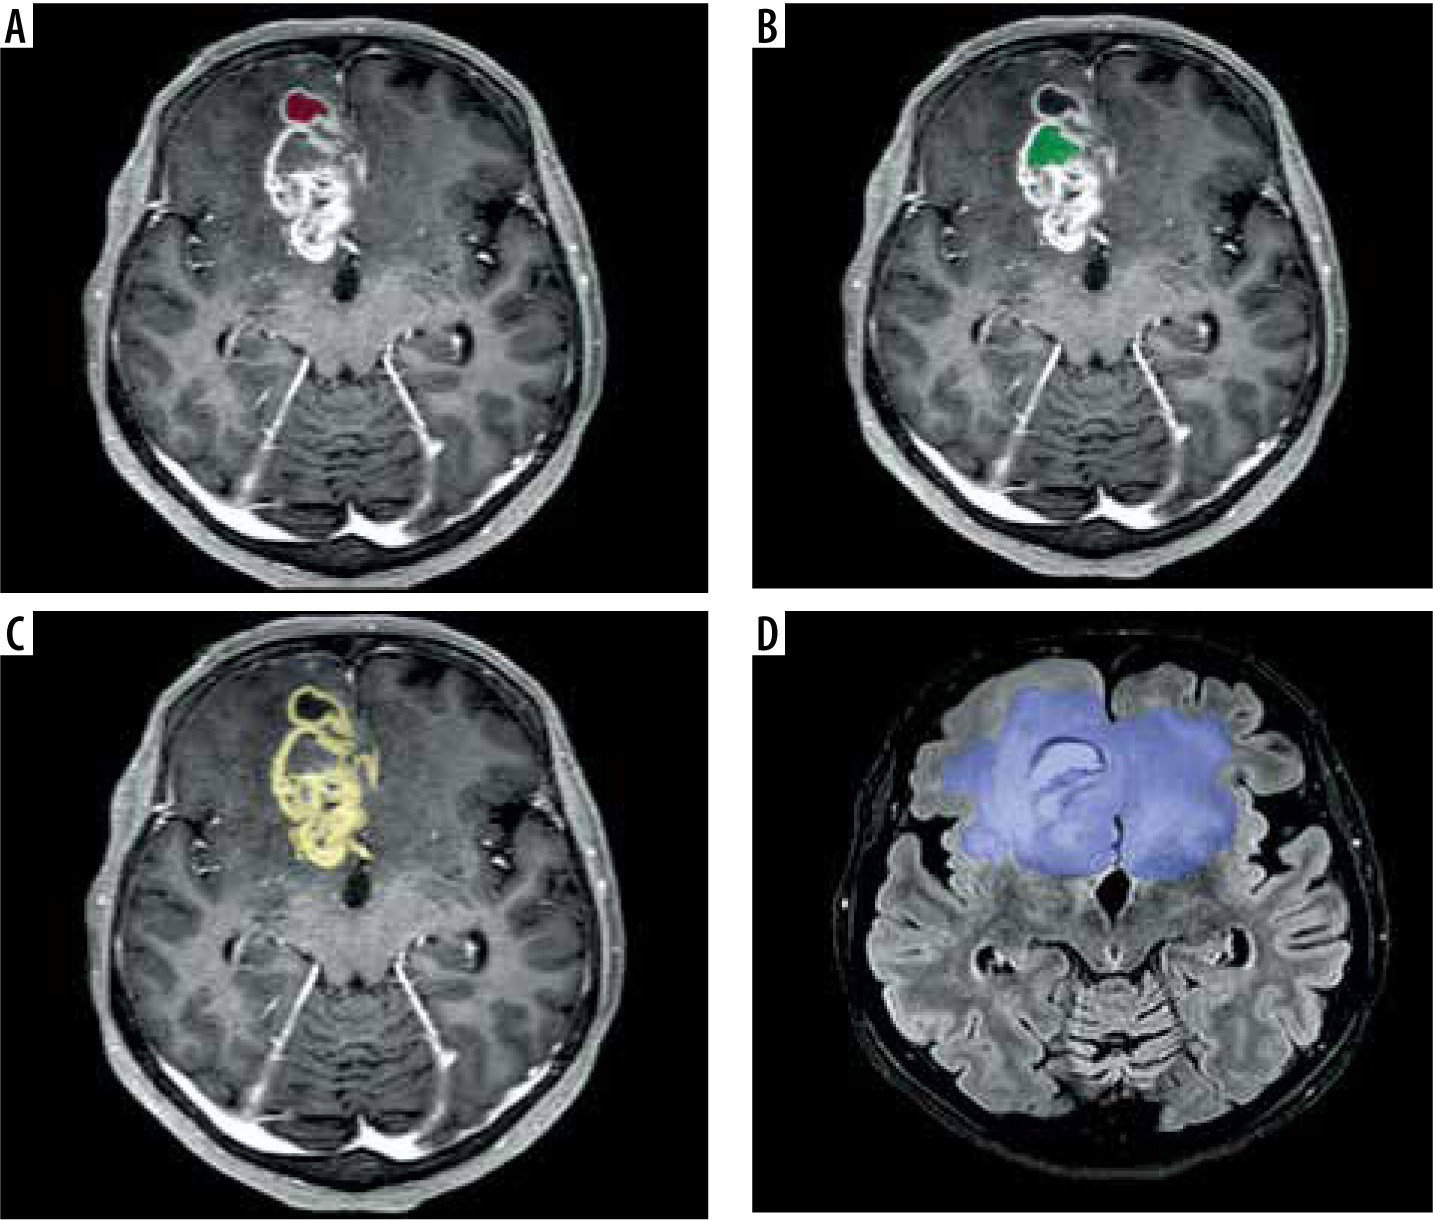
Peritumoral oedema (ED), which represents both infiltrative non-enhancing tumour and tumour-related oedema can be delineated as hyper-intense T2WI-FLAIR signals surrounding these lesions (Figure 2).
Figure 2
A) CE-T1WI MRI slice with annotated necrosis (NCR) (red). B) CE-T1WI MRI slice with annotated non-enhancing tumour (NET) (green). C) CE-T1WI MRI slice with annotated enhancing tumour (ET) (yellow). D) FLAIR MRI slice with annotated tumour core (TC) and peritumoral oedema (ED) (blue)
These regions can be segmented manually or automatically. Currently, manual segmentation is considered the gold standard, with high accuracy [4]. However, several automated segmentation methods utilizing deep learning (DL) architectures exist.
There is still a lack of consensus on the most appropriate ROI area. GBMs are known to extend beyond the border of the TC, affecting brain tissue even in distant areas. Extension of ED has been correlated with poor prognosis [5].
This is why the authors will base further steps in the development of the radiomic-base model on 2 segmented areas:
Extraction of radiomic features of glioblastoma
In this step, it is important to preprocess the data. Preprocessing is the transformation of an initial image to enhance the image quality and increase the repeatability and comparability of statistical analysis [6]. This is particularly important when examinations have been performed on different MRI scanners. In this step, the authors used normalization, resampling, and discretization to improve data quality.
Algorithms that identify tumour size, shape, intensity, and heterogeneity are used to generate quantitative information for radiomic analysis. We can divide radiomic features into 3 main groups:
Morphological features
Morphological features describe geometric aspects of a region of interest (ROI). There are 16 main shape-based features for 3D ROI and 10 main shape-based features for 2D ROI, such as surface area and circumference of the tumour [7]. Both the dimensions and their ratios are important characteristics of gliomas. It has been shown that an increased surface area/volume ratio of a lesion indicates the spicularity of the lesion, and therefore its higher malignant potential compared to an oval lesion for which the ratio is lower [8].
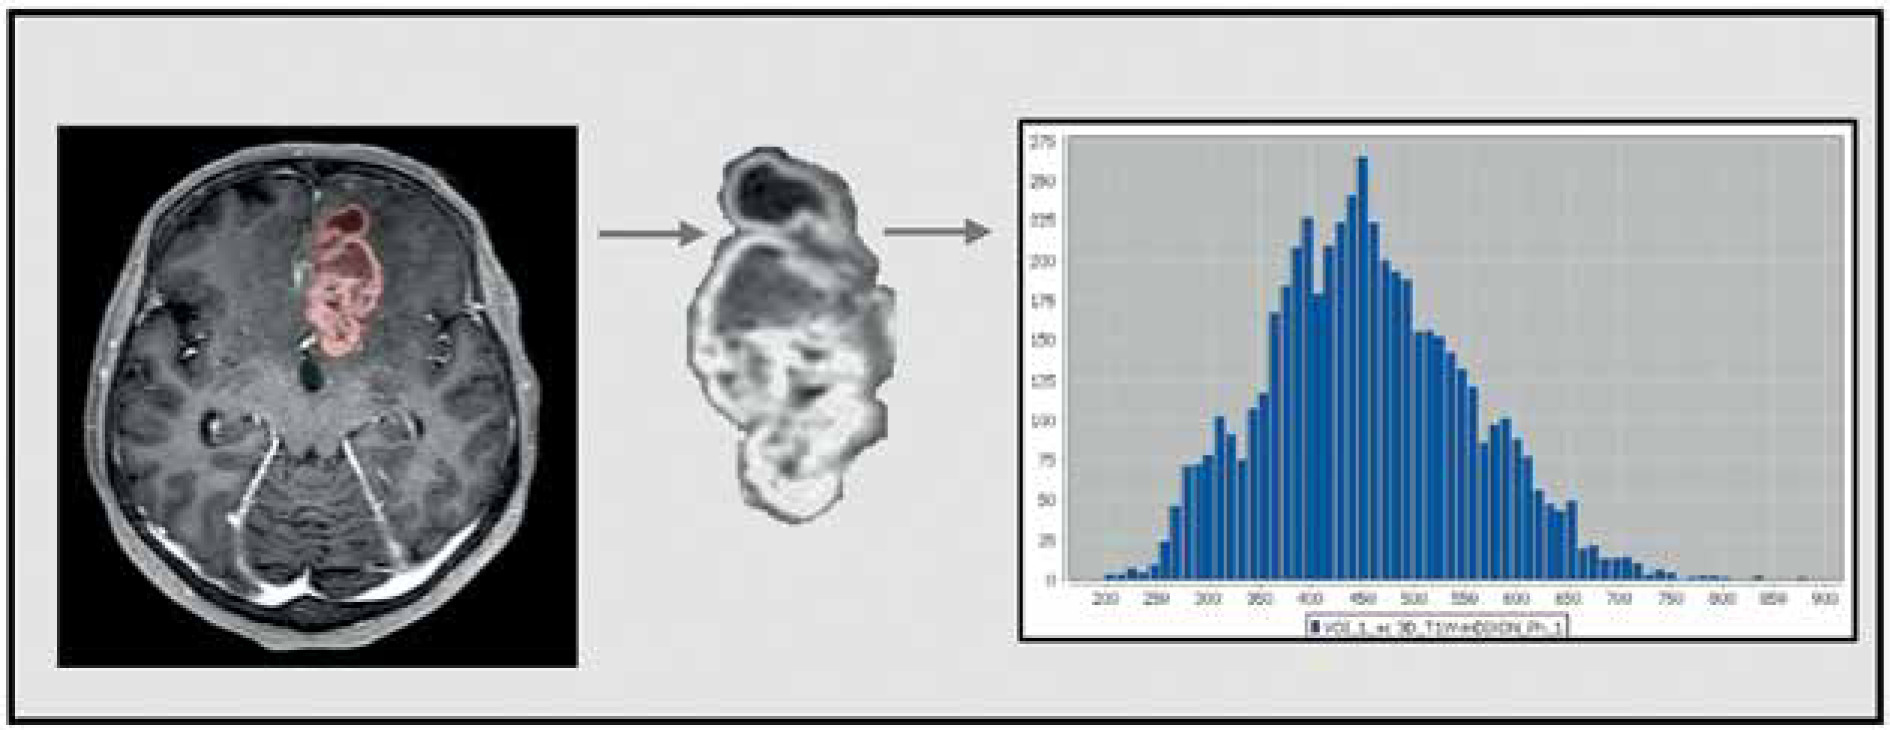
First-order features
First-order features refer to analyses of a single pixel or voxel. They are based on a grey-level histogram and describe in a statistical way the intensity within the region of interest (ROI) by, for example, minimum, maximum, mean, maximum, percentiles, and kurtosis [7] (Figure 3).
Texture-based features
Texture-based features are the most complex, and they describe the heterogeneity of the ROI. The most popular group of texture features is the grey-level co-occurrence matrix (GLCM) (Haralick features). GLCM describes the spatial relationships of adjacent pairs of pixels (or voxels) with grey-level intensities.
Other well-known second-order parameters include the grey-level run length matrix, grey-level size zone matrix, neighbouring grey-tone difference matrix, and grey-level dependence matrix [7]. It has been proven that the degree of tumour heterogeneity is a prognostic determinant of survival [9].
The authors used commercially available FDA-approved Olea Sphere software from Olea Medical SAS for image analysis. A total of 92 radiomic features were collected from each ROI: 19 first-order metrics, 10 shape-based, and 75 second-order metrics consisting of 24 GLCMs.
Each group of features is derived from every sequence (Figure 4).
Figure 4
A) CE-T1WI MRI slice with annotated tumour core (TC). B) T1WI MRI slice with annotated tumour core (TC). C) T2WI MRI slice with annotated tumour core (TC). D) ADC MRI slice with annotated tumour core (TC)

I. Contrast-enhanced, T1-weighted images. Intravenous administration of contrast media enables delineation of the tumour core [3]. Combined with data obtained from T1WI, radiomic features can precisely describe the type of lesion enhancement.
II. T1-weighted imaging is included in the basic MRI brain imaging protocol [2]. T1-weighted images are charac-terized by a very good representation of brain morphology. Glioblastoma (WHO IV) on T1-weighted images is cha-racterized by heterogeneous hypo-/isointense signals [10].
III. T2-weighted imaging and FLAIR sequences are also a part of the standard brain imaging protocol [2]. They allow us to delineate the zone of the surrounding oede-ma [3]. It has been shown that Haralick features derived from the T2W-FLAIR sequence can predict the survival of patients with glioblastoma [11]. In addition, a T2WI-FLAIR mismatch sign is being investigated, which can indicate the presence or absence of specific mutations [12].
The authors’ study is based on an extended MRI protocol, and the radiomic feature database is extended with data extracted from apparent diffusion coefficient (ADC) maps.
IV. Diffusion-weighted imaging (DWI) may quantify the random Brownian motion of water molecules throughout GBM tissues. These maps highlight regions of restricted diffusion, which may be caused by necrosis or hypercellular tumours [13]. Various studies show that ADC values might be useful in the diagnosis and prognosis of gliomas [14].
Data analysis
The first step is the dimensionality reduction of the dataset to obtain an optimal set of parameters. The feature selection is necessary to find and remove irrelevant, unstable data from the analysis. Without this, overfitting, and consequently false results, can occur even with a very large sample size. A well-known feature selection method – ReliefF – is frequently used [15]. ReliefF is an algorithm that is based on nearest neighbours – a machine learning model (ML) [16].
Following feature selection, a collection of selected features can be utilized to develop machine learning models. ML refers to algorithms that are programmed to learn from observations and make statistical inferences based on what they have learned [17]. In radiomics, various techniques can be chosen. It is impossible to select one method that is most effective for a wide range of radiomic feature analysis problems. Two main groups of classifiers can be distinguished: supervised and unsupervised. In unsupervised techniques, the target labels are unknown. In supervised techniques, prior to the analysis, radiomic data should be supplemented with clinical data [18]. With this additional information, the supervised technique uses a predetermined collection of known labels to identify the features that best reflect the outcomes of interest. In a standard approach to data analysis without artificial intelligence (AI) techniques, the process can be presented as supplying data to an algorithm created by a programmer and then expecting results. In an approach based on ML, the computer has to create an algorithm by itself that best finds the patterns or correlations. Depending on the clinical data with which the database has been enhanced, the machine learning model can be used to predict target factors in the present, such as the absence or presence of a specific type of tumour, and future variables like responding to therapy or survival. There are numerous ML models in both the supervised and unsupervised groups [19]. Figure 5 shows examples of the machine learning models most widely used in radiomic analysis.
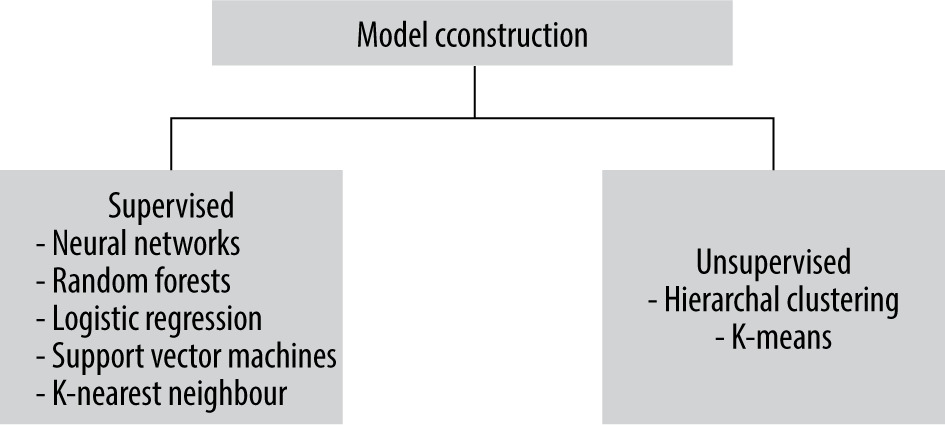
The authors will a supervised ML model and supplement their database with clinical data – time to progression. It is still unknown which ML algorithm will learn the most from the collected data. They expect the greatest value from densely connected neural networks, random forests, and K-nearest neighbours will also be tested. As a result, they wish to obtain a model that can predict progression-free survival with certain accuracy and specificity.
Conclusions
Radiomics is a young and fast-growing branch of modern radiology. The creation of radiomic models requires carefully adherence to all the steps discussed. Efforts to standardize them are ongoing and will ultimately simplify the publication of meta-analyses.
Neurooncology is a specialty in which radiomics can play a particularly important role. In medical publications, there are an increasing number of reports on the correlation between the radiomic features of glioblastomas and the course of the disease. Radiomic models can provide information on individual mutations, on which the latest WHO classification of gliomas from 2016, updated in 2021, is based. Early identification of malignant glioblastoma subtypes characterized by different prognoses and responses to treatment would greatly facilitate the implementation of targeted therapy, which appears to be the future of glioblastoma treatment.
The purpose of this review was to provide an introduction to the topic the authors are working on. They intend to present the results of their work soon.