


Introduction
Duchenne muscular dystrophy (DMD) is the most common and severe form of muscular dystrophy, typically characterised by progressive muscle weakness, which leads to increasing disability [1]. Diagnosis of DMD is suspected in boys with a family history of DMD, slowness or inability to perform movements, pseudo hypertrophy of muscle, markedly elevated serum creatine kinase (CK) level, and electromyography (EMG) findings of increased insertional as well as spontaneous activity: brief, small, polyphasic muscle unit action potentials with early recruitment. Diagnosis is confirmed by genetic testing (mutation, deletion, or duplication in the dystrophin gene) and/or muscle biopsy [2]. However, although of diagnostic value, CK is not a reliable marker for disease progression and is unable to differentiate between types of muscular dystrophies [3]. Muscle biopsy has been used for diagnosis but is an invasive technique; evidence of histopathological and immunohistochemical changes are limited to the muscles sampled, and due to pain, it is difficult to use in children [4]. EMG requires cooperation of the patient and can be very painful due to needle insertion. This may also cause muscle soreness for several hours, making EMG also difficult to administer in children [5]. In recent years, neuromuscular imaging has become an important noninvasive adjunct to clinical diagnosis and to monitor disease progression. T1-weighted (T1-W) magnetic resonance imaging (MRI) provides the ability to highlight fat/muscle delineation, making it valuable to define involvement of muscles in DMD [6]. The non-ionising radiation and non-invasive nature of the technique makes it helpful for diagnosing the disease, assessing disease progression, and monitoring the results of treatment.
Musculoskeletal magnetic resonance imaging (MRI-MSK) can aid in the evaluation of the degree and pattern of fatty infiltration and dystrophy in individual muscles and large muscle groups with relative ease. Several studies using MRI-MSK have demonstrated a pattern of muscle abnormality in patients with DMD [7-12]. These patterns can narrow the differential diagnosis and aid in diagnosis without the necessity for muscle biopsy [7]. Also, because of its high soft tissue contrast and ability to assess deeper muscle groups, MRI-MSK can be a very useful tool to assess disease progression in muscular dystrophy [13-15]. Semi-quantitative assessment of transverse T1-W images is a simple, reliable, and reproducible tool for identifying the muscle involvement pattern and progression [14]. Previous studies have shown that gluteus maximus and adductor magnus muscles showed highest fatty infiltration followed by quadriceps and long head of biceps femoris muscles [7,8,10]. The gracilis, sartorius, semimembranosus, and semitendinosus muscles are known to be relatively spared [14-17]. Additionally, in the lower leg, superficial posterior compartment and peroneal muscles show more involvement in DMD patients [16,17]. However, characteristic muscle involvement in relation to age, describing the natural disease history, has not been studied. Additional MR techniques have been used to enable objective and more sensitive quantification of muscle involvement. Li et al. in 2016 demonstrated that diffusion tensor imaging (DTI), which measures fractional anisotropy (FA), can be used to quantitatively assess disease severity [18]. However, FA values were studied for 4 thigh muscles only and excluded gluteus maximus and adductor magnus, which are known to be the most consistently affected muscles [19,20]. Also, the correlation between FA values and clinical assessments was not evaluated. Changes in FA values with increasing age and muscle weakness were not considered in previous studies [21,22].
The purpose of our study was therefore the following:
To identify the characteristic muscle MRI pattern and extent of muscle involvement across the age range of 4 to 22 years and to study the correlation between MRI grade score and age.
To evaluate the correlation between MRI T1-W grade score and muscle strength and function.
To study and evaluate the pattern of muscle involvement based on FA values measured with DTI during different stages of disease.
To estimate the correlation between FA values and muscle strength and function.
To study the correlation between FA values and MRI T1-W grade score of fatty infiltration.
Material and methods
Patient selection and inclusion criteria
Written informed consent was obtained from the parents of the children before the MRI examination. Patients with a confirmed diagnosis of DMD were included in the study. The diagnosis was established based on raised serum creatine phosphokinase (> 10 times normal), genetic testing, family history, and the presence of clinical symptoms typical of DMD [24]. Patient records between December 2010 and December 2016 were examined. Only the patients who had both MRI T1-W records and DTI measurement of FA values were included. Patients were receiving only standard treatment for DMD at the time of the MRI examination. All the patients had been examined clinically including assessment of muscle strength on manual muscle testing (MMT) and outcome measures like the Brooke-Vignos scale and non-quantitative MR imaging from the pelvis to mid leg [23,25].
Exclusion criteria
Due to insufficient data, MRI T1-W images of the upper limb were excluded from the analysis. Patients who had incomplete data for the lower limb and poor MRI images were also excluded.
Musculoskeletal MR acquisition protocol
All imaging assessments (MRI-MSK and DTI) were performed on a GE Signa system 1.5 T (GE Medical Systems, Milwaukee, WI) using an 8-channel body coil for transmission and reception. The MRI examination was performed from the iliac crest to the mid-lower leg. No sedation or contrast medium was administered to the patients. Conventional axial T1-W MRI images were conducted as follows: repetition time (TR)/echo time (TE), 500/17 ms; field of view (FOV) 48 × 24 cm2; matrix 572 × 192 and T2-weighted MRI images (TR/TE, 4000/100 ms) with fat suppression were acquired using a fast spin echo sequence to depict the anatomical structures. The slice thickness was 5-7 mm. Following conventional MRI, DTI images were acquired using an echo planer imaging (EPI) sequence with 25 gradient directions (thigh muscles). The acquisition parameters for DTI: b value, 600 s/mm2, TR/TE, 6000/62 ms, field of view (FOV) 48 × 24 cm2, matrix 192 × 160, slice thickness 7 mm. The total acquisition time for both conventional MRI and DTI for each patient was around 25-30 min.
Image analysis
The images were analysed using an offline workstation system (ADW; GE Healthcare) including pelvis, thigh, and mid-lower leg. Eighteen muscles (and/or muscle groups) were evaluated. From the pelvic region, the gluteus maximus was selected. From the thigh region, vastus medialis, vastus intermedius, vastus lateralis, rectus femoris, gracilis, sartorius, adductor longus, adductor magnus, semimembranosus, semitendinosus, and biceps femoris were selected. For antero-lateral compartments in the mid-lower leg, tibialis anterior; extensor hallucis longus (EHL), extensor digitorum longus (EDL) and peronei were selected. For posterior compartment, soleus, gastrocnemius, tibialis posterior, flexor hallucis longus (FHL), and flexor digitorum longus (FDL) muscles were selected.
All MRI-MSK scans were assessed in consensus with an experienced imaging specialist, and muscle involvement was scored non-quantitatively by using a scale described by Kim et al., as follows: grade 0 – homogeneous muscle signal intensity without fatty infiltration; grade 1 (minimal) – predominantly homogeneous muscle signal intensity with minimal scattered fatty infiltration; grade 2 (mild) – mild fatty infiltration with high T1 signal intensity involving less than 30% of the muscle bulk; grade 3 (moderate) – moderate fatty infiltration involving 30-60% of the muscle bulk, but with preserved differentiation between muscle and subcutaneous fat; grade 4 (severe) – severe fatty infiltration involving more than 60% of the muscle bulk with loss of demarcation between muscle and subcutaneous fat [26].
Fractional anisotropy values
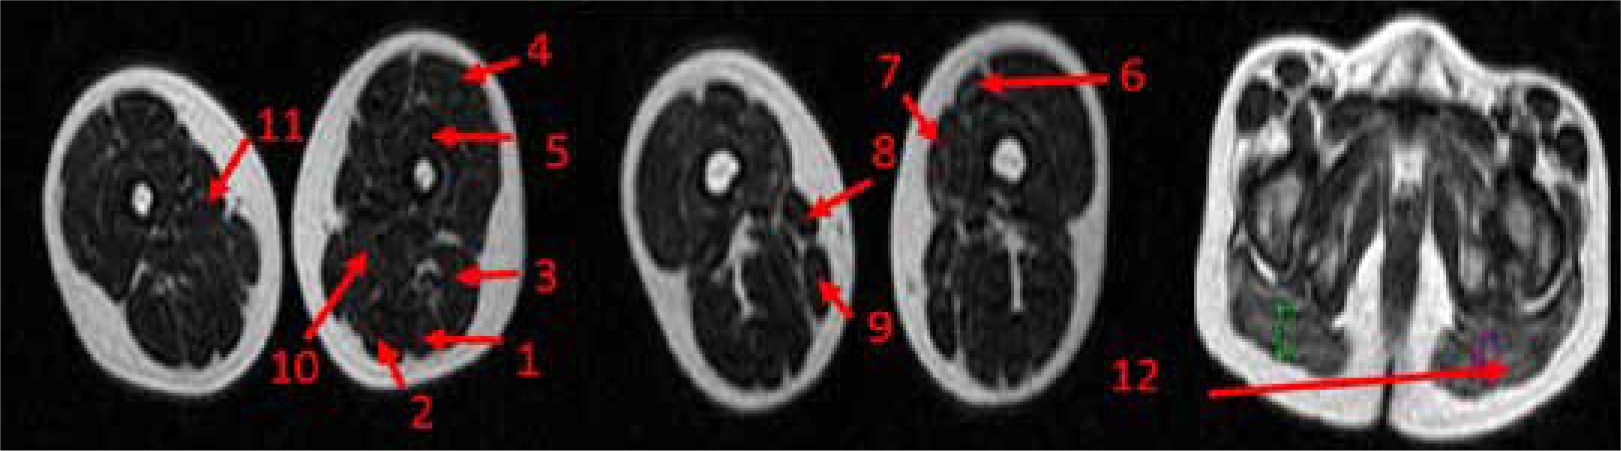
The DTI images and quantification of the parameters were processed using a function tool available on an off-line vendor provided workstation (ADW; GE Healthcare). The image reader was blinded to clinical information when quantifying the DTI parameters. To enable accurate measurement, slices were selected containing the largest area of visible muscle tissue and had good muscle compartment differentiation. Large circular regions of interest (ROI) were placed in specific muscles and quantified for corresponding FA values. For uniformity, anatomically identical ROIs were used in all patients. In patients with advanced disease progression, the placement of ROIs was difficult. FA values were quantified for gluteus maximus, sartorius, rectus femoris, vastus lateralis, vastus intermedius, vastus medialis, adductor longus, adductor magnus, gracilis, semitendinosus, semimembranosus, and biceps femoris muscles bilaterally; the ROIs for the same are shown in Figure 1.
Figure 1
Image showing positioning of regions of interest (ROIs) on thigh and gluteal muscles of DMD patients for measuring FA values
1 – semitendinosus, 2 – semimembranosus, 3 – biceps femoris, 4 – vastus lateralis, 5 – vastus intermedius, 6 – rectus femoris, 7 – vastus medialis, 8 – sartorius, 9 – gracilis, 10 – adductor longus, 11 – adductor magnus 12 – gluteus maximus.
Clinical assessments
All the included patients had undergone clinical examination by a physician and rehabilitation therapists. The clinical assessments considered for this study included lower extremity muscle strength measured with manual muscle testing (MMT). A revised version of the Modified Medical Research Council’s test (mMRC MMT [I]) was used to measure strength (Appendix 1). As compared to the original scale denoting no strength with a score of 0 and maximal strength with 5, the new scale was divided from 0 to 16 based on range of motion (Appendix 1). Lower extremity function was evaluated with the Vignos scale, which was performed by experienced occupational therapists.
Outcome measurement
T1-weighted musculoskeletal MRI
Pattern and severity of muscle involvement: The mean MRI grade score for each of the 18 assessed muscles was computed. The frequency of muscle involvement was calculated based on the percentage of patients affected as per the MRI grade. All the patients were grouped according to their age in increments of one year (i.e. ages 4-5 to > 2-22 years). With the help of descriptive and qualitative analysis, the pattern of muscle involvement with increasing age was identified. Factors considered to identify this pattern were earliest age at which muscles showed fatty infiltration, the age at which maximum MRI grade score was achieved, and the severity of MRI grade scores.
Correlation analysis
Correlation with age: 1. The mean MRI-MSK grade score of all the patients for individual muscles was computed and tested for correlation with age. 2. The mean MRI-MSK grade score of all the muscles was computed for each patient and tested for correlation with age.
Correlation with muscle strength: 1. In the thigh region, the individual muscles were grouped according to functional movements tested clinically on MMT, and the mean MRI-MSK grade for the group was computed (Table 1) and tested for correlation with mean MMT grade. 2. In the lower leg, the individual muscles’ (peronei; tibialis anterior; and EHL and EDL) mean MRI grades were tested for correlation with mean MMT grade.
Table 1
Grouping of thigh muscles according to functional movements assessed on MMT
Correlation with function: The Vignos scale was used for functional evaluation of the lower extremities. The mean MRI grade score was computed for each of the patients and tested for correlation with the Vignos scale score.
Fractional anisotropy values measured with DTI
Pattern of muscle involvement
Mean FA values of all the patients for each of the thigh muscles was computed. Descriptive analysis was used to identify the most severely affected muscles and the pattern of involvement with disease progression.
Correlation analysis
Correlation with age : Mean FA values of all the assessed muscles for each of the patients were computed and tested for correlation with age.
Correlation with muscle strength: Correlation of mean FA values of all the assessed muscles groups (Table 1) of each patient with mean MMT scores was tested.
Correlation with MRI grade score: Correlation between mean MRI grade score of pelvic and thigh muscles and the mean FA values of the same muscles was also tested.
Statistical analysis
Analyses were performed using SPSS, version 17.0 (SPSS, Inc., Chicago, Illinois). All the correlation analyses were performed by plotting scatter diagrams and using Spearman’s rank correlation coefficient. Correlation was considered statistically significant when the P value was equal to or less than 0.05. The strength of corelation was determined on the basis of Spearman’s coefficient value (Table 2) [27].
Table 2
Strength of correlation based on the value of correlation co-efficient
Results
In total, 78 patients’ data were included in the analysis (n = 78). The mean age was 10.7 ± 3.8 years, ranging between 4.8 and 21.7 years. There were 32 ambulatory and 46 non-ambulatory children.
Pattern and severity of muscle involvement
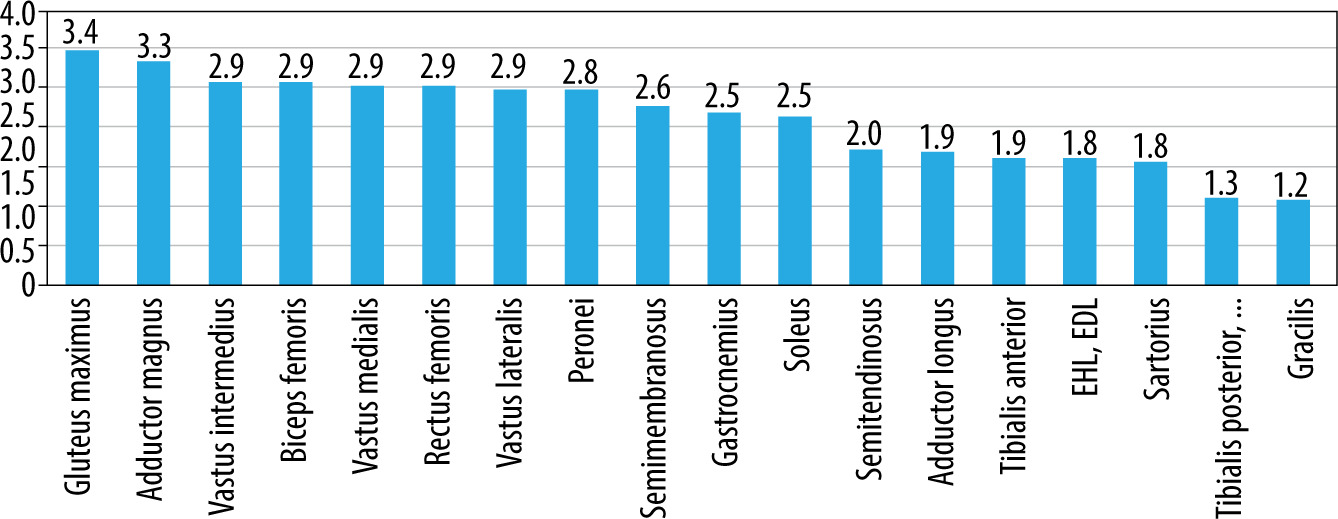
On MRI T1-W images, fatty infiltration was noted in all the 78 patients with DMD (Figures 2 and 3). Gluteus maximus had the highest mean MRI grade score followed by adductor magnus and then vastus intermedius (Figure 4).
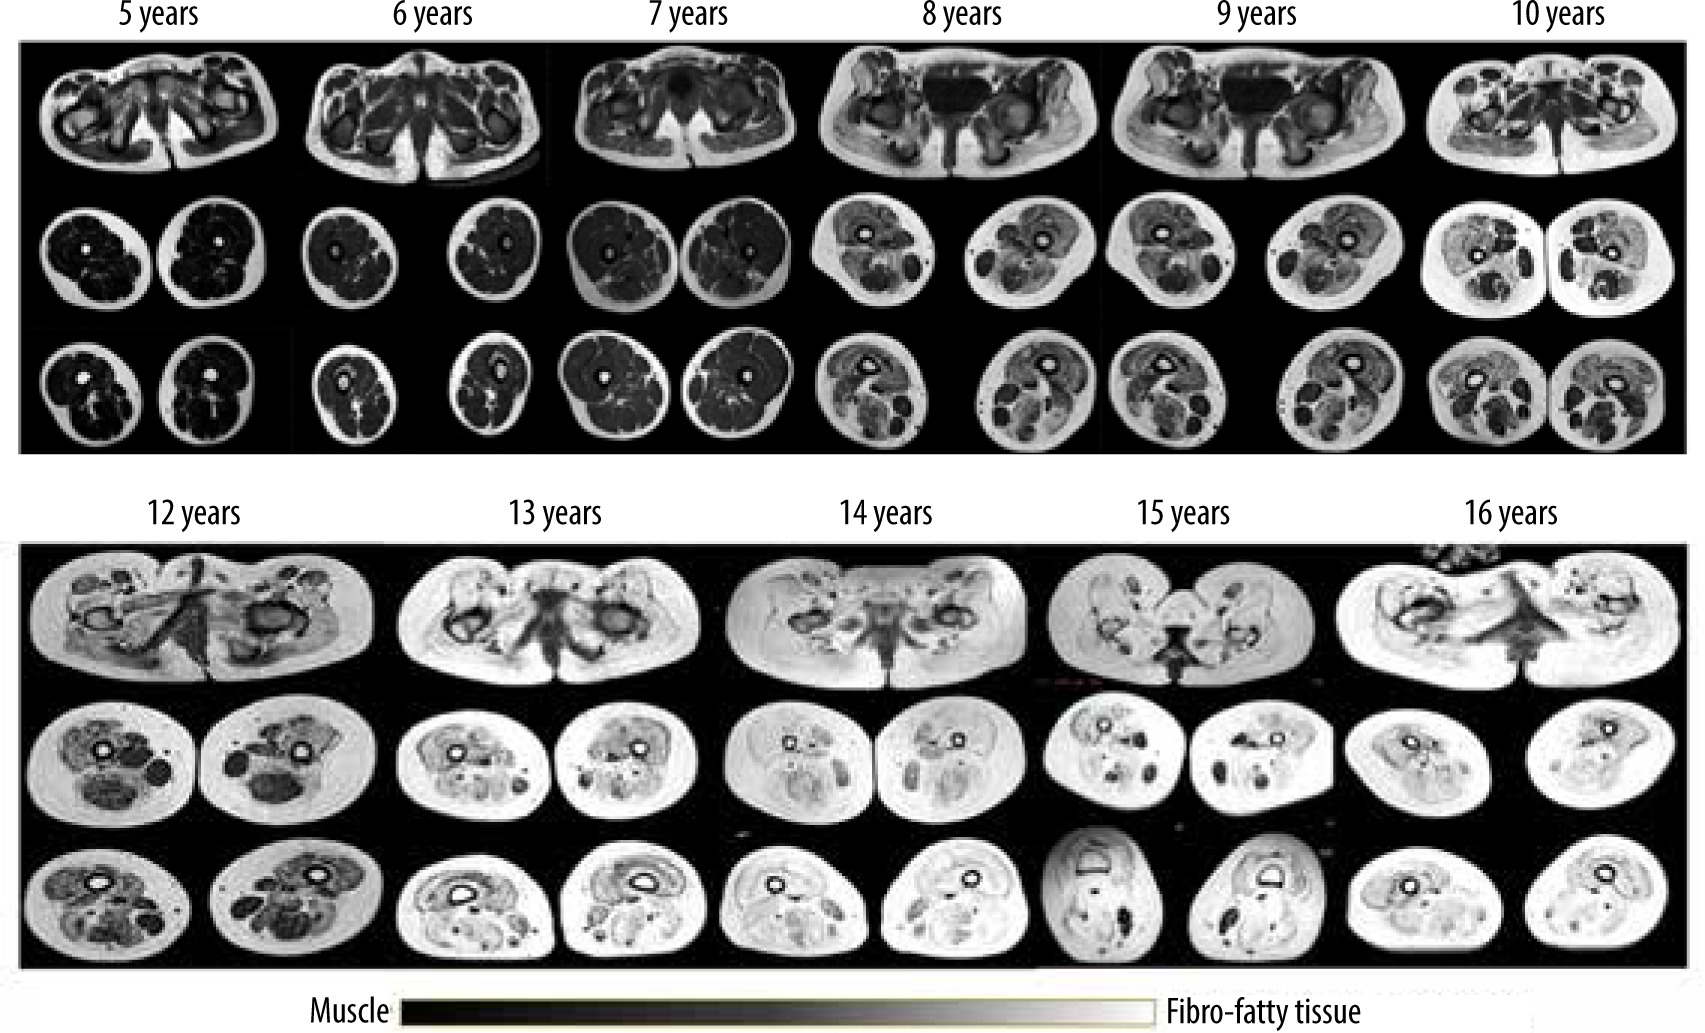
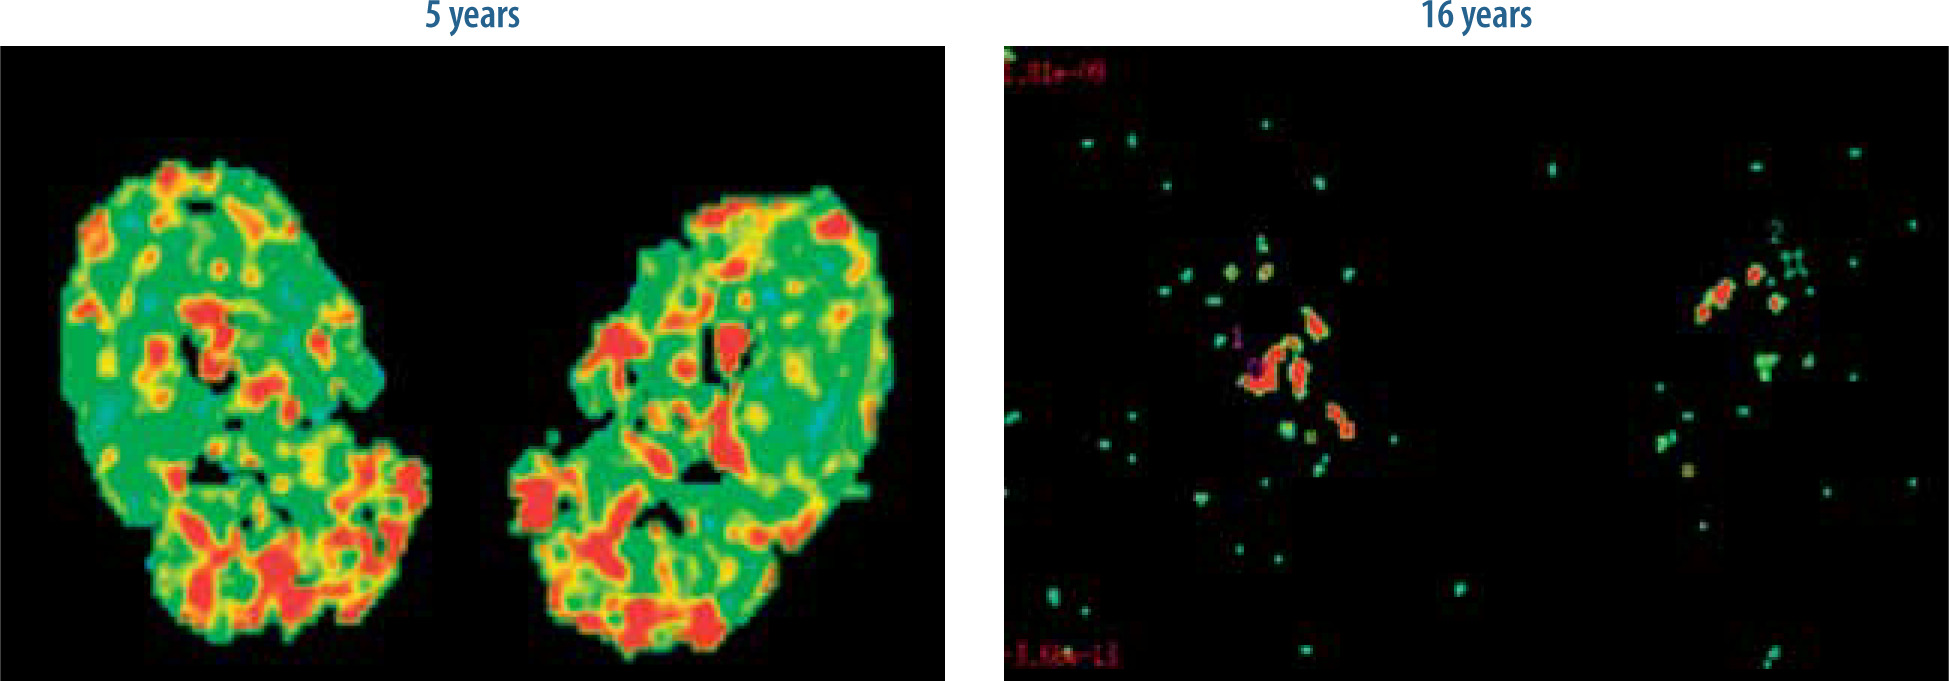
Figure 3
Increased fatty infiltration and muscle atrophy in a 16-year-old patient as compared to a 5-year-old
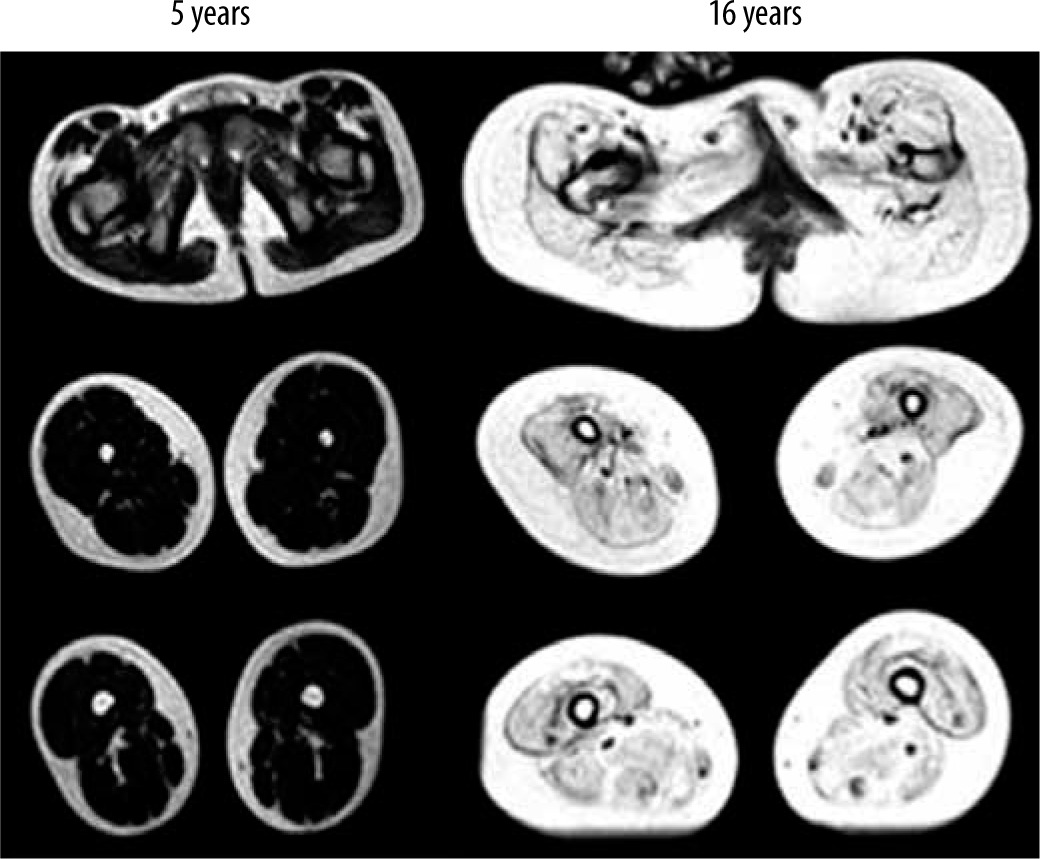
Figure 4
Bar chart shows the mean MRI grade score in each of the 18 pelvic, thigh, and mid-lower leg muscles in all
Earliest involvement of gluteus maximus muscle and adductor magnus (≥ grade 1, i.e. minimal infiltration) was seen between 4 and 5 years of age (Figure 5). Also, the gluteus maximus reached grade 4 by 12-13 years of age before other groups, and the adductor magnus reached grade 4 by age 14-15 years (Figure 5). The biceps femoris, quadriceps muscles, semimembranosus, gastrocnemius, soleus, and peronei muscles showed involvement at the age of 6-7 years with the biceps femoris and quadriceps muscles showing the highest mean grade score among these. Fatty infiltration of grade 1 in adductor longus and sartorius was noted in the 7-8 years age group. Tibialis anterior, EHL and EDL, semitendinosus and tibialis posterior, FHL, and FDL were seen to be affected at 8-9 years of age. Gracilis was the last to show grade 1 fatty infiltration at 10-11 years of age (Figure 5).
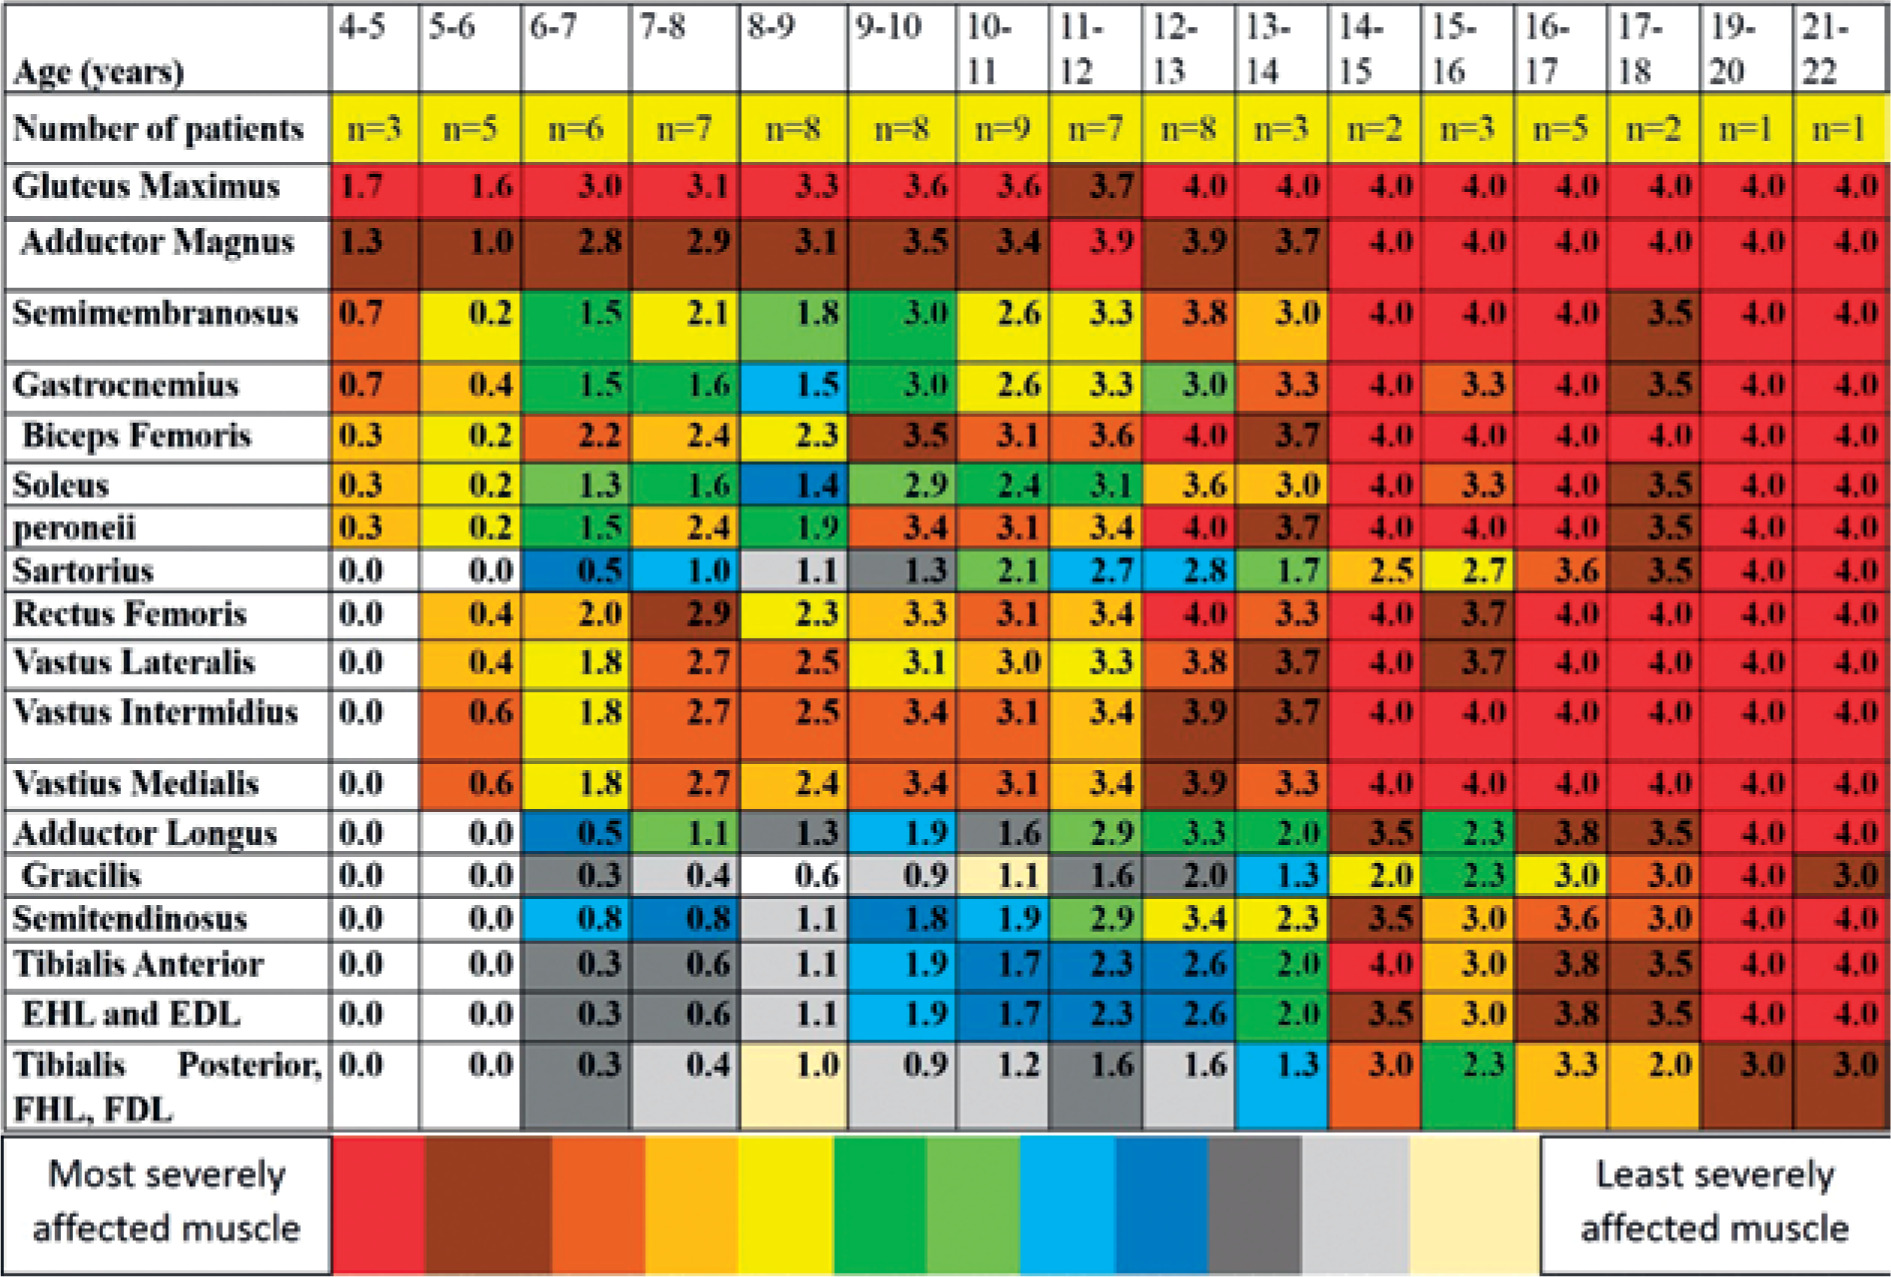
Involvement of gluteus maximus (≥ grade 1, i.e. minimal infiltration) was noted in all the patients (Table 3). Adductor magnus was the next most frequently affected muscle (96%) followed by vastus intermedius, vastus medialis, and semimembranosus (91%). Gracilis followed by tibialis anterior and then tibialis posterior, FHL, and FDL were the most spared muscles (Table 3, Figure 4).
Table 3
Assessed muscles on MRI T1-weighted images and percentages of patients who showed muscle involvement
Correlation of MRI grade with age
There was a statistically significant positive correlation of the mean MRI grade score of all the assessed muscles individually with age (Figure 6, Table 4). There was also a statistically significant high positive correlation between the overall mean MRI grade and age (Figure 7). Overall MRI grade and age showed high (statistically significant) correlation with age, meaning that the MRI grade increased as the age increased.
Figure 6
Correlation between mean MRI grades of individual muscles and age
X axis – age, Y axis – mean MRI grade
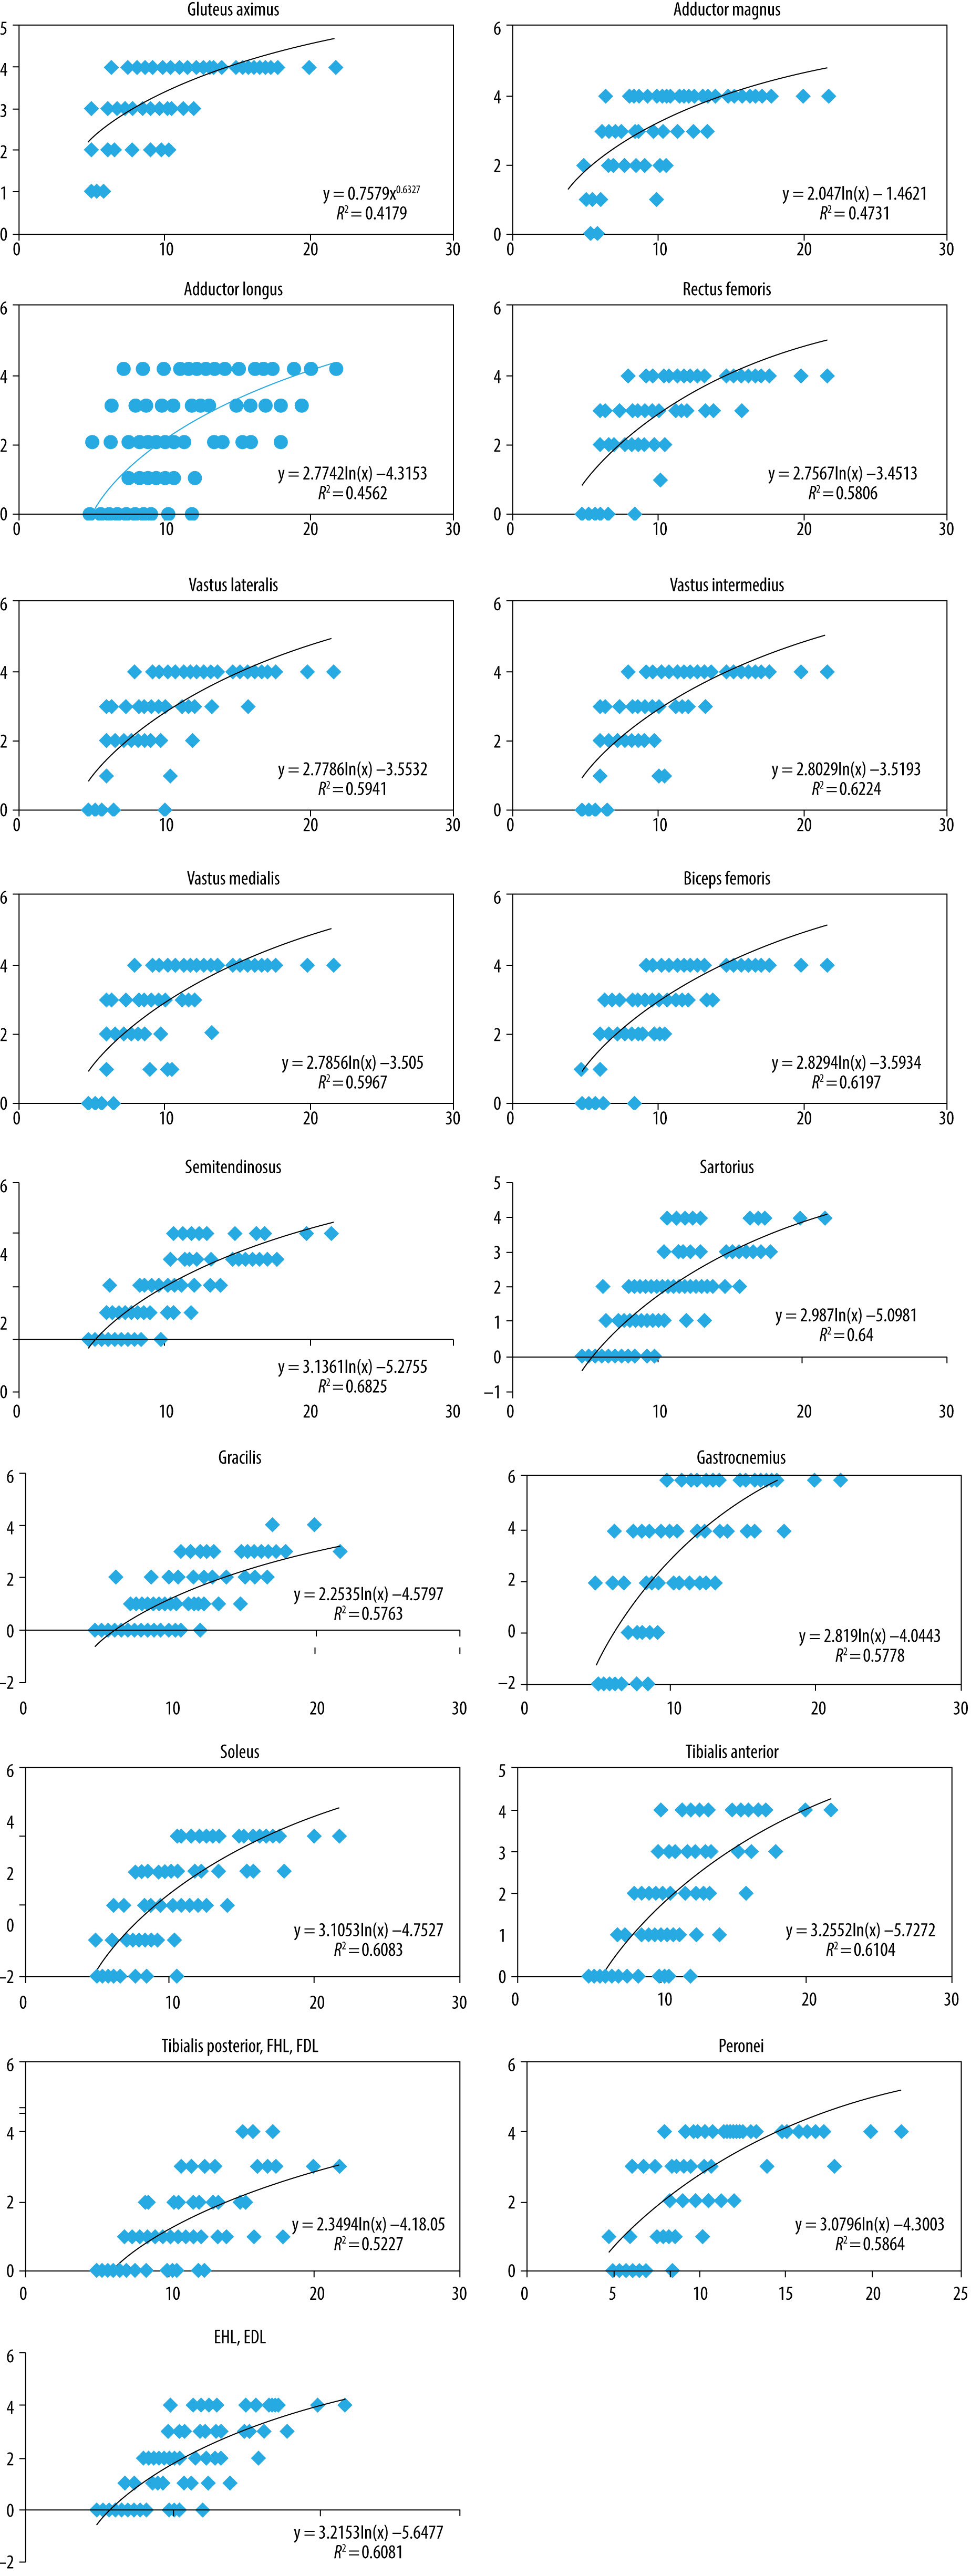
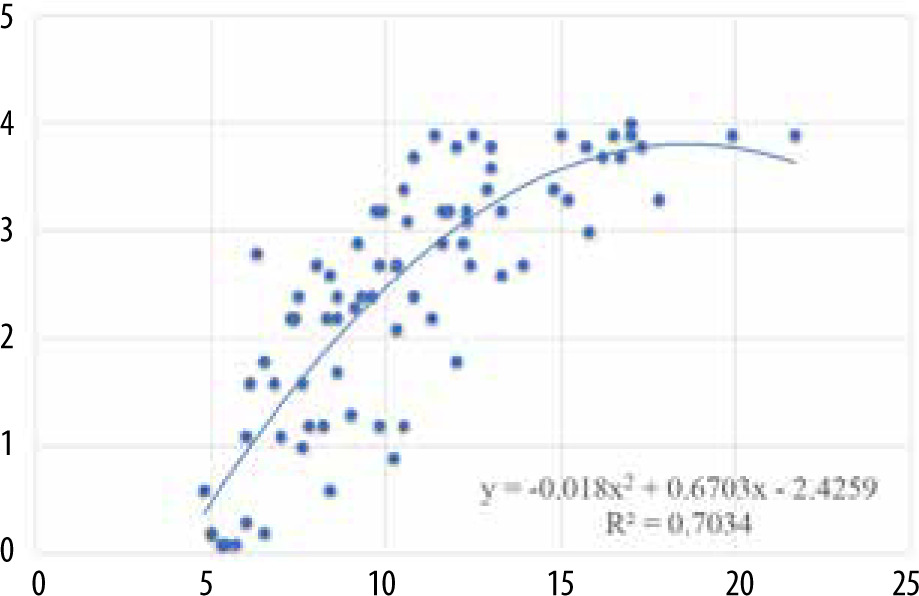
Table 4
Summary of the results of analysis of fatty infiltration score on T1-weighted MSK MRI
It is interesting to note that although gluteus maximus and adductor magnus show earliest and most severe impairment on MRI grade, the correlation of the MRI grade of these muscles with age is weaker than that of other muscles, suggesting that the decline in the strength of these muscles is less linear. Muscle involvement of grade 1 is noticed at the age of 4-5 years for both the muscles, which increases to an average grade of 3 at the age of 6-7 years for gluteus maximus and 8-9 for adductor magnus. This suggests that there is a faster increase in fatty increase in the early years, which plateaus in later years. The next most logical step is to observe the correlation of MRI grade (fatty infiltration) with the strength of different muscles.
Correlation between MRI grade score and MMT
There was a significant, high, negative correlation between the MRI grade score of hip extensors, hip adductors, knee flexors, knee extensors, peronei, tibialis anterior, and EHL and EDL (Figure 8) and the MMT score. The correlation was statistically significant. The correlation coefficients and p values are given in Table 5. The results indicate that as the strength of the muscles reduces, the MRI grade score increases. This corroborates with previous findings of correlation.
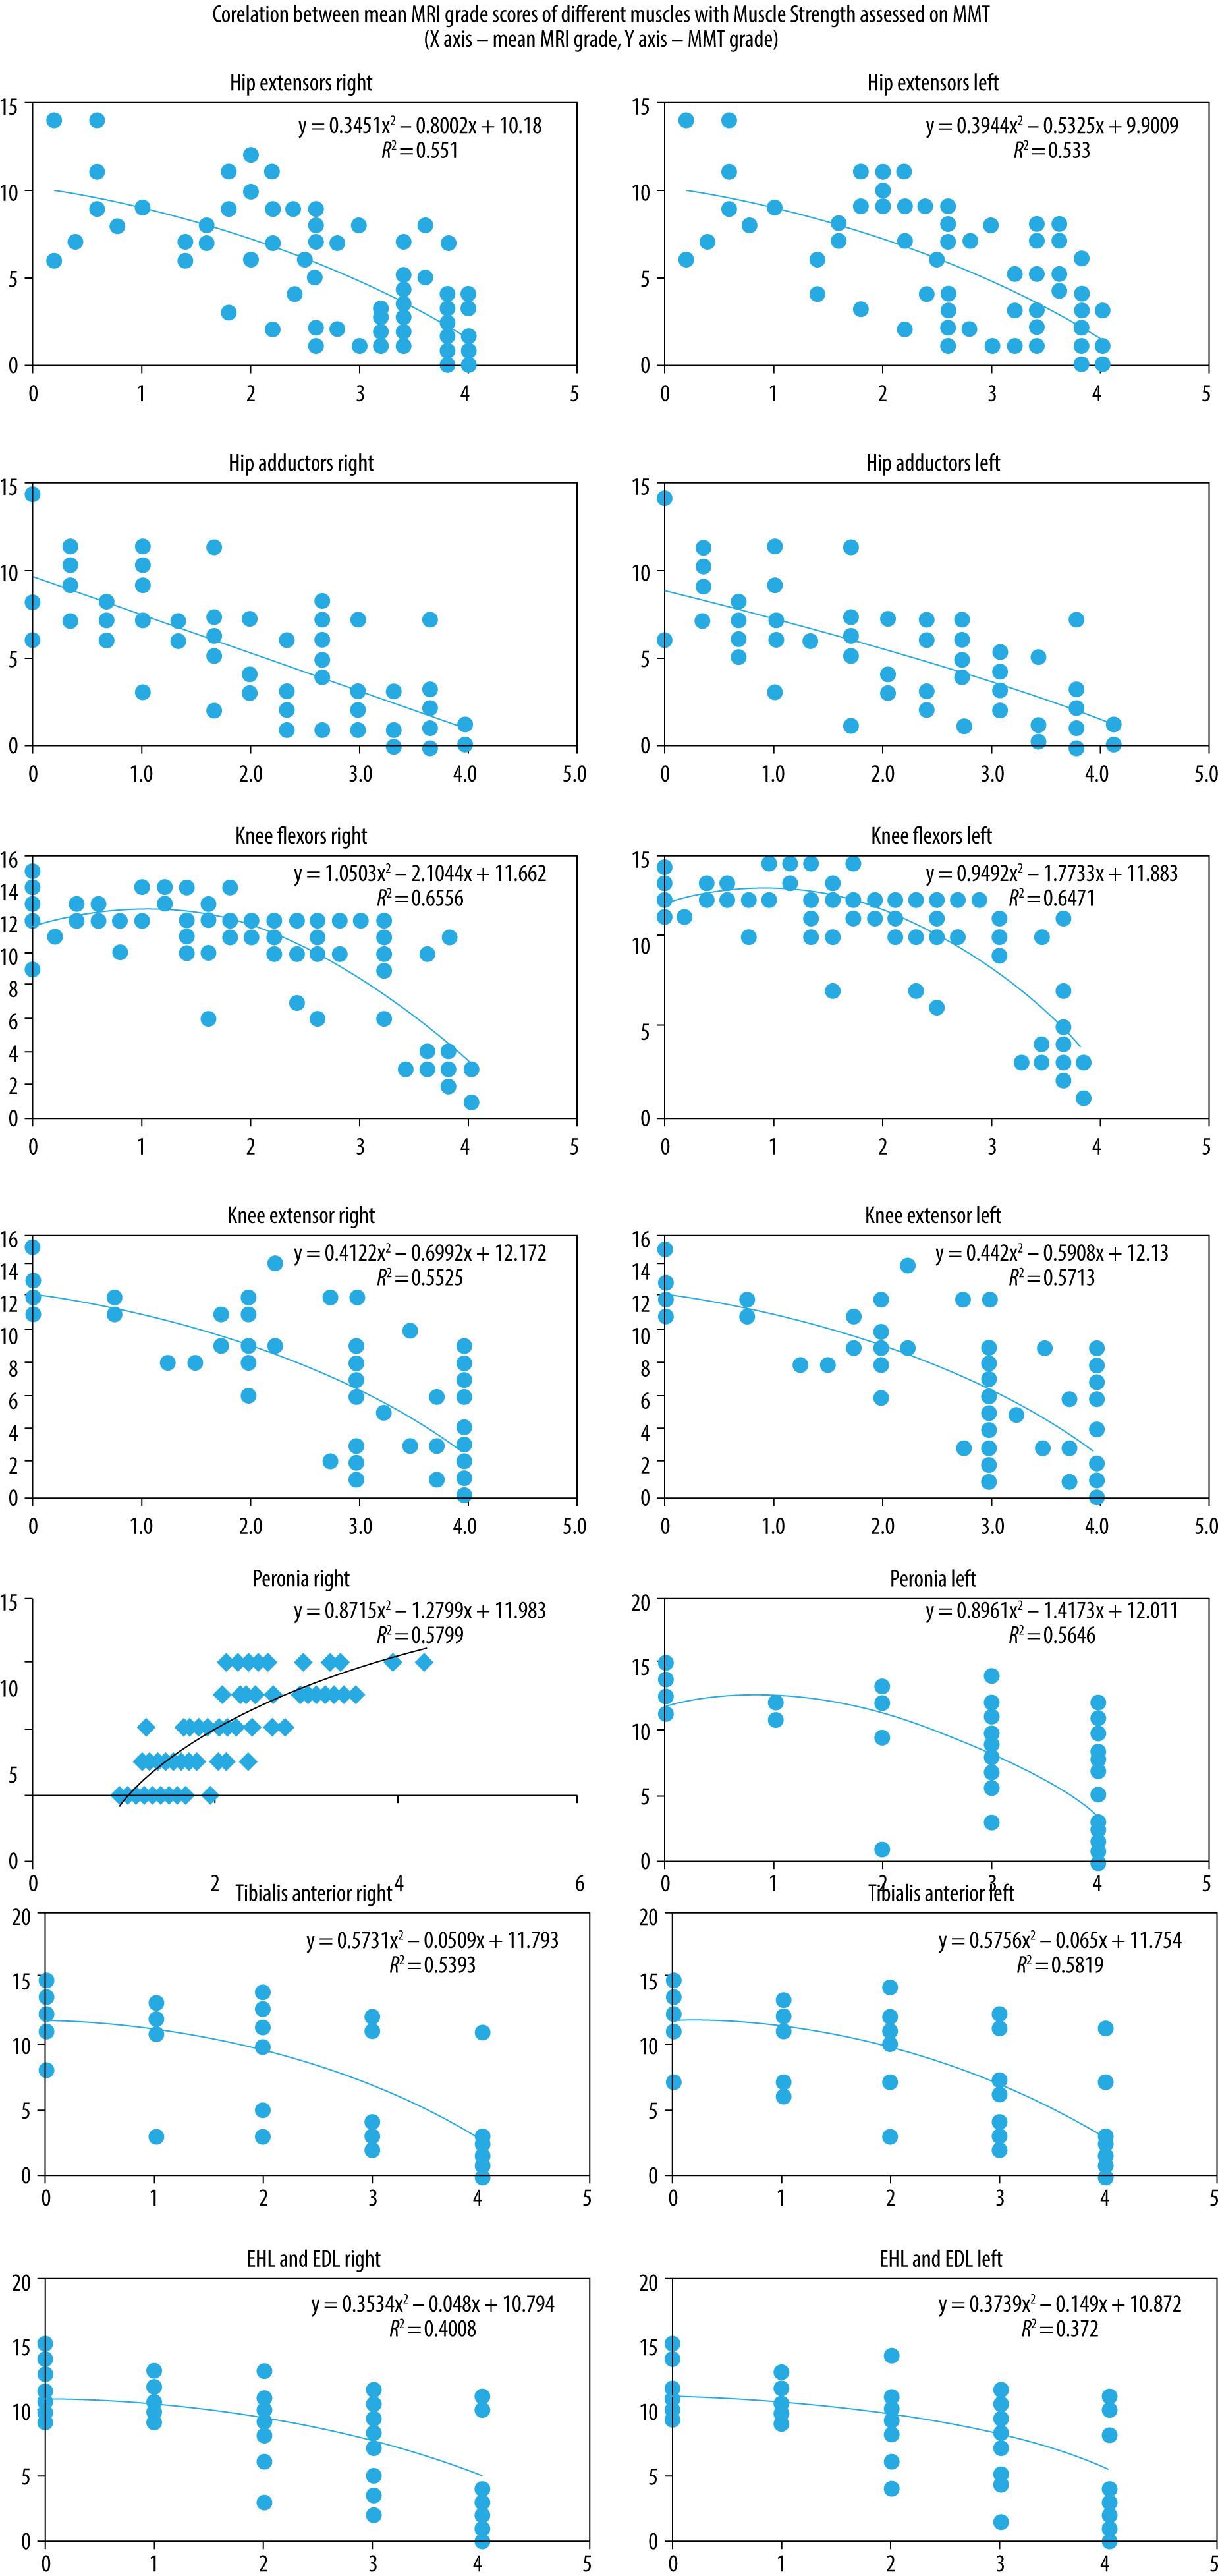
Table 5
Correlation between overall mean MRI grade score and muscle strength
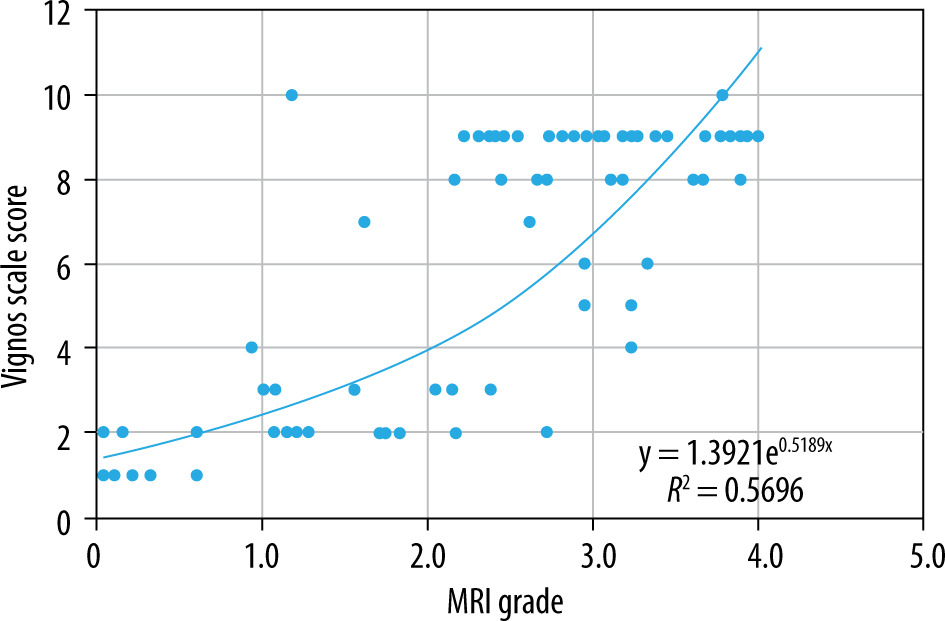
Correlation between MRI grade and Vignos scale score
When comparing non-quantitative MRI grade score to the Vignos scale score, there was a statistically significant high positive correlation (r = 0.746, p < 0.05) (Figure 9); meaning that as the Vignos scale score increases, so the MRI grade also increases. The increase in the Vignos scale demonstrates a functional decline in the patient.
To summarise, the MRI grade score showed statistically significant moderate to high positive correlation with age and moderate to high negative correlation with muscle strength and high negative correlation with function.
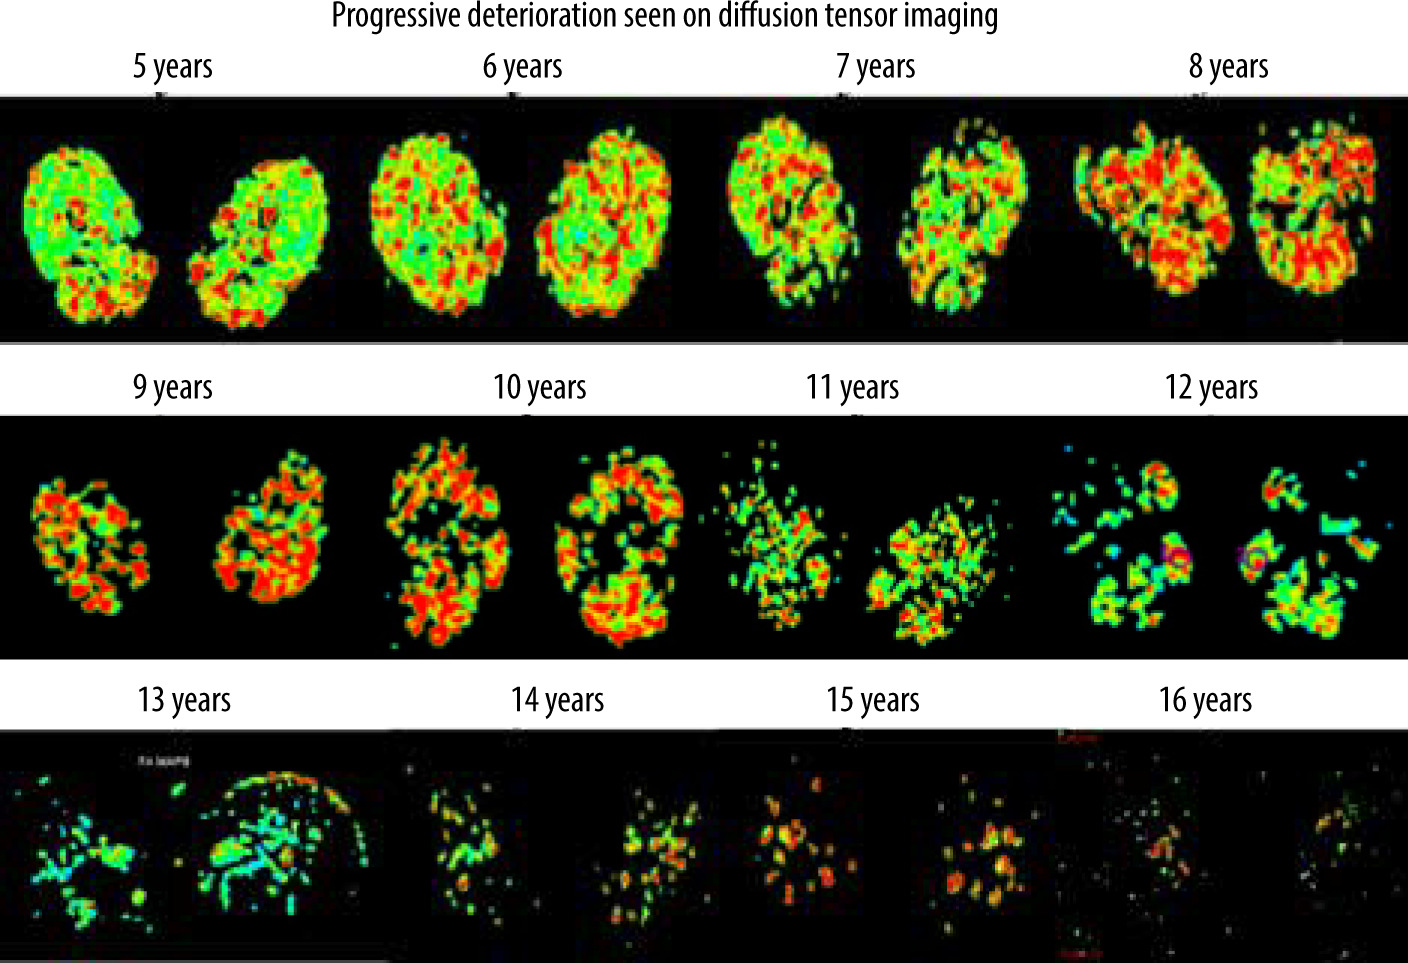
Pattern of muscle involvement on DTI measurement of FA
Figure 10 shows the pattern of muscle atrophy using a colour-coded DTI map of the FA values with progressive age; Figure 11 shows a comparison of representative images of colour-coded FA value maps at 5 and 16 years of age. A 2D DTI map is a colour-coded map of the FA values in each voxel. The colour of the voxels on a FA map corresponds to the direction of the main eigenvector: directionality along the x-axis of the patient’s body (in a craniocaudal direction) is given a Blue colour, the fibres along the y-axis (latero-lateral) are red, and the fibres long the z-axis (anteroposterior or posteroanterior) are given a green colour. The brightness of each pixel indicates the degree of anisotropy – the higher the FA, the brighter the pixel. To identify the boundaries of the muscles undergoing evaluation, the fusion of FA maps with morphologic images is required and can be achieved by using T1-W images.
Figure 10
Pattern of muscle atrophy using a colour-coded DTI map of the FA values with progressive age
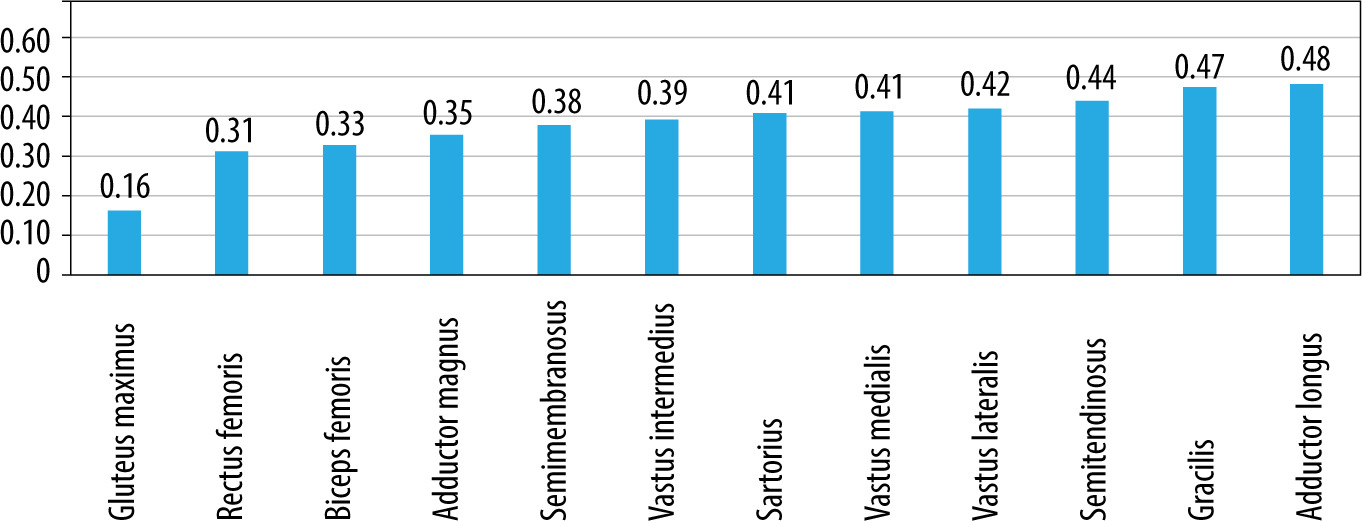
As seen in Figure 12, FA values were lowest in the gluteus maximus (0.161) followed by rectus femoris (0.310). FA values were the highest in the adductor longus (0.483) followed by gracilis (0.475) muscle. However, a definite pattern of muscle involvement by FA values across the age groups could not be recognised (Figure 5). There were no similarities in the pattern of fatty infiltration seen on MRI grade score and FA values except gluteus maximus having highest MRI grade score and lowest FA value.
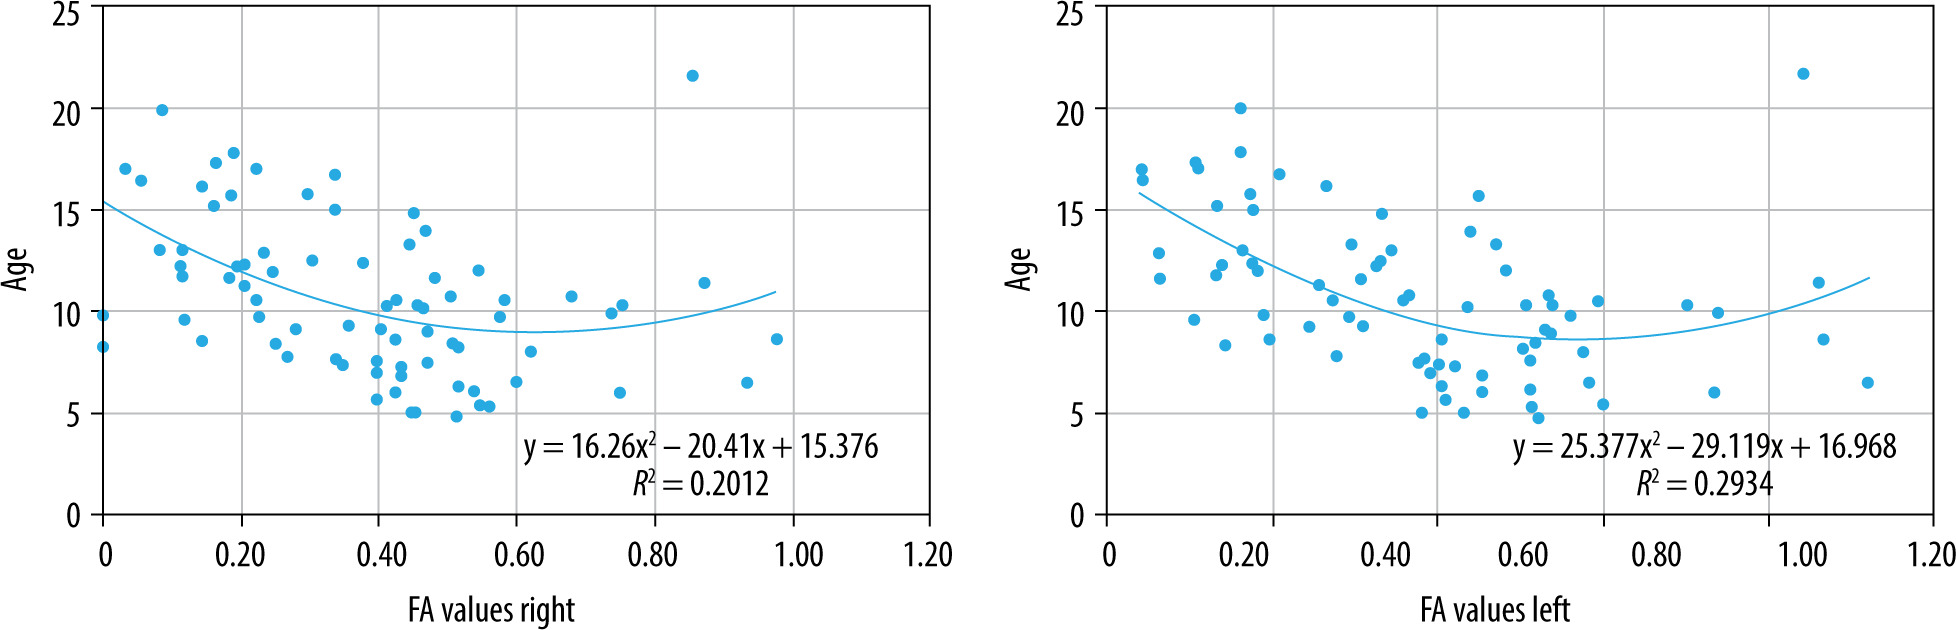
Correlation of FA values with age
There was a statistically significant, low, negative correlation between FA values of all the assessed muscles and age (right: r = –0.446, p < 0.05; left: r = –0.501, p < 0.05) (Figure 13), which means that with increasing age, the FA values may show a decline. The low strength of the correlation warrants more exploration to establish a pattern.
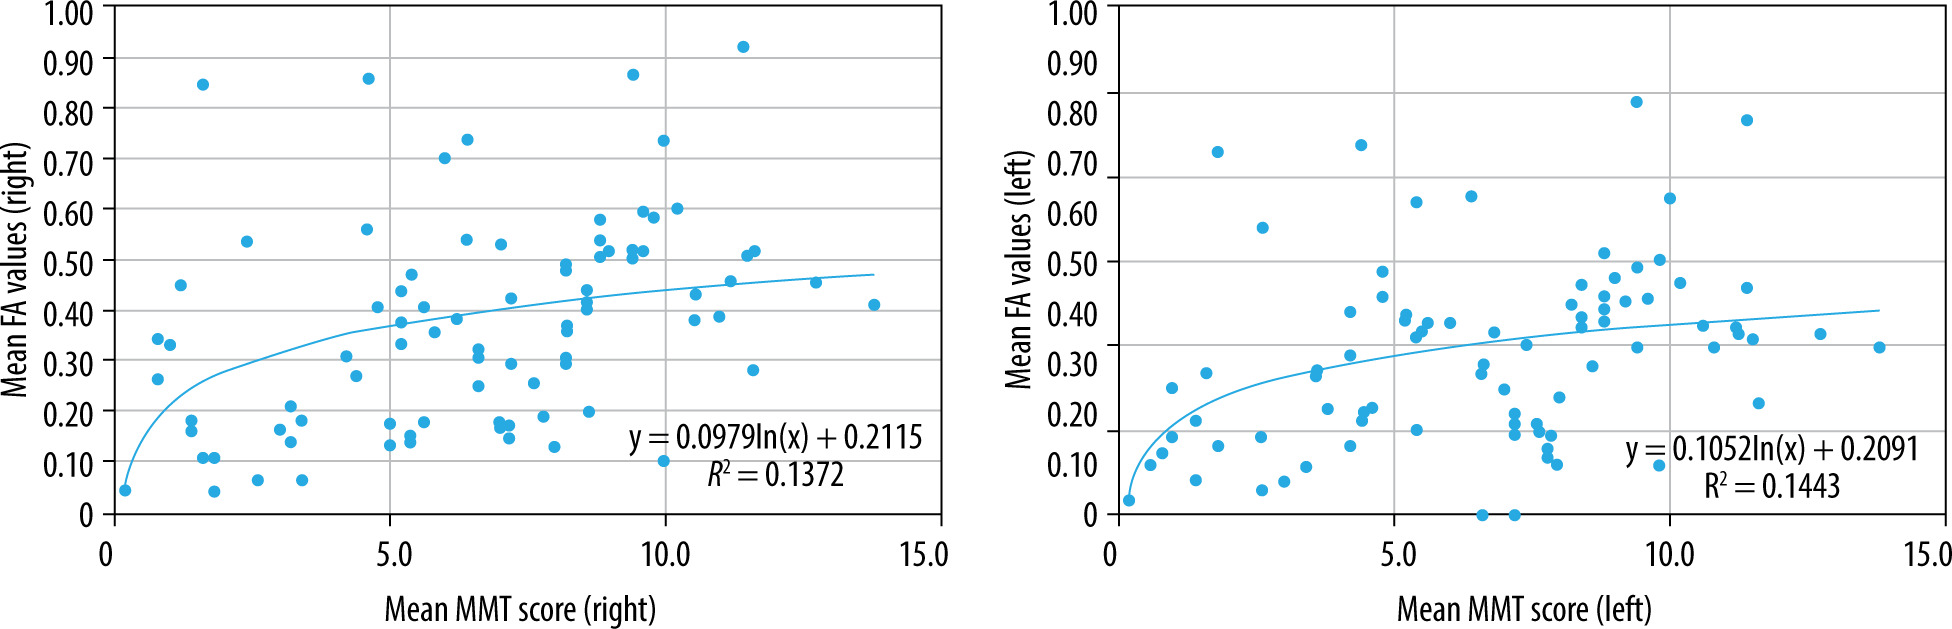
Correlation between FA values and MMT score
When comparing mean overall FA values to mean MMT score, there was a statistically significant, low, positive correlation (right: r = 0.445, p < 0.05; left: r = 0.406, p < 0.05) (Figure 14). This may suggest that as the muscle strength decreases, the FA value may decline, which also corroborates with the correlation seen with age; however, the low strength of the correlation coefficient suggests further investigation is required, possibly with a larger sample size.
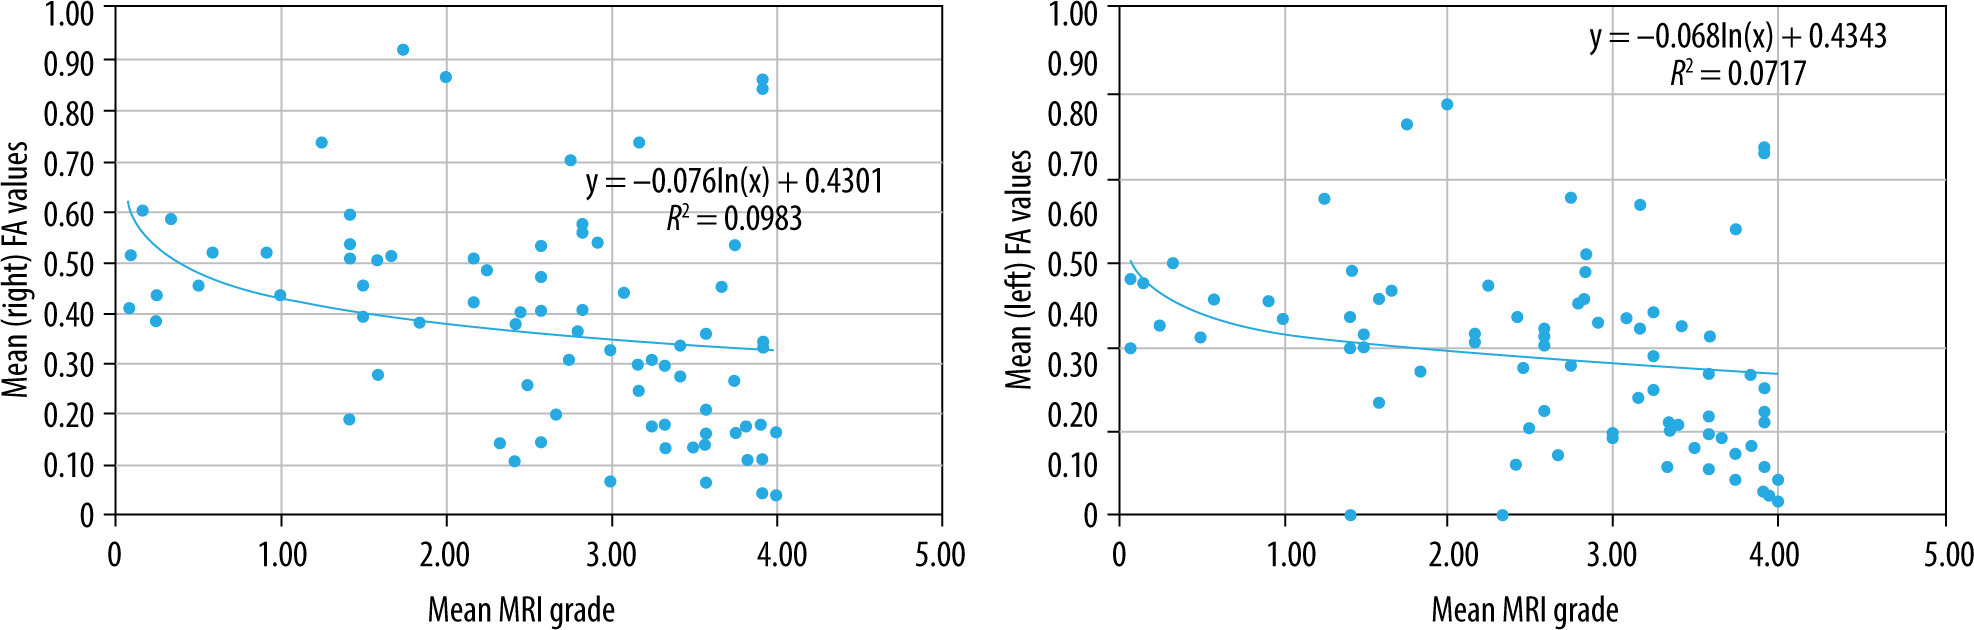
Correlation between MRI grade and FA values
There was a statistically significant, low, negative correlation between overall mean FA values and overall MRI grade score of the thigh muscles (right: r = –0.498, p < 0.05; left: r = –0.431, p < 0.05) (Figure 15), suggesting that FA values may decline with increasing MRI grade score, which is consistent with the correlation findings with age, strength, and function. However, the low strength of the correlation demands further investigation.
Discussion
This is one of the first studies in which the fusion of 2 technologies – DTI and conventional MRI technique – and their relationship has been studied in DMD patients to understand the correlation between disease progression, muscle pathophysiology, and age. MRI provides information about important histological features seen in muscles involved, including volume loss, irregular contour, fatty infiltration, oedema, and fibrosis [28]. DTI, on the other hand, measures the anisotropic diffusion characteristics of tissue [29]. This study evaluated thigh muscles in a large sample of both ambulatory and non-ambulatory DMD boys in age groups 4-22 years using T1-W imaging and diffusion tensor imaging in a cross-sectional design. The main findings of this study were as follows: 1) on T1-W MRI we observed a distinct pattern and distribution of muscle involvement across different ages; 2) we also observed a statistically significant, moderate to high, positive correlation between non-quantitative MRI grade of lower limb muscle and function; 3) a statistically significant low positive correlation was observed between FA and lower limb muscle strength; and 4) FA values showed a statistically significant, low, negative correlation with non-quantitative MRI grade score.
MRI T1-W pattern of muscle involvement
In the present study, the gluteus maximus muscle was the most severely affected muscle, and it was seen to be affected in all the patients, including the youngest patient, and it was the first muscle to be affected. This was followed by adductor magnus and then biceps femoris, quadriceps, semimembranosus, gastrocnemius, soleus and peronei muscles. Previous studies have reported similar findings but not as extensive and detailed over entire age range [12,13,30]. Gracilis was the last to be affected (age 10–11 years), with the lowest frequency of involvement, and it demonstrated the least overall mean grade score. In the mid-lower leg, the peronei, gastrocnemius, and soleus muscles were seen to be affected between 6 and 7 years of age, with peronei demonstrating the highest overall mean grade score. Tibialis posterior, FHL, and FDL demonstrated the least overall mean grade score and were the last (age 8–9 years) to be affected. Tibialis anterior and then tibialis posterior, FHL, and FDL were the least frequently involved. This distinct pattern and frequency of muscle involvement of mid-lower leg (Table 4, Figures 2 and 5] was in line with that shown by Torriani et al. and Godi et al. [31,32]. But these also had small sample sizes and did not describe an age-related muscle involvement pattern. The underlying basis for differential muscle involvement and pattern of involvement continues to be poorly understood. Hu et al. demonstrated that differing degrees of eccentric contractions may be responsible for differential muscle involvement during the early stages of DMD [33]. Also, Webster et al. showed type II fast-glycolytic fibres to degenerate first because of higher susceptibility to repeated degeneration and regeneration cycles [34]. Studies have demonstrated recruitment of mainly type II fibres during eccentric contractions [35,36]. As the disease progresses, the mechanical properties of muscles change due to gait adaptations, which may result in the progressive fatty infiltration involving other muscles [37-40]. Gait and posture analysis of children with Duchenne muscular dystrophy has shown gluteal insufficiency early on in the disease, causing postural deviations like lumbar hyperlordosis and pelvic tilt [38]. D’Angelo et al. (2009) observed compensatory gait deviations, such as knee hyperextension due to quadriceps weakness, in children of this age group. Further studies are needed to explore the differential muscle involvement and possible contribution of muscle fibre types and stresses arising from eccentric muscle contractions as a causative factor.
Fatty infiltration is one of the hallmark pathological features of patients with DMD. Among different sequencing of MRI, T1-W imaging shows an increased signal within muscle in patients with fatty infiltration [17]. They are performed and rated with the standard rating scale and provide a fast and reproducible measure of the degree of muscle involvement [17]. The characterisation of differential muscle involvement on MRI can serve as a non-invasive tool to help in diagnosis and to map disease progression. Kinali et al. demonstrated a correlation between the semi-quantitative MRI grade score and histopathological changes on muscle biopsy of the EDB [41]. This imaging technique also allows assessment and detection of individual muscle involvement in DMD, which may be difficult to recognise clinically, due to the presence of less affected/unaffected synergistic muscles [42]. Liu et al. showed that an increase in MRI grade score was seen earlier than a decline in clinical functional grade [10]. Thus, this information can be useful for treatment application and to assess treatment outcome. By providing an age-related progression of MRI grade score in DMD, our study provides a reference background of qualitative and semi-quantitative MRI for future clinical trials on new therapies for DMD, to guide treatment and to predict progression.
Pattern on muscle involvement on DTI measure of FA values
Fractional anisotropy values were lowest in the gluteus maximus (0.161) followed by rectus femoris (0.310). FA values were the highest in the adductor longus (0.483) followed by gracilis (0.475) muscle. In this study, FA values showed low, negative correlation with age and MRI grade score; both were statistically significant. FA is a measure of direction of water diffusion. It is the main parameter that measures the anisotropy in tissue. In an isotropic tissue the probability of diffusion of water molecules is the same in every direction. In an anisotropic tissue the probability of water molecule movement is much greater along the length of the fibres. Tissues such as peripheral nerves and muscle fibres have high anisotropy because they are very well organised. When the organised muscle units are disrupted by injury and are subsequently replaced by fibrous tissue laid down in a disorganised manner, it results in a reduction in FA values [40]. Our results were in line with this principle of DTI measure of FA values, as also demonstrated by Li et al. [24], who demonstrated that FA values were lower in DMD patients than in controls, and that the muscles with greater fatty infiltration on MRI had a greater decrease in FA values [24].
However, in our study adductor magnus, which had the second highest score of fatty infiltration on MRI grade score, had a mean FA value that was higher than the rectus femoris and biceps femoris, although these muscles scored lower on MRI grade score. These discrepancies in the findings suggest that FA alone may not be a useful marker in predicting disease progression. Also, our results were in contrast to the study by Ponrartana et al. [44]. This could be due to the varying field strength of the magnet, acquisition parameters, and regions of interest. Moreover, FA values are subject to variations due to other factors such as variable muscle architecture [45,46], fatty infiltration [44], and the region imaged [45]. These factors also make FA a poor marker for disease progression. However, FA measure of DTI has a very high sensitivity in differentiating healthy from injured muscles [43]. It might therefore be useful for early detection of muscle involvement before the anatomic changes [47] and to assess objective changes in treatment response on follow-up assessments.
Imaging and clinical assessments
Statistically significant, moderate to high correlation was seen between non-quantitative MRI grading and the clinical assessments (mMRC MMT and Vignos scale). With an increase in MRI grade, there was a decline in muscle strength on MMT and functional status on Vignos scales. There was a low, positive correlation between FA values and MMT score. A decrease in FA values was seen with a decline in MMT score.
This suggests that imaging could provide objective evidence and could be used as a definite biomarker for disease severity. Also, the gluteus maximus was seen to be the first muscle to be affected, even as early as at 4.8 years of age. In addition to the MRI imaging, FA constantly showed lower FA in gluteus maximus as compared to other muscles and showed consistent involvement in all the patients. These observations from the present studies suggest that gluteus maximus muscle could be used to assess disease severity.
Musculoskeletal magnetic resonance imaging is a useful diagnostic modality for assessing the pattern, extent, distribution of muscle involvement, and disease progression. It can serve as a noninvasive technique to detect changes in individual muscles that cannot be detected by strength assessments. We have presented the pattern and degree of fatty infiltration of individual muscles and muscle groups. Also, we have presented the natural history of the disease on lower limb T1-W MRI. DTI measure of FA values may not accurately predict disease history but may serve as a quantitative marker for treatment outcome.
Limitations
The earliest pathologic changes include oedema/inflammation, which is followed by intramuscular fatty infiltration. In this study, imaging was restricted to T1-W MRI, which may miss the oedema and inflammation [12]. T1-W images of upper limbs could not be included due to insufficient data. Lack of control for comparison of FA values was another limitation.
Conclusions
MRI grade score of fatty infiltration showed good correlation with clinical and functional scales. Gluteus maximus was the most frequently involved muscle with the earliest and the highest degree of involvement on T1-W images, followed by adductor magnus muscle. Gracilis was the last to be affected with the least frequency and degree of involvement. We have described the characteristic pattern of muscle involvement in DMD across ages 4 years to 22 years. FA values correlated positively with MMT and negatively with MRI grade score. Due to the variability and inconsistency of FA values with disease progression and increasing age, it may not be a good marker for disease progression and disease evolution. MRI together with DTI measure of FA is a promising non-invasive biomarker to assess disease progression and treatment outcome. However, large comprehensive studies including upper limb MSK MRI with DTI in DMD are needed.