


Introduction
Diabetic foot ulcers (DFU) constitute one of the major complications in individuals with diabetes, with a lifetime risk of around 25% [1]. DFU may be limited to soft tissue or involve the foot bones causing foot osteomyelitis (DFO), which may culminate in lower extremity amputations in a startling two-thirds of the patients [2]. Therefore, timely diagnosis of foot osteomyelitis is vital to initiate appropriate medical or surgical treatment to prioritize limb salvage.
Various imaging modalities have been evaluated for the diagnosis of DFO including plain X-rays, magnetic resonance imaging (MRI), nuclear scintigraphy, fluorodeoxyglucose positron emission tomography (FDG PET/CT), and labelled white blood cell PET/CT. X-ray is less sensitive for detecting DFO in the first 2-3 weeks [3,4]. Currently, MRI is widely used as the diagnostic moda-lity of choice for an early diagnosis of pedal osteomyelitis because it gives extensive details of the nature and extent of both bony as well as soft tissue involvement. MRI has good sensitivity for detecting osteomyelitis (90%), but the specificity may range from 70% to 80% or even less [4-7]. The fundamental issue with the conventional T1WI and T2WI sequences is that other causes of marrow oedema such as acute neuropathic arthropathy and post-procedural changes may give similar MRI signal intensity changes, reducing the specificity of the investigation. Similarly, nuclear scintigraphy with 99mTc has a good sensitivity (75%), but it has lower specificity (40%) for diagnosing DFO [8]. The use of labelled leucocyte bone scintigraphy can overcome this limitation because the leukocytes aggregate at the site of osteomyelitis. However, the poor spatial resolution of bone scintigraphy limits the use of this modality. However, an earlier investigation has demonstrated the use of FDG labelled leukocyte PET/CT scan, which has high resolution and specificity (100%) for diagnosing DFO [9].
Research in the field of MRI physics is growing by leaps and bounds, which has led to the introduction of newer sequences that make use of functional imaging to improve the specificity of this modality. Dynamic contrastenhanced imaging (DCE-MRI) is one such modality that assesses the contrast uptake in any lesion over time. The semiquantitative DCE-MRI parameters used in this study have not been evaluated previously for diagnosing DFO. The DCE-MRI parameters used in this study are simple, easy to calculate, and less time-consuming than the quantitative parameters. The role of diffusion-weighted imaging (DWI) has been extensively investigated in various pathologies, a few of them including differentiation of various benign and malignant soft tissue and bone tumours, septic arthritis, transient synovitis of the hip joint, and assessment of treatment response in an inflammatory disorder like rheumatoid arthritis [10-12]. The results in the current study further validate the available literature on the role of DWI in diagnosing DFO and differentiating it from Charcot arthropathy [10,11]. Therefore, this study focuses on the pattern of contrast uptake in patients with diabetic foot ulcers and suspected DFO using semi-quantitative parameters of DCE-MRI sequence, and also the differences in ADC values between the 2 groups. The use of DCE-MRI and DWI sequences in combination with conventional sequences may assist in an early and accurate diagnosis of osteomyelitis in individuals with diabetic foot ulcers.
Material and methods
This was a prospective study, conducted after approval from the institutional ethics committee. Written informed consent was acquired from all the volunteers. This included participants with diabetes, who presented with foot ulcers in a diabetic foot clinic and were clinically suspected of pedal osteomyelitis. The patients were clinically examined by an experienced foot care specialist who performed a physical examination including a probe to bone (PTB) test. Clinical suspicion of osteomyelitis was based on the presence of ulcers with exposed bone graded as University of Texas grade 3 or grade 2 with the presence of sinus tracts, positive probe to bone test or ulcer > 4 weeks in duration with ulcer area larger than 2 cm2. History of diabetes, microvascular and macrovascular complications, duration and cause of ulcer were investigated. A thorough foot examination for the site, size, depth of the ulcer, and adjacent skin condition were noted. The presence of neuropathy was assessed with vibration perception threshold (> 25 mV was considered as loss of protective sensations) and vasculopathy by ankle-brachial index (ABI), with < 0.9 considered as peripheral vascular disease.
Patients having a generalized contraindication to MRI or contrast administration, on antibiotic therapy for the past 72 hours, or not giving consent for the study were excluded from the study. The MRI imaging was done using a 3-Tesla unit (TIM MAGNETOM Verio, Siemens, Germany) using the extremity coils. The imaging sequences included T1W spin echo (SE) sagittal, coronal, and axial (fat-suppressed), T2 fat-suppressed (coronal, axial, and sagittal), dynamic contrast-enhanced T1-weighted images using a fast multiplanar spoiled gradient echo technique (VIBE), and T1W SE post-contrast fat-suppressed axial and sagittal sections. DCE-MRI was done in which 12 serial axial image sets were obtained at a temporal resolution of 15-16 s over 4-5 minutes post-injection of contrast. A dose of 0.2 mmol/kg of gadolinium chelate (Magnevist) (gadopentate dimeglumine) was administered at a rate of 3.5 ml/s followed by a chaser injection of 20-30 ml of normal saline given at the same rate as the contrast. For DCE-MRI, a VIBE sequence was used having TR and TE of 4.1 and 1.4 ms, respectively. The slice thickness was 3 mm with a field-of-view (FOV) of 17 cm and a voxel size of 0.7 × 0.7 × 0.6 mm. DWI was done using a single-shot echo-planar sequence at b values 0, 600, and 800 mm2/s. TR and TE used were 4100 and 90 ms, respectively, with a slice thickness of 5 mm, having FOV of 25 cm and a voxel size of 1.7 × 1.3 × 5 mm. The diffusion gradients were applied in 3 orthogonal directions (x, y, and z). Apparent diffusion coefficient (ADC) maps were reconstructed at a commercial workstation with standard software.
Image analysis
The analysis was performed by a single radiologist with more than 10 years’ expertise in musculoskeletal imaging, on a dedicated Siemens workstation. The imaging definition for DFO on conventional MR sequences was the presence of focally decreased marrow signal intensity on T1-weighted images, focally increased signal intensity on T2-weighted images, and focal marrow enhancement on gadolinium-enhanced fat-suppressed T1-weighted images. Osteomyelitis was also considered in cases of discordant marrow signal intensity (i.e. absence of focal decrease of marrow signal intensity on T1-weighted images and presence of hyperintensity on T2-weighted images with post-contrast enhancement). The region of interest (ROI, measuring 0.15-0.40 mm2) was drawn using an electronic cursor over the bone showing altered signal intensity with the suspicion of osteomyelitis. Care was taken to avoid the adjacent area around the lesions to exclude the effect of partial volume averaging.
DWI sequences were used to calculate the ADC values from ADC T1 fusion maps for the corresponding ROIs. The ADC values were expressed in 10–3 mm2/s.
The following values were calculated for the above ROI from the DCE-MRI sequence:
SI0 = tissue signal intensity on unenhanced T1 images;
SImax = maximum absolute contrast enhancement;
maximum relative SI [SIrel] = (SImax – SI0)/SI0 × 100;
wash in rate [WIR] = (SImax – SI0)/time to peak in seconds;
time to peak (T) = time taken to reach the maximum signal intensity in seconds.
The mean time-intensity curve (TIC) of the lesion was also analysed to characterize the lesion. Three patterns of the TIC were considered, type 1 – progressive increase in signal intensity over the entire dynamic study (the persistent pattern), type 2 – rapid initial peak followed by a relative constant enhancement (the plateau pattern), and type 3 – sharp uptake of contrast followed by a decrease in enhancement over time (the washout pattern).
All participants underwent bone-biopsy from the suspicious site of bone involvement (as detailed earlier) and were sent for microbiological and histopathological analysis after MRI. The results of the bone-biopsy were considered the gold standard for the diagnosis of DFO. Specimens with bone-biopsy positive for DFO were considered true positives and the absence of DFO on bone biopsy as true negatives.
Statistical analysis
All the bone-biopsy samples were divided into 2 groups based on biopsy results as “osteomyelitis positive” if the bone biopsy was suggestive of DFO (both on histopatho-logy and microbiology) and negative otherwise. The data were tested by the Kolmogorov Smirnov test for normality. For the categorical data like type of curve, numbers and percentages were calculated. The numerical data like SImax, SI0, and WIR are presented as mean with standard deviation (normal distribution), or median and interquartile range (skewed distribution). Subsequently, the maximum cut-off value of each parameter was calculated using the ROC curve and plotting the area under the curve (AUC). The sensitivity and specificity of each of the above parameters were calculated for the diagnosis of DFO keeping bone biopsy as the gold standard. All the tests were 2-sided and were performed at a significance level of α = 0.05. The analysis was conducted using IBM SPSS STATISTICS (Version 22.0).
Results
Patient characteristics
A total of 25 participants were included in the study, of these 8 (32%) were female and 17 were male. Nine patients were excluded, out of which, 5 were on antibiotics, 3 had underlying renal failure, and 1 withdrew consent. The mean age of the participants was 52.5 ± 7.4 years, and the duration of diabetes was 9.9 ± 7.2 years. There were 24 participants with type 2 diabetes and 1 participant had type 1 diabetes. The baseline parameters of the study popu-lation are shown in Table 1. The forefoot was the most common suspected site of DFO (17 participants), midfoot tarsal bones in 4, and calcaneal involvement in the other 4 participants. Bone biopsy from 19 participants was suggestive of DFO on microbiological and histopathological examination (true-positive), whereas biopsy was not suggestive of DFO in 6 participants (true-negative). Amongst the biopsy-positive cases, the first metatarsal was the most commonly involved bone (8 participants). The head of the first metatarsal was involved in 7 out of 8 participants and the body of the first metatarsal bone in 1 participant with prior amputation of the great toe. The bones involved in the remaining participants were proximal phalanx of the great toe (3), fifth metatarsal head (2), navicular (1), cuneiform (2), and calcaneum in 3 participants.
Table 1
Baseline characteristics in participants with suspected foot bone osteomyelitis
The conventional MR sequences, i.e. T1WI and T2WI sequences, were suggestive of DFO in all the 19 biopsy-proven cases of DFO. However, these sequences additionally suggested a diagnosis of osteomyelitis in 3 of the 6 biopsy-negative cases (false-positive).
Diffusion-weighted images
The mean ADC value in positive cases of DFO was 1.35 ± 0.24 × 10⁻³ mm2/s and 1.64 ± 0.14 × 10⁻³ mm2/s in bone-biopsy negative cases (p = 0.023). In 2 out of the 19 cases, the ADC value could not be calculated because of the excessive artifact as the bones involved were smaller in size and were located in the forefoot region. Drawing the ROC curve with the selection of ADC value cut-off of 1.57 × 10⁻³ mm2/s revealed a sensitivity of 88.2 ± 10.3% and specificity of 80.0 ± 19.4% with an AUC of 0.882 ± 0.078 for the diagnosis of DFO.
Dynamic contrast-enhancement images
The mean SI0 value in DFO-positive cases was 199.45 ± 33, which was significantly higher compared to SI0 of 132.68 ± 44 (p = 0.040) in biopsy-negative cases. A SI0 value cut-off of 143.3 had a sensitivity of 94.7 ± 5.1% and specificity of 83.2 ± 16.1% with AUC of 0.833 ± 0.121 for the diagnosis of DFO.
SImax was 470.5 ± 34 and 376.01 ± 86 (p = 0.023) in osteomyelitis-positive and -negative groups, respectively. The SImax cut-off value of 408.35 had 89.5 ± 9.5% sensitivity and 67.7 ± 28.8% specificity to diagnose osteomyelitis with AUC of 0.772 ± 0.124.
The mean value of SIrel was 155.12 and 193.88 in osteomyelitis-positive and -negative cases, respectively, and was not significantly different (p = 0.211).
The mean value of WIR in osteomyelitis-positive cases was 2.08 ± 0.4 and was significantly higher than in osteomyelitis-negative cases with a mean value of 0.932 ± 0.2 (p = 0.004). A cut-off WIR value of 1.210 had a sensitivity of 82.0 ± 13.9% and specificity of 83.3 ± 16.1% with AUC of 0.897 ± 0.075 for diagnosing DFO. WIR could not be calculated in 2 patients due to motion artifacts of the foot.
Type of curve: All the DFO negative cases showed a type I curve. Amongst the biopsy-positive cases of DFO, 16 participants (94.1%) revealed the type II curve, and 1 case (5.9%) showed the type I curve. The curve could not be drawn in 2 cases due to motion artifacts. The type II curve was strongly associated with osteomyelitis in diabetic-foot patients. The time to peak in all the negative cases was 260 s compared to 142.35 s in DFO-positive cases (p < 0.01).
Table 2 summarizes the key findings for the DWI and DCE-MRI parameters for differentiating biopsy-proven DFO cases from acute Charcot patients.
Table 2
Mean and cut-off values along with sensitivity and specificity of various diffusion-weighted imaging and dynamic contrast-enhanced magnetic resonance imaging parameters for differentiating diabetic foot osteomyelitis (DFO) from acute Charcot
Additionally, a statistical comparison of the AUC values of all the parameters was done. The area under the curve of WIR was significantly different from that of all the other parameters with a p-value < 0.05. No difference was, however, observed between the AUC values of the rest of the parameters.
Discussion
The present study aimed at deducing objective parameters of DWI and DCE-MRI sequences on MRI for an early and accurate diagnosis of diabetic foot osteomyelitis. We observed that ADC values on DWI and SI0, SImax, SIrel, WIR parameters, and type of curve on DCE-MRI images improve the specificity of conventional MRI sequences for the diagnosis of osteomyelitis in patients with a diabetic foot ulcer.
The first metatarsal head was the most frequently affected bone followed by the calcaneum and fifth metatarsal head, as they are the predominant pressure areas susceptible to recurrent trauma, making them susceptible to osteomyelitis. Previously, the 5th metatarsal and 1st metatarsal were implicated as the most frequent bones involved, because of the presence of concomitant varus deformity that altered the biomechanical forces, leading to skin ulceration [5].
An early diagnosis of osteomyelitis in diabetic foot is essential for the initiation of bone-culture-specific antibiotics to prevent amputation. Therefore, various radiological modalities including MRI are used for the assessment of bone involvement in diabetic foot ulcers. The suspected sites of bone involvement on conventional MRI sequences in the present study showed reduced T1 signal with a corresponding high signal on T2WI with significant post-contrast enhancement. Also, secondary signs of DFO, for example the presence of an adjoining ulcer, sinus tract, cellulitis, collection, gangrene, etc., were present in most of the cases in the present study, which aided in the diagnosis of DFO, as also observed by previous studies [12-20]. Collins et al. have also shown a high signal on T2 sequence in the affected bone, which approached the signal intensity of joint fluid corresponding to true positivity of 91.5% for DFO, but also significant false positivity of 61.9% [13]. We observed a significant (50%) false positivity with the conventional T1W and T2W sequences that may lead to undue treatment with antibiotics. The false positivity of conventional MRI sequences may be due to its dependence on bone marrow signal changes, which may be due to reactive marrow oedema, neuropathic arthropathy, stress reaction, or even altered weight-bearing. Therefore, it is pertinent to differentiate reactive marrow oedema from osteomyelitis to determine relevant treatment. Besides, these conditions may coexist with osteomyelitis, which in turn further complicates the ability to make an accurate diagnosis.
The sensitivity of MRI for DFO can be improved with the addition of DCE-MRI along with conventional MRI sequences. We studied the wash-in rate that provides information about the rate of contrast uptake in a lesion and observed a significantly higher WIR amongst the biopsy-positive DFO cases compared to biopsy-negative cases. WIR was significantly higher in osteomyelitis owing to the hyperaemia and vascularity that is characteristic of infection. Vasodilation because of various inflammatory cytokines increases transudation across the capillaries and may have contributed to the rapid contrast uptake and higher WIR observed in patients with osteomyelitis in our study. In negative cases, the extent of inflammatory mediators released is less, thus resulting in relatively reduced vasodilation and a decrease in wash-in rate. Thus, as compared to osteomyelitis, in the case of acute Charcot, the inflammation and hyperaemia are relatively low, producing a different contrast uptake pattern. However, Charcot neuroarthropathy sometimes mimics the increased contrast uptake and WIR. Nonetheless, WIR combined with the conventional non-contrast MRI sequences can improve the diagnostic accuracy of MRI for osteomyelitis. The AUC of WIR was significantly different from the rest of the parameters and may be considered the most important DCE-MRI parameter in differentiating DFO from acute Charcot.
The values of other DCE-MRI parameters like SI0 and SImax were observed to be significantly higher in the biopsy-positive cases as compared to the negative cases (Figure 1). A higher SI0 and SImax observed from the involved bone was likely due to greater inflammatory cells and hyperaemia secondary to infection. Conversely, SIrel was not found to be different amongst biopsy-positive or -negative cases in the present study. SIrel indirectly gives information about the microvessel density (MVD) and perfusion normalized to cardiac output. It may be presumed that there is no significant difference in the MVD between the 2 groups, and increased inflammatory mediators in DFO predominantly cause more severe vasodilation and increased permeability without having a significant effect on MVD.
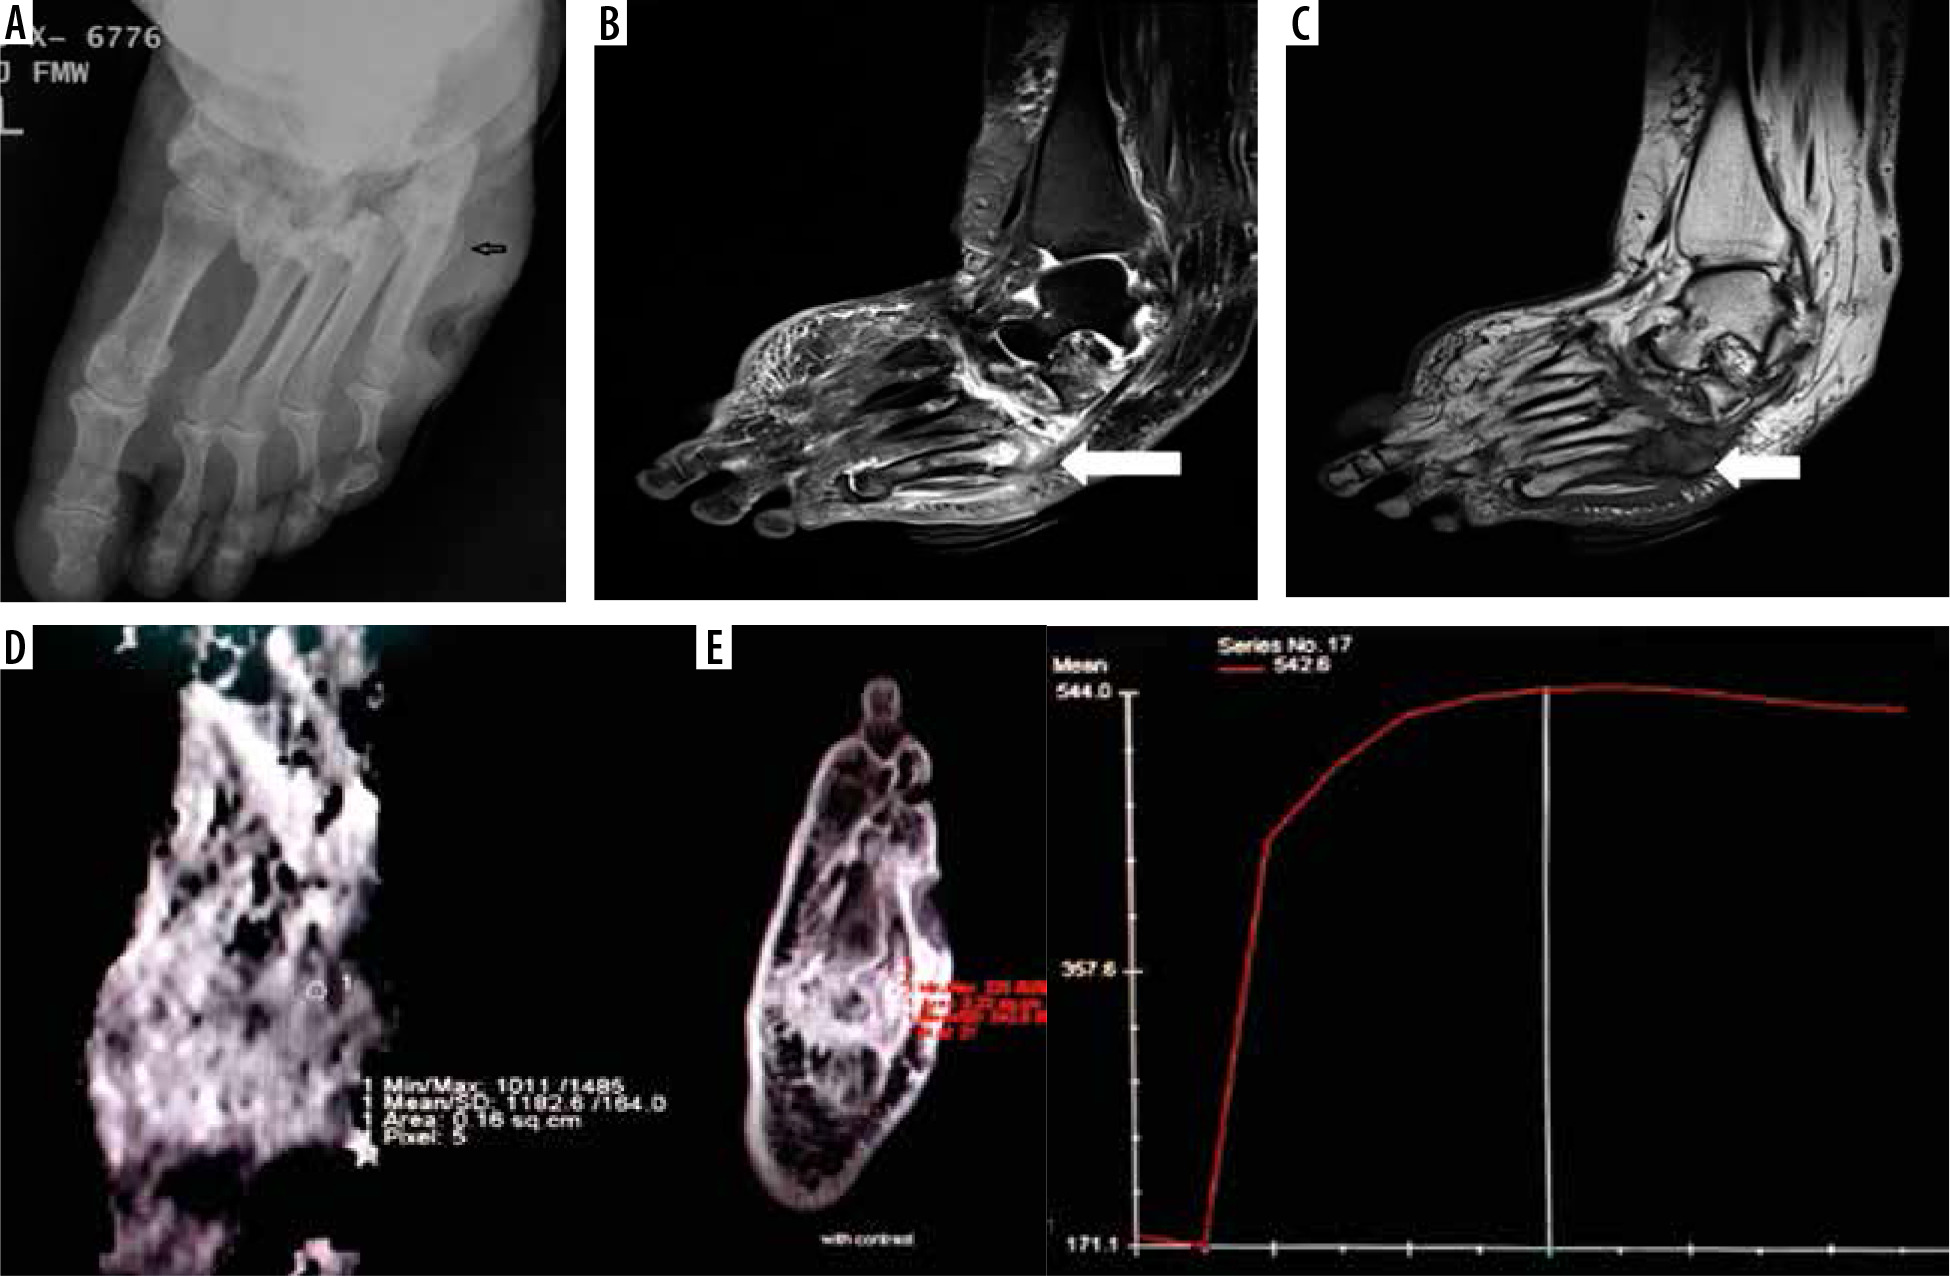
Figure 1
A 55-year-old diabetic female with non-healing ulcerations on the lateral aspect of the foot. Biopsy from the base of the 5th metatarsal revealed osteomyelitis. A) X-ray shows mild cortical irregularity with a solid periosteal reaction involving the base of the 5th metatarsal bone. B) Sagittal T2WI showing hyperintense signal involving the base of the 5th metatarsal (thick white arrow) with inflammatory changes in underlying soft tissue. C) Sagittal T1WI showing hypointense signal in the corresponding location. D) ADC map showing ADC value of 1.18 × 10⁻³ mm2/s (ROI drawn over the base of 5th metatarsal). E) Dynamic post-contrast enhancement showing type II curve, SI0 – 171.1, SImax – 544
The time-intensity curves were also plotted over time after contrast administration. All the DFO-negative cases demonstrated a type I curve (Figure 2), which indicated gradual progressive enhancement; whereas, 94.1% of the positive cases showed a type II curve. We observed that the MRI parameters did not depend on the type of bone involved. There was no significant difference between the DWI and DCE-MRI parameters obtained from tarsals or metatarsals.
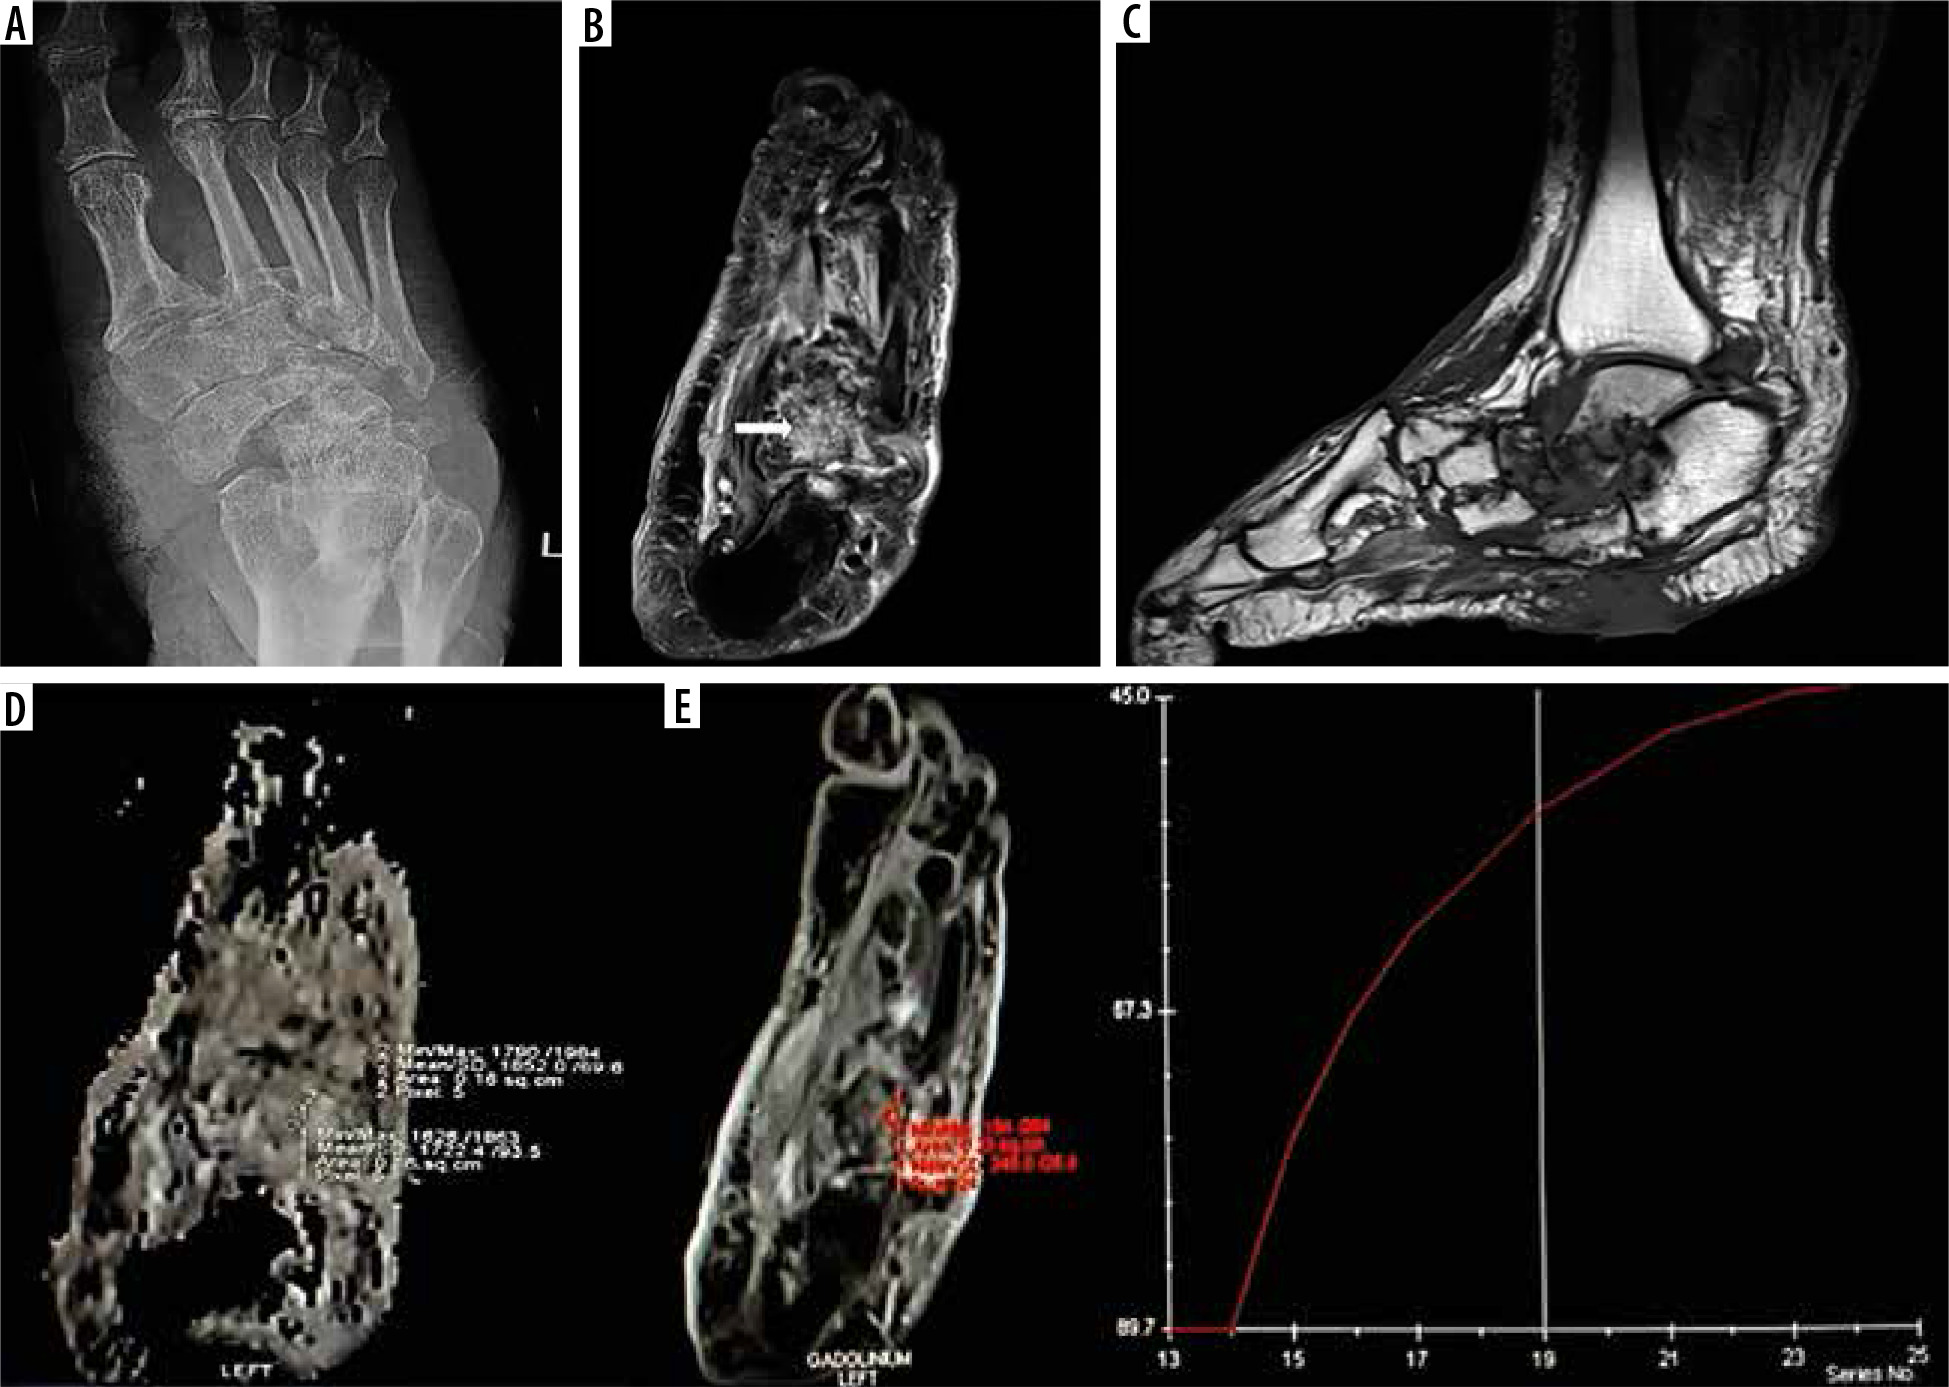
Figure 2
A 57-year-old male patient presented with chronic ulceration on the ventral aspect of the foot involving the hindfoot. The biopsy was done from the suspected site of infection. However, it turned out to be sterile. The patient was managed conservatively and showed improvement on follow-up. A) X-ray AP view shows cortical irregularity and sclerosis involving the bones of the mid and hindfoot along with associated intertarsal joint irregularities. B) Axial T2 fat sat image shows heterogeneously increased T2 signal involving multiple bones of the midfoot predominantly involving the cuboid (white arrow) along with bony irregularity, irregular joint spaces, and altered bony alignment. C) Sagittal T1 image showing altered bony signal and ulcer on the ventral aspect of the foot. D) ADC map shows ADC value of 1.7 × 10⁻³ mm2/s with ROI drawn in the cuboid bone. E) Dynamic curve analysis reveals type 1 curve. SImax – 245.0, SI0 – 89.7
Non-contrast diffusion-weighted parameters like ADC, which depend upon the diffusivity of the water molecules between the intracellular and extracellular compartment, have been explored to identify malignant and infectious conditions [10,11,21-24]. It was observed that there is diffusion restriction in the infected area, as also observed in the current study. The biopsy-proven positive cases of DFO showed significantly more diffusion restriction and lower ADC values as compared to the biopsy-negative cases. The ADC value below 1.57 × 10⁻³ mm2/s had a sensitivity of 88.2% and specificity of 80% for diagnosing bone infection. Razek et al. determined an ADC value of 1.04 × 10⁻³ mm2/s, which had a sensitivity of 93% and specificity of 96% for DFO [10]. Another study showed lower ADC values (0.75 × 10⁻³ mm2/s) in the infected bone compared to normal bone (1.15 × 10⁻³ mm2/s) or surrounding soft tissue (0.90 × 10⁻³ mm2/s) [11]. Both of these studies were performed on 1.5-T machines with slightly different parameters. This could be the reason for the absolute difference in the ADC values from our study. The increased cellularity attributed to inflammatory cells, pus cells, and dead organisms in addition to the cellular swelling, which narrows the extracellular space in infectious areas, reduce the diffusivity and the ADC values.
There are some limitations to this study, including the utilization of semi-quantitative variables. These variables are sensitive to variations between different acquisition protocols and various other factors like hardware settings, the amount of contrast injected, contrast agent properties, etc. Nevertheless, the semi-quantitative analysis of the DCE-MRI is straightforward, unlike compartmental or quantitative analysis, which is complex and time-consuming. Secondly, the values of the MRI parameters assessed in the present study should be compared to those of isotope studies, which are currently extensively used to diagnose pedal osteomyelitis. A multicentre study with larger sample size is required to assess the role of DCE-MRI to reliably distinguish between the various causes of an acute swollen foot in a diabetic patient.
Conclusions
Non-contrast diffusion-weighted sequences help to increase the overall specificity of conventional MRI for the diagnosis of pedal osteomyelitis. It is specifically beneficial in this population of patients who commonly have associated deranged renal parameters. The dynamic contrast enhancement parameters SI0, SImax, WIR, and type of curve also help in the detection of DFO, with WIR and type II curve being most advantageous for diagnosing osteomyelitis. It can help in increasing the overall sensitivity and specificity of MRI in differentiating DFO from acute Charcot arthropathy, thus alleviating the diagnostic dilemma.