


Introduction
Hypoxic-ischaemic encephalopathy (HIE) is a brain injury caused by asphyxia. In severe situations, it can cause lifelong neurological damage in the paediatric patient group, such as decreased physical and cognitive abilities, placing a significant cost on society [1,2]. Early therapy is essential for improving prognosis; therefore, early detection of the condition is seen as beneficial.
The radiological diagnosis of diffuse hypoxic-ischaemic injury in paediatric patients might be challenging. Magnetic resonance imaging (MRI) has become a diagnostic routine, although the interpretation of these investigations is complicated by numerous circumstances. MRI, especially diffusion-weighted imaging (DWI), has proven crucial to the diagnostic evaluation, severity determination, and prognosis of HIE [3,4]. DWI is most sensitive for ischaemia and stroke in adults, but it might be difficult to interpret in paediatric patients due to inadequate myelination; hence, apparent diffusion coefficient (ADC) maps are advised for evaluating HIE [5].
ADC maps have been studied as a predictive tool for neonatal HIE because of their quantitative nature [5-7]. ADC map analysis requires subjective positioning of the region of interest, which yields a volume-averaged value over an area of the brain. Reproducibility and diagnostic/prognostic value can be enhanced by more objective ADC analysis. Existing ADC studies selected sample image layers and manually drew the ROI. Measurement with this method failed to capture the heterogeneity of lesions, which may have resulted in an underestimation [8]. Whole-lesion volumetric ADC histogram evaluation is used to examine the distribution of ADC values of the entire lesion and avoids the subjectivity of ROI placement to assure repeatability and calculation precision. This method records the ADC values of the entire lesion and may eliminate sampling bias.
Using histogram analysis, each voxel in the region of interest is distributed into a histogram, and quantitative parameters that describe the diffusion heterogeneity can be generated in a short amount of time. Histogram analysis is simple to grasp and simple to put into practice. Histogram exploited the full potential of the ADC to enhance clinical diagnosis and prognosis by assessing quantitative parameters in brain tissues. This resulted in a marked improvement in patient outcomes [9].
To our knowledge, no study has been done on volume-tric ADC histogram analysis in paediatric patients other than neonatal patients in the literature. In our study, we aimed to evaluate the whole brain, hippocampus, thalamus, and lentiform nucleus by volumetric ADC histogram analysis in paediatric patients with HIE due to various reasons, such as drowning or foreign body aspiration, and to compare with the control group with normal cranial MRI examinations.
Material and methods
This retrospective study included 25 patients with HIE and 50 patients as the control group with normal cranial MRI examinations. The study was approved by the Ethics Committee (approval number: 2022/374), and written informed consent was obtained from all patient representatives.
Volumetric ADC histogram analysis of the whole brain, hippocampus, thalamus, and lentiform nucleus were evaluated in cranial MRI examinations of paediatric patients with HIE (4 patients due to arrest of unknown cause, 6 patients due to foreign body aspiration, 4 patients due to trauma, 5 patients due to drowning, 4 patients due to post-seizure arrest, one patient due to hydatid cyst rupture, and one patient due to diaphragmatic hernia) (Figures 1 and 2). Minimum, mean, and maximum ADC values, skewness, kurtosis, variance, 5th, 10th, 25th, 50th, 75th, 90th, and 95th percentile values were calculated and assessed by comparing with the control group.
Figure 1
A 5-year-old male patient after aspiration of a foreign body. The T1W image (A) reveals a decrease in signal intensity in the white matter and an increase in signal intensity in the thalamus and basal ganglia. In the T2W image, an increased signal is observed in the thalamus and basal ganglia and a decreased signal in the white matter. High signal intensity is seen in the white matter of the bilateral frontal, temporal, and occipital lobes in the diffusion-weighted sequence (C). The whole brain was evaluated manually as an area of interest (ROI) in each slice of the apparent diffusion coefficient (ADC) map (D)
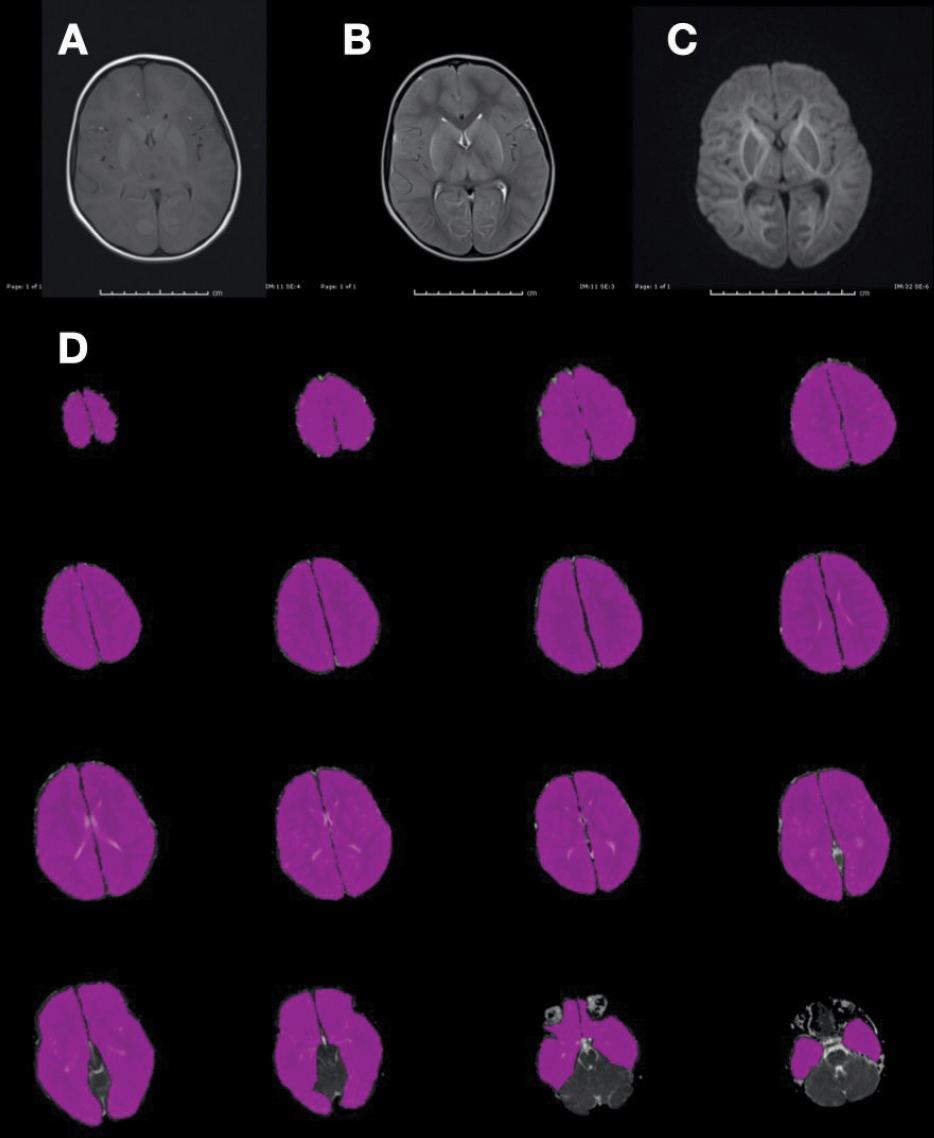
Figure 2
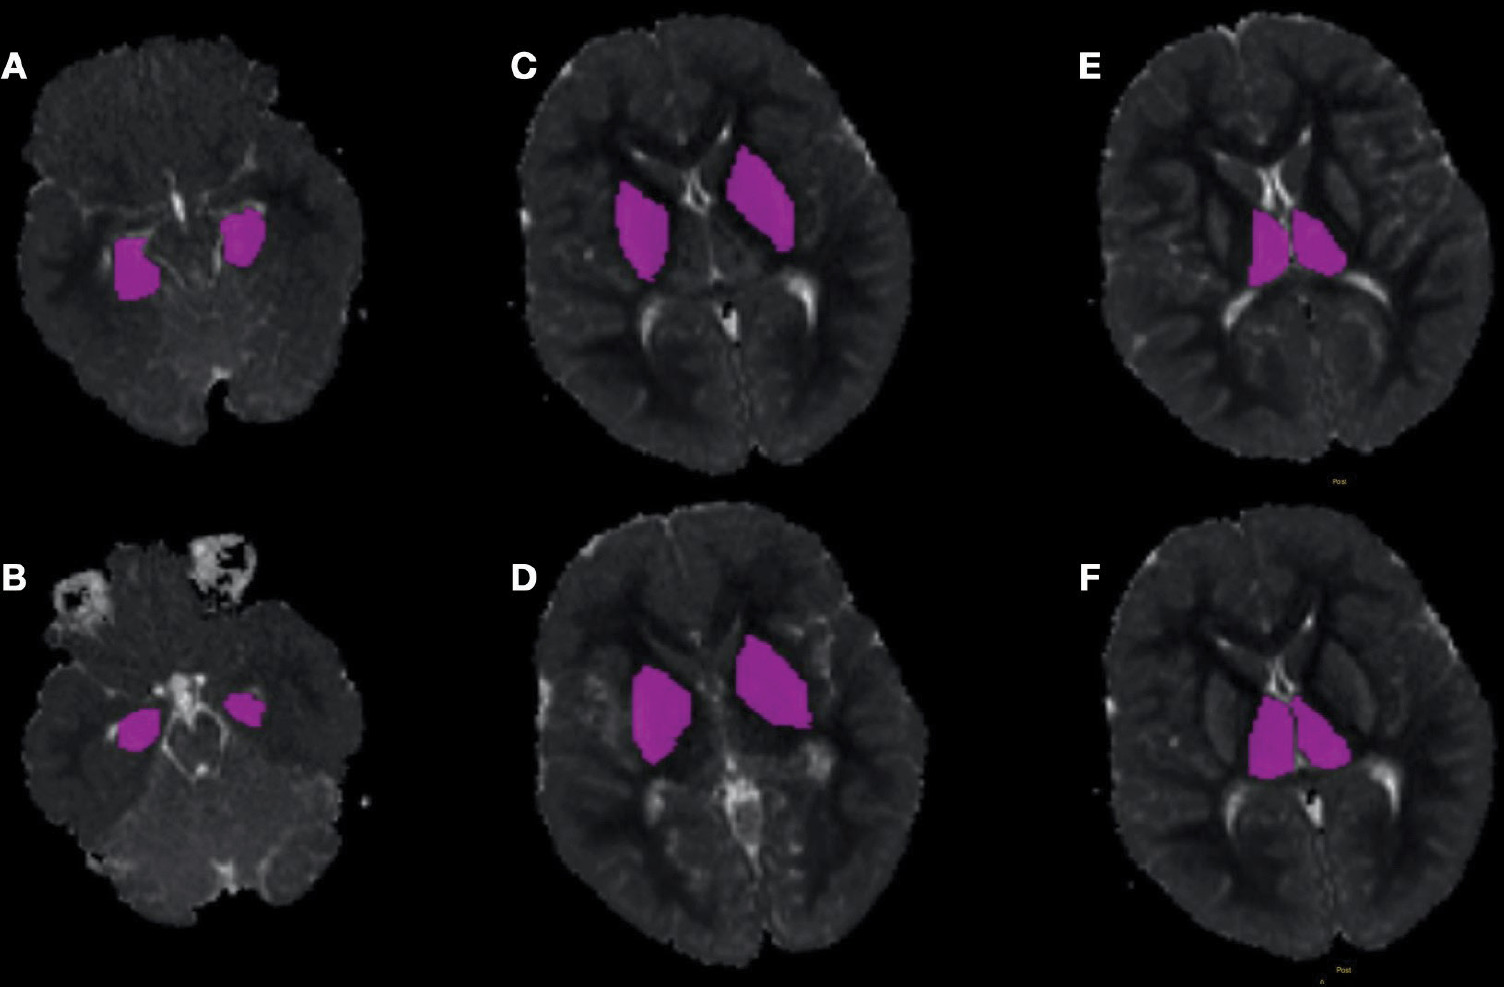
An example of manually drawn ROIs on the apparent diffusion coefficient (ADC) maps for assessing the volumetric ADC histogram analysis of the hippocampus (A, B), lentiform nucleus (C, D), and thalamus (E, F) obtained from the patient shown in Figure 1. The axial T2W, T1W, and diffusion-weighted images were referred to for details. Consequently, the ROI was placed on the ADC map
Patients under the age of 18 years, with MRI (including DWI and ADC sequences) within one week of the hypoxia-causing event, and with no additional cranial pathology were included in this study. Cases with congenital brain anomalies, neonatal hypoxic encephalopathy, and poor image quality due to motion artifacts were excluded from the study.
MRI was performed using a 1.5-T MR unit (Verio; Siemens Medical Solutions, Erlagen, Germany) with a 32-channel phased array surface coil for signal reception. Diffusion-weighted imaging was administered at b-values of 1000 s/mm2. The conventional sequence comprised matrix 256 × 144, field of vision (FOV) 250 × 250 mm, layer thickness 5 mm, and layer spacing 4 mm; the fast spin echo sequence with T2WI comprised repeat time (TR) 4500 ms and echo time (TE) 100 ms; the axial T2 fluid attenuating inversion recovery sequence (FLAIR) comprised TR 11,000 ms and TE 92 ms; the axis T1-weighted image (T1WI) spin echo sequence comprised TR 450 ms and TE 8.9 ms; the axial dispersion weighted image (DWI) sequence comprised TR 4500 ms, TE 115 ms, b-value 1000 s/mm2, matrix 160 × 160, FOV 250 × 200 mm, layer thickness 5 mm, and layer spacing 4 mm.
Image analysis
All DWI raw data were sent from the picture archiving and communication system (PACS) to a PC, where they were processed with the open-source LIFEx 7.2.0 voxel program (https://lifesoft.org). All MR images were analysed by 2 radiologists (with 11 and 23 years of experience in cranial MRI, respectively), who were blinded to the clinical data and examined each scan independently. Each ROI was manually drawn to include the entire brain, hippocampus, thalamus, and lentiform nucleus. Each ROI was automatically combined into a volumetric ROI comprising voxel data for the entire region. Then, a volumetric ADC map was created with the subsequent model: S = S0 exp (b ADC), where S indicates diffusion-induced signal attenuation, S0 represents signal intensity in the absence of diffusion sensitization, and b is the b-value, which specifies the signal’s degree of diffusion weighting. The 5th, 10th, 25th, 50th, 75th, 90th, and 95th percentiles of ADC values were determined, along with the ADC min, ADC mean, ADC max, skewness, kurtosis, and variance.
Statistical analysis
IBM SPSS 23.0 was used to conduct statistical analysis (Chicago, IL, United States). From the data set created by combining the ADC measurements of each patient in the HIE and control groups, histograms of the groups were generated. Histograms demonstrated distributional variation in all HIE and control patient measures. Using these measurements, descriptive statistics such as mean, minimum, maximum, standard deviation, skewness, kurtosis, and percentiles were computed for each patient group, and the variations in the resulting descriptive statistics were depicted graphically. These group statistics were computed for individuals. Using the t-test for independent samples, it was determined whether these statistics derived from individuals differed between groups. On the basis of individual statistics, ROC curves were generated, and the threshold value for the acquired statistics was calculated. Sensitivity and specificity values for threshold values were calculated.
Results
Demographic data
Twenty-five cases were assigned to the HIE group (age range 3 months to 14 years [mean 4.13 ± 4.1]), and 50 cases were included in the control group (age range 2 months to 14 years [mean 3.56 ± 3.5]). There were no significant differences in gender or age between the 2 groups.
Interobserver agreement
Using the interclass correlation coefficient (ICC), the 2 observers’ agreement was evaluated. For all the parame-ters, the ICCs exceeded 0.8, indicating almost perfect agreement.
Results of ADC histogram parameters in the HIE and control groups
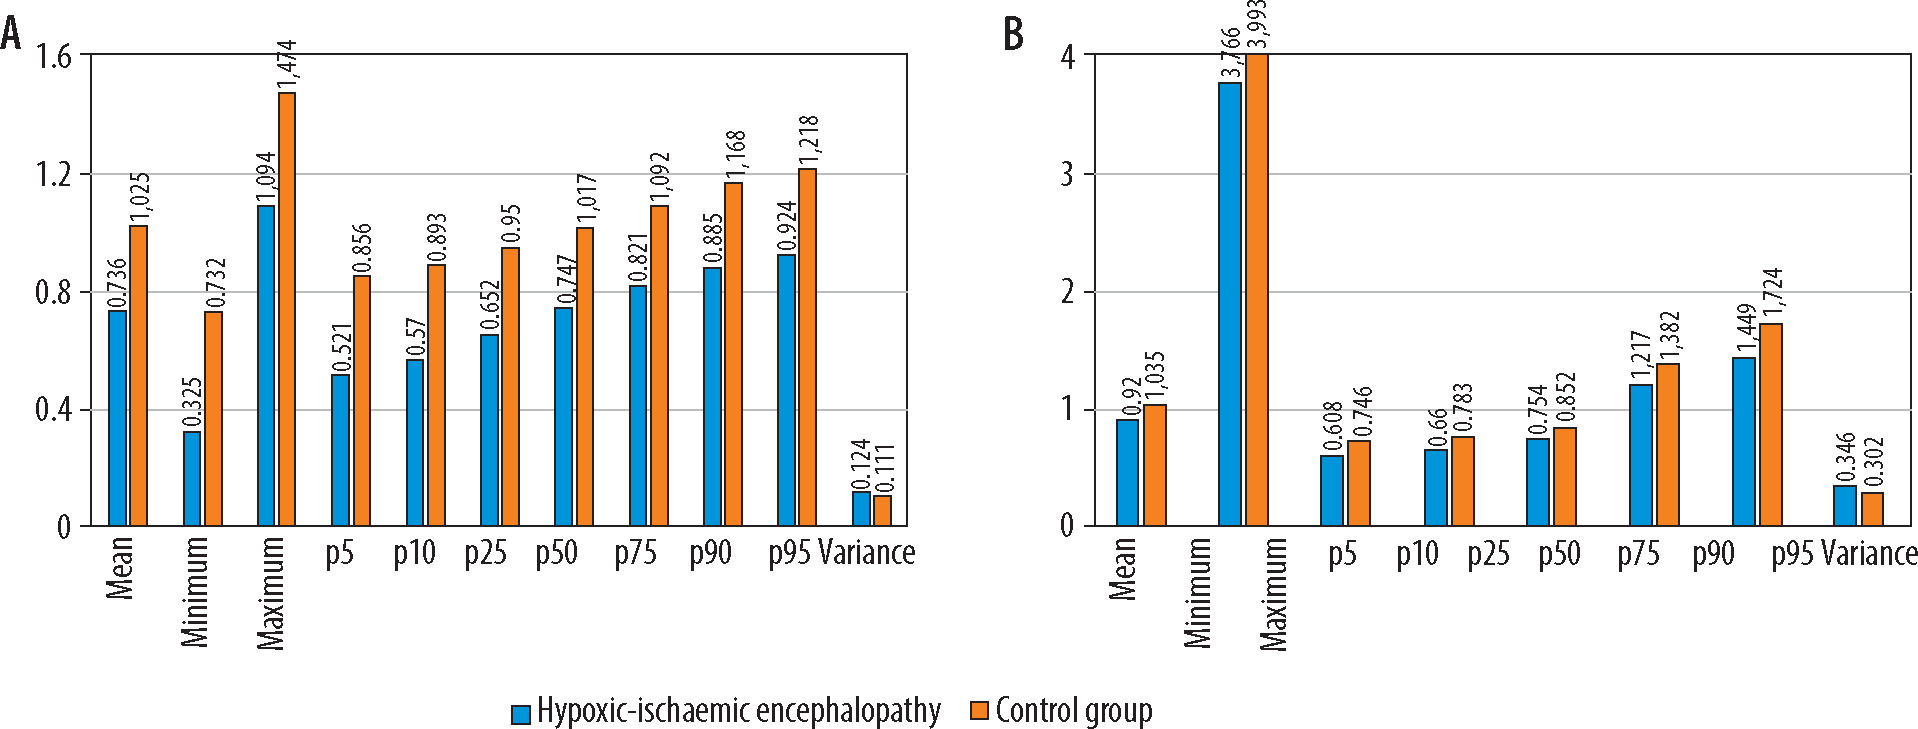
The 5th, 10th, 25th, 50th, 75th, 90th, and 95th percentiles of ADC values, the ADC min, ADC mean, and ADC max of the HIE group were all lower than those of the control group, and the difference was statistically significant (p < 0.001) in the volumetric histogram analysis of the hippocampus, thalamus, and lentiform nucleus (Figure 3). In the whole brain histogram analysis, ADC mean and ADC max with the 5th, 10th, 25th, 90th, and 95th percentiles of ADC values were significantly lower in the HIE group (Figure 4).
Figure 3
Results of the volumetric hippocampus (A) and thalamus (B) histogram analysis. The ADCmean, ADCmin, ADCmax, and 5th -95th percentiles of ADC values of the hypoxic-ischaemic encephalopathy group were all lower than those of the control group (p < 0.001). The variance of the hypoxicischaemic encephalopathy group was greater than that of the control group (p < 0.001). Apparent diffusion coefficient (ADC) values are expressed as × 10–3 mm2/s
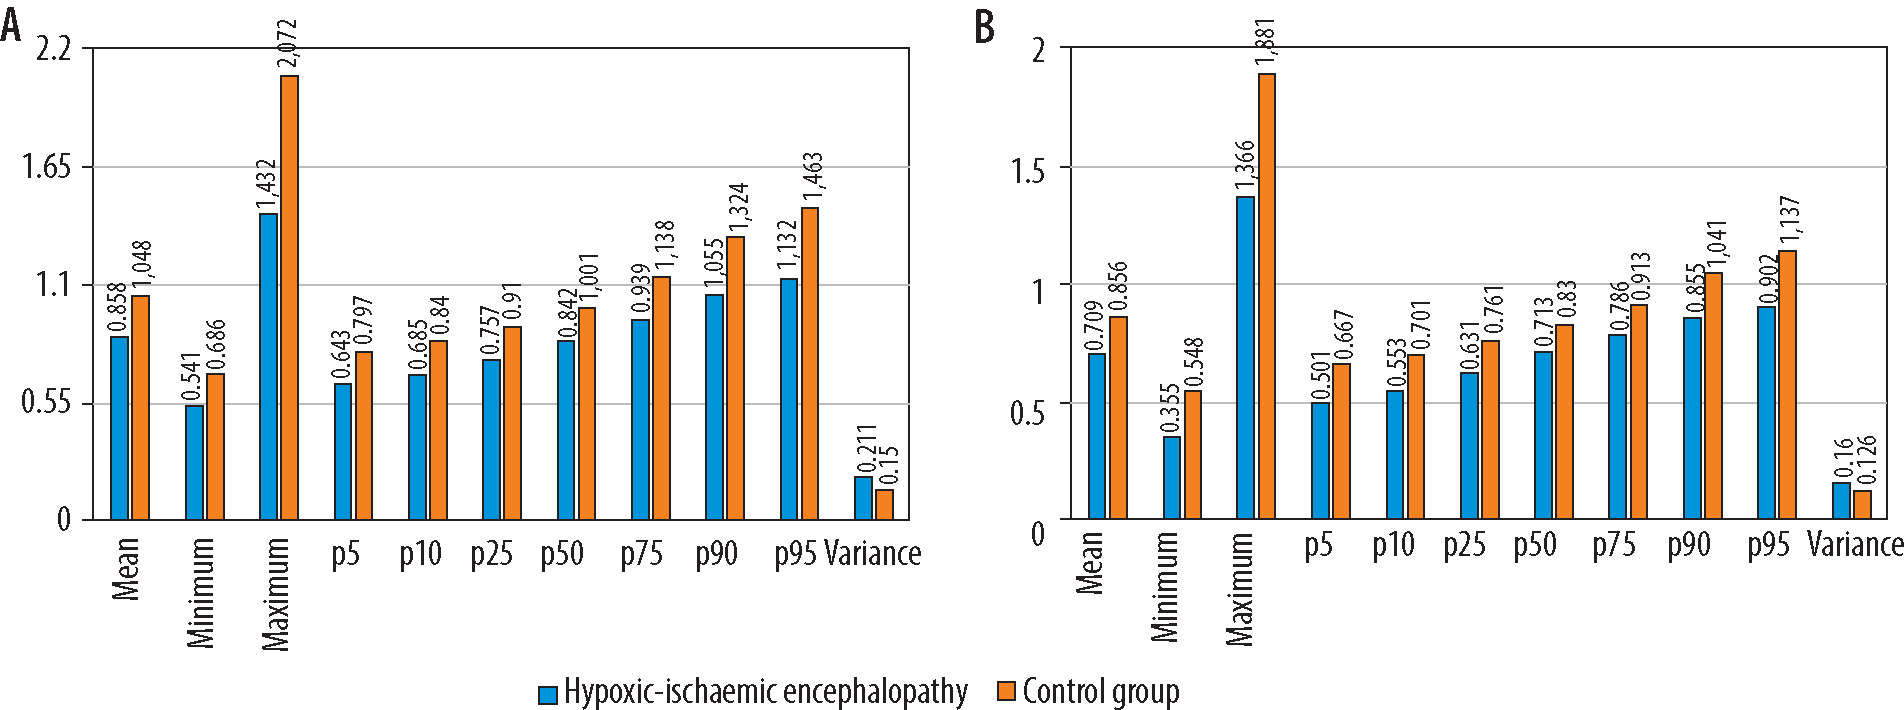
Figure 4
Results of the volumetric lentiform nucleus (A) and whole brain (B) histogram analysis. The hypoxic-ischaemic encephalopathy group’s ADCmean, ADCmax, 5th -25th , 90th , and 95th percentiles of apparent diffusion coefficient (ADC) values were all lower than those of the control group (p < 0.001). ADCmin, and the 50th and the 75th percentiles of ADC values were substantially lower only in the histogram analysis of the lentiform nucleus. The variance was higher in the hypoxic-ischaemic encephalopathy group in comparison to the control group in both analyses (p < 0.001). ADC values are presented as × 10–3 mm2/s
The kurtosis and the skewness were greater in the control group as compared to the HIE group, and the difference was statistically significant in the histogram analysis of the hippocampus, thalamus, and lentiform nucleus (p < 0.001) (Figures 2 and 3). In the whole-brain histogram analysis, no statistically significant difference was observed for the kurtosis or the skewness. The variance was larger in the HIE group in all histogram analyses compared to the control group, which was crucial (p < 0.001).
Diagnostic performance
The ROC curve showed that the efficiency of the ADC histogram parameters of the hippocampus gave the best results in the diagnosis of HIE. The area under the curve (AUC) of the 95th percentile of ADC values was the highest (0.915). Under the cut-off value of 1.262 × 10⁻³ mm2/s, the sensitivity and specificity were 88% and 84%, respectively. The diagnostic efficacy was followed by the 90th percentile of ADC value (AUC = 0.906). Under the threshold of 1.169 × 10⁻³ mm2/s, the sensitivity and specificity were 86% and 84%, respectively. AUC was also higher with ADC max (AUC = 0.888). Under the cut-off value of 1.634 × 10⁻³ mm2/s, the sensitivity and specificity were 90% and 80%, respectively (Figure 5).
Figure 5
The ROC (receiver operating characteristic) curve (A) represents the 95th and 90th percentiles of the apparent diffusion coefficient (ADC) and ADCmax values of the volumetric hippocampus histogram analysis. The AUC (area under the curve) was 0.915, 0.916, and 0.888, respectively. The ROC curve (B) depicts the 5th and 95th percentiles of the apparent diffusion coefficient and ADCmean values from the histogram analysis of the volumetric thalamus. The AUC was 0.876, 0.860, and 0.826, respectively
The significance of the thalamus histogram analysis results was greater. The 5th percentile of ADC values exhibited the greatest AUC (0.876). The sensitivity and specificity under the threshold of 0.543 × 10⁻³ mm2/s were92% and 76%, respectively. Following diagnostic effectiveness was the 95th percentile of ADC value (AUC = 0.875). Under the cut-off value of 0.95 × 10⁻³ mm2/s, the sensitivity and specificity were 82% and 72%, respectively. AUC was likewise higher with ADC mean (AUC = 0.871). Under the threshold of 0.754 × 10⁻³ mm2/s, the specificity, and sensitivity were 76% and 88%, respectively (Figure 5).
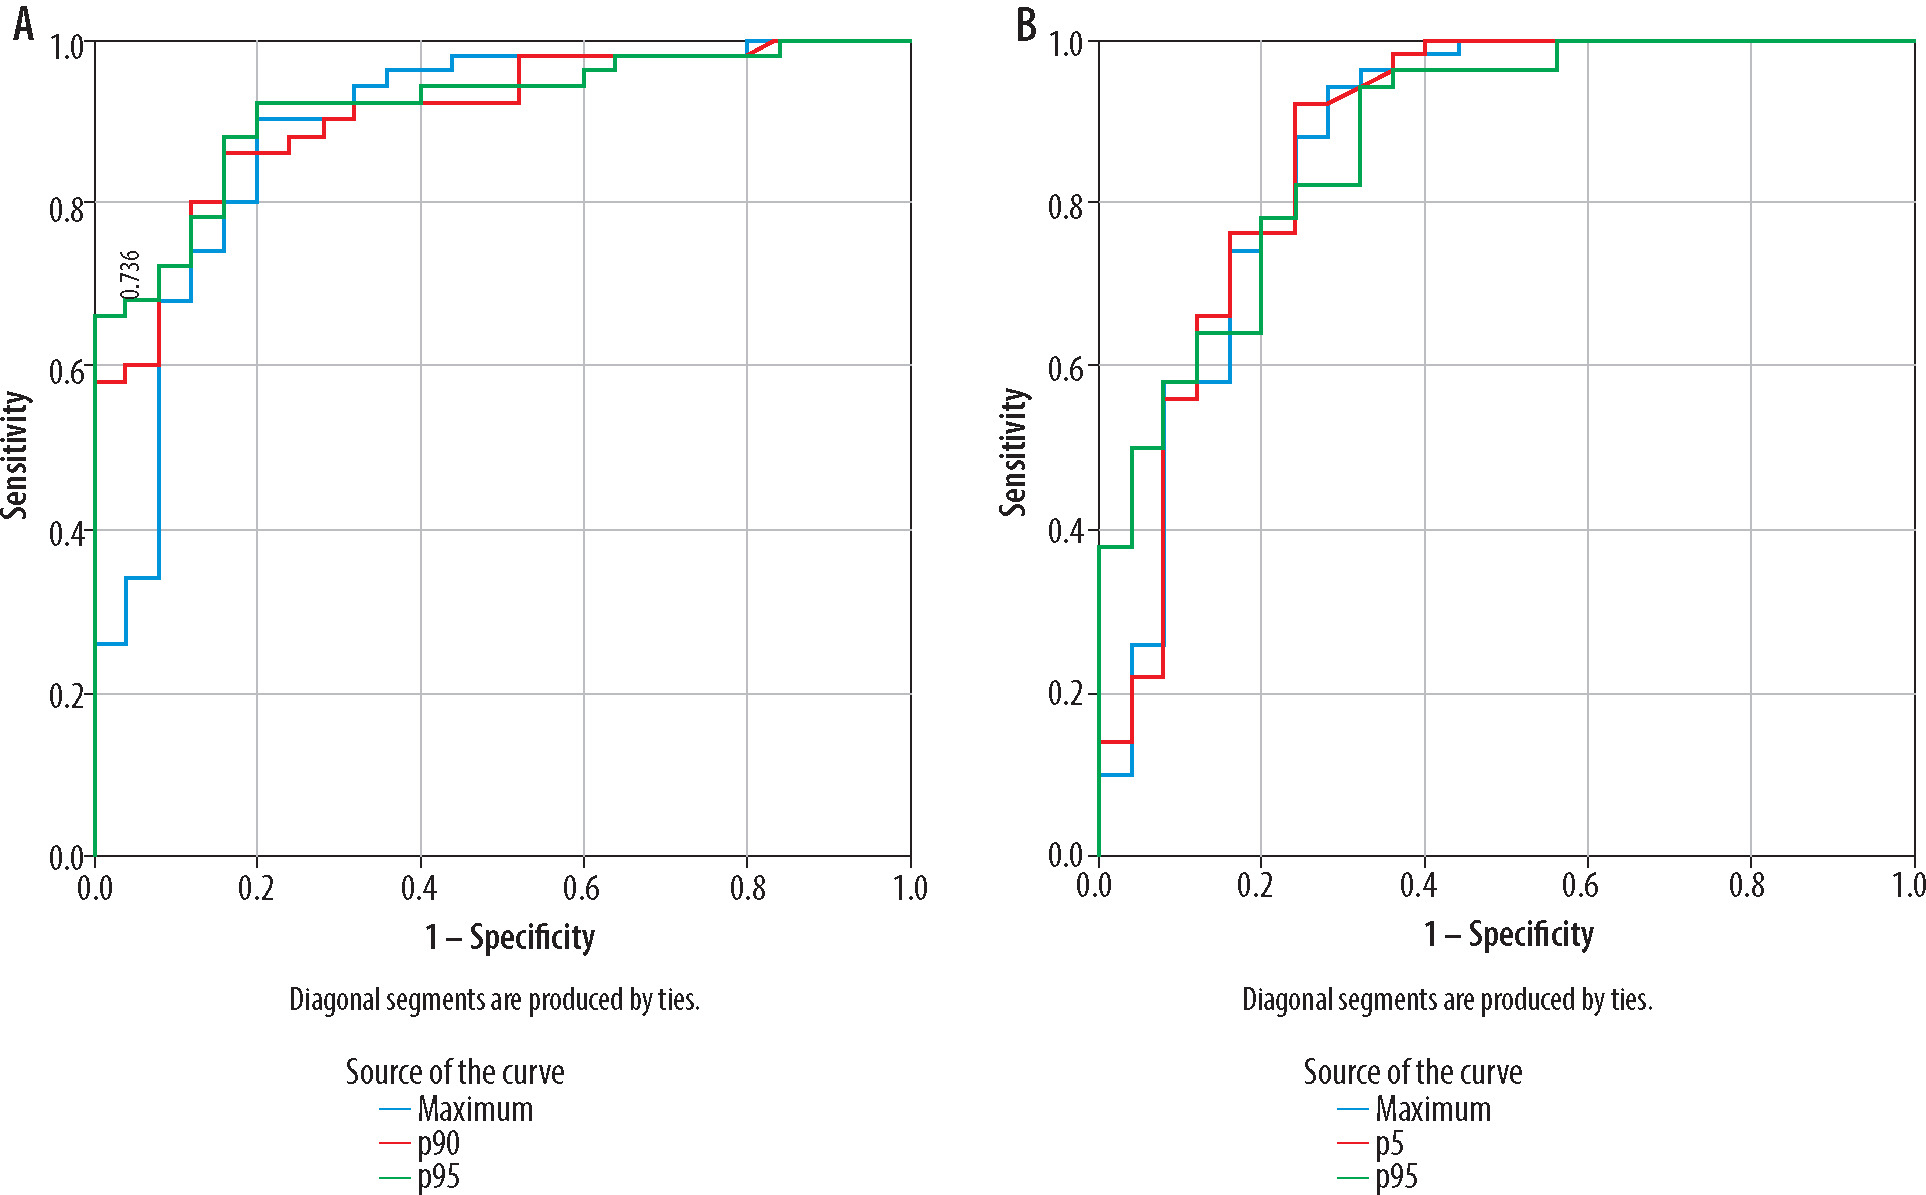
In the assessment of lentiform nucleus histogram analysis, the AUC was highest with ADCmin (AUC = 0.867), followed by the 5th percentile of ADC value (AUC = 0.860) and skewness (AUC = 0.826). Under the cut-off values of 0.505 × 10⁻³ mm2/s, 0.592 × 10⁻³ mm2/s, and 0.056, the sensitivity and specificity were 80% and 84%, 94% and 72%, and 98% and 68%, respectively (Figure 6).
Figure 6
The ROC (receiver operating characteristic) curve of lentiform nucleus histogram analysis (A). The AUC (area under the curve) was highest with ADCmin (AUC = 0.867), followed by the 5th percentile of the apparent diffusion coefficient (ADC) value (AUC = 0.860), and skewness (AUC = 0.826). The ROC curve of whole brain histogram analysis (B). AUC was highest with ADCmax (AUC = 0.787), followed by the 5th percentile of the ADC value (AUC = 0.735) and the 10th percentile of the ADC value (AUC = 0.728)
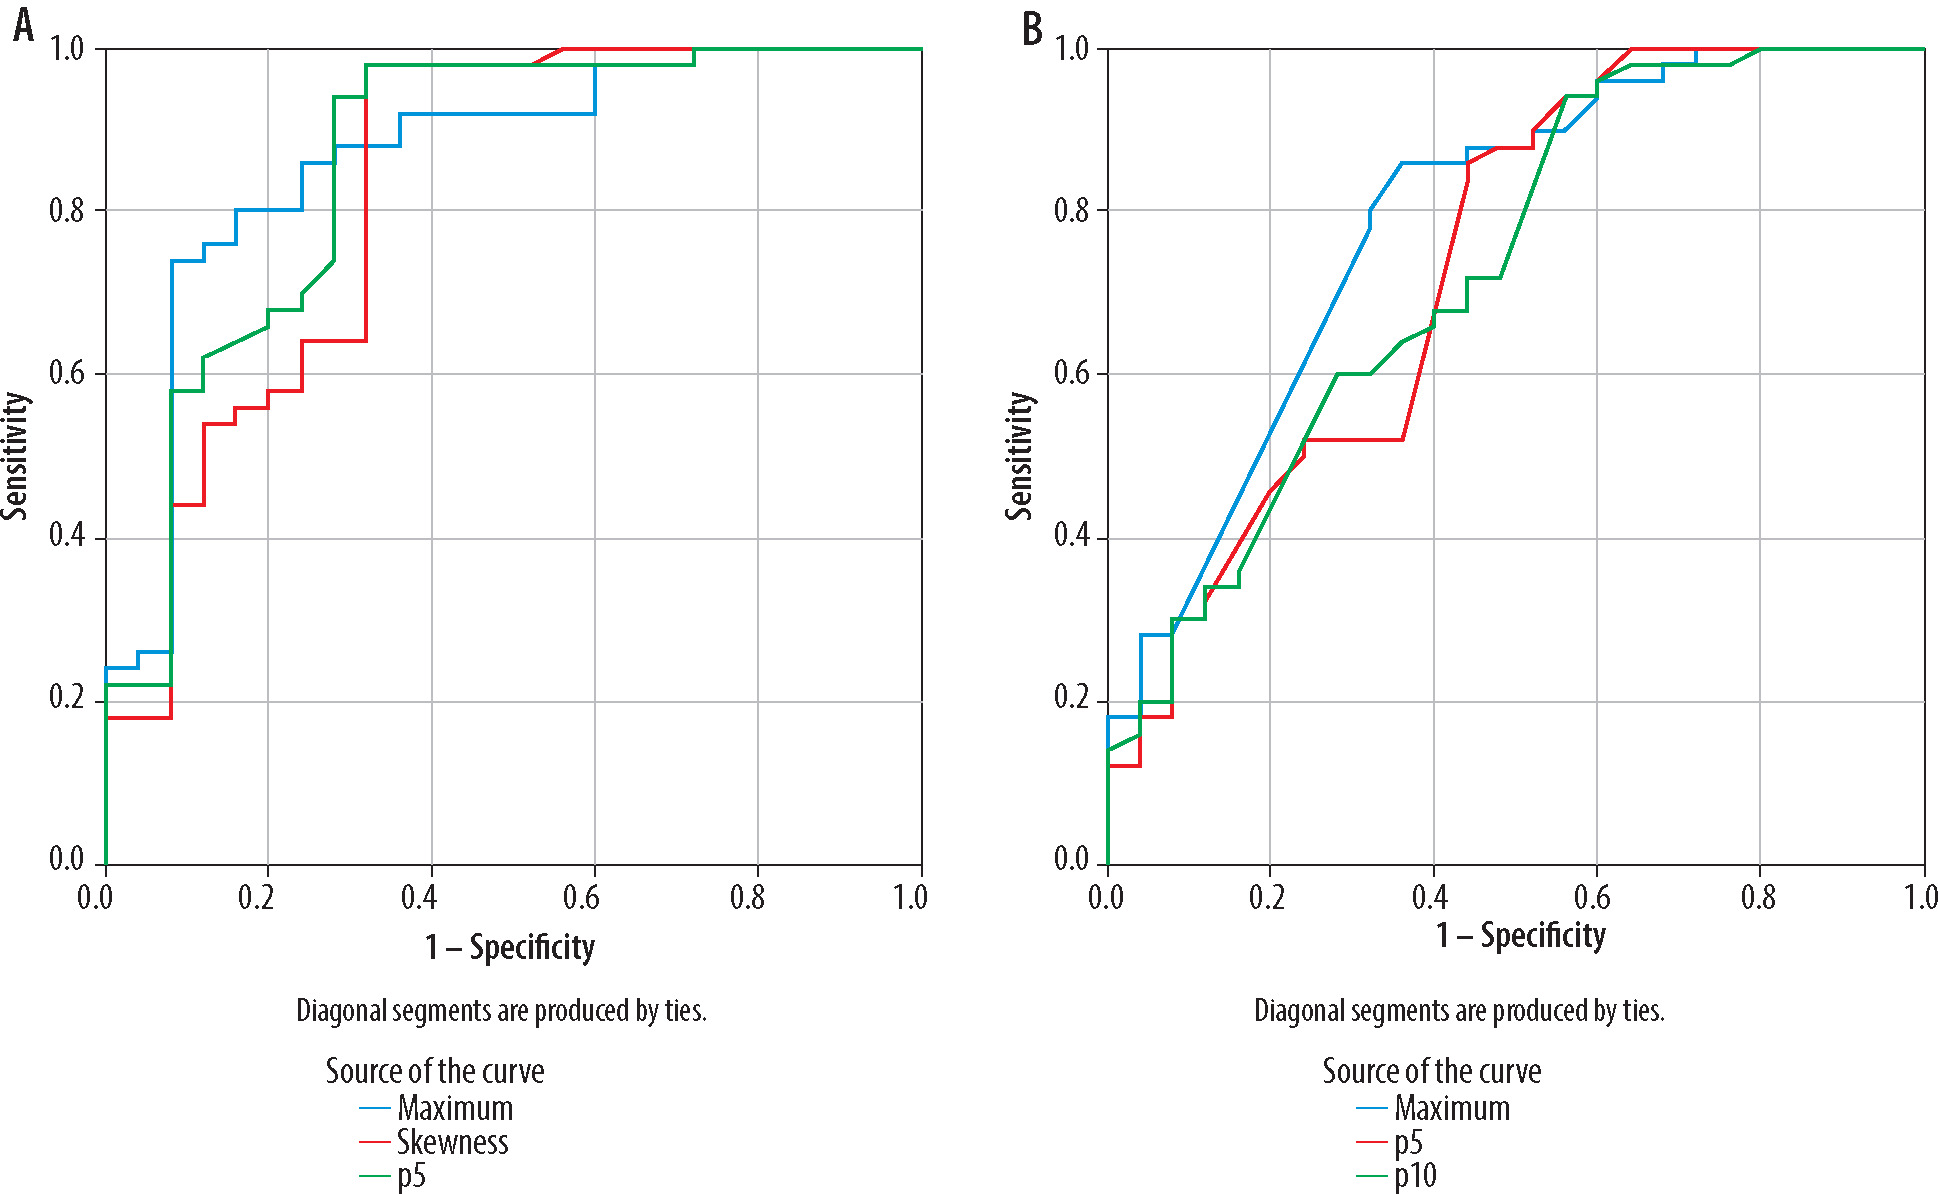
In the evaluation of whole-brain histogram analysis, the AUC was highest with ADC max (AUC = 0.787), followed by the 5th percentile of the ADC value (AUC = 0.735), and 10th percentile of the ADC value (AUC = 0.728). Under the cut-off values of 3.988 × 10⁻³ mm2/s, 0.644 × 10⁻³ mm2/s, and 0.734 × 10⁻³ mm2/s, the sensitivity and specificity were 80% and 68%, 86% and 56%, and 60% and 72%, respectively (Figure 6).
Discussion
ADC values relate to the lesion microenvironment, including cellular proliferation, membrane stability, and extracellular matrix. ADC values mirror the Brownian motion of random water and are associated with Brownian motion [10-12]. At b-values between 200 and 1000 s/mm2, the diffusion-related signal attenuation is linear, consistent with Gaussian diffusion. When b-values are above 1000 s/mm2, non-Gaussian diffusion occurs, and the ADC value correspondingly decreases [13].
In accordance with the commonly acquired clinical ADC, histogram analysis can be utilized to characterize the signal intensity distribution in voxels. Histogram characteristics describing the statistical interrelationships between adjacent voxels can reveal lesion heterogeneity. In terms of tumour grading or prognosis evaluation, the current method has demonstrated significant advantages [14-18]. It is also used in treatment strategies for a wide variety of conditions that are not related to malignancy [19,20]. In contrast, use of ADC histograms in HIE has been reported infrequently [21-23].
In one study, researchers used ADC histogram analysis to assess sensitivity as a quantitative indicator of hypoxicischaemic encephalopathy in infants by correlating changes in diffusion values with gestational age. They concluded that the normative values generated from newborns without radiographic signs of ischaemic injury are linked to gestational age [21].
Sarioglu et al. [22] found that the histogram entropy log-10 value can be used to distinguish between moderate-to-severe and mild HIE.
Wang et al. [23] evaluated the diagnostic value of the whole-brain ADC histogram analysis in assessing the severity of neonatal HIE and assessed the ADC min, ADC mean, and ADC max, the 10th-70th, and 90th percentiles of ADC values, the variance, skewness, kurtosis, heterogeneity, and mode-value of histogram analysis, and compared the moderate-to-severe group with the mild group. They determined that all ADC values were lower in the moderate-to-severe group while the other parameters were higher than those of the mild group. The AUC of variance was the highest (0.977), followed by the 10th percentile of ADC value (AUC = 0.954) and the kurtosis (AUC = 0.878). We evaluated volumetric ADC histogram analysis using the same parameters as in the above research. However, our patient group included paediatric patients, and we compared them with the control group. The hippocampus, thalamus, and lentiform nucleus were analysed in our study, in addition to whole-brain histogram analysis.
According to Kang et al. [24], low percentile ADC values had a significant correlation with high cell density. ADC values were lower in the HIE group, which presented a higher amount of limited diffusion of water molecules in the brain than the control group, which explained the oedema of brain cells that were associated with abnormalities in energy metabolism following HIE.
The variance in the HIE group was greater than that of the control group, indicating that the heterogeneity of the ROI was large and the complexity of the image was high, which could objectively reflect the pathological variations of brain oedema, degeneration, necrosis, and other pathological changes after hypoxia, and could accurately identify lesions by morphology [25].
The novelty of our study arises from the fact that, to our knowledge, there are no other studies in the literature that performed volumetric histogram analysis in the paediatric HIE group. We evaluated only the ADC values derived from the b-value of 1000 mm2/s because no significant differences were found with low b-values in the studies carried out [26,27]. In our study, a retrospective analysis method with potential bias was used in patient selection. The ADC histogram of monolayer brain tissue did not cover all the brain’s voxels, which may have resulted in sampling bias. When the ROI was formed, the ventricle, sulci, and cistern of the brain could not be completely excluded, which influenced the measured results significantly.
Conclusions
Our research indicated that volumetric ADC histogram analysis of the whole brain, hippocampus, thalamus, and lentiform nucleus at higher b-values could serve as an imaging marker to determine HIE and could objectively and quantitatively indicate information about cerebral diffusion. Future studies can be conducted to evaluate the morbidity and prognosis of paediatric patients with HIE.