Introduction
Ovarian cancer is known as the seventh most common cancer and the fifth cause of cancer death among women. Approximately 239,000 new cases of ovarian cancer are diagnosed annually. Ovarian cancer is often diagnosed at advanced stages because of the subtle nature of ovarian cancer symptoms and the lack of effective early screening methods compared to other cancers such as colorectal, breast, and prostate cancers. In ovarian cancer patients with late diagnosis, the treatment focus is shifted to improving the quality of life and life expectancy [1,2]. Positron emission tomography (PET) is an effective imaging modality for obtaining detailed tissue metabolic information [3,4]. Gamma radiation attenuation correction in tissues is necessary for PET imaging. Such corrections are performed by anatomical imaging such as computed tomography scans. Hybrid PET-computed tomography (CT) imaging allows precise localisation of malignant lesions and improved diagnostic accuracy. Such imaging approaches, while effective, increase radiation exposure to patients [5]. No regulatory dose limits are considered for patients; the patient dose management should be based on the 2 radiation protection principles of justification and optimisation. Based on these principles, the radiation dose to the patients should be reduced to as low as reasonably achievable (ALARA). Therefore, efforts should be made to reduce the radiation doses to patients while obtaining desirable image quality [6].
Recently, the use of PET imaging has been increased in the diagnosis of different cancers. Son et al. [7] showed the superiority of PET imaging over anatomical 3D imaging modalities like magnetic resonance imaging (MRI) and CT in early-stage diagnosis. The efficacy of PET imaging in detecting ovarian cancer recurrence, especially in patients with elevated CA-125 levels, was investigated by Khiewvan et al. [8]. They showed that PET/CT and PET/MR imaging have high sensitivity rates for ovarian cancer recurrence detection. Engbersen et al. [9] reported higher accuracy of PET/CT and PET/MR in staging ovarian cancer and detecting small-size tumours compared to other imaging modalities. Artificial intelligence, especially deep-learning, has recently been used to improve image quality in different imaging modalities [10-12]. Xu et al. [13] reviewed the use of AI in the detection accuracy of ovarian cancer. Lu et al. [14] pointed out the increasing application of AI in tumour detection and for segmentation in diagnostic radiology. Matsubara et al. [15] showed that convolutional neural networks (CNNs) and generative adversarial networks (GANs) can be used as predominant AI networks in segmentation and for attenuation correction in PET images.
However, the challenges in the use of AI in PET-CT image processing remain. Sadaghiani et al. [16] indicated the need for further refinement before AI adoption in clinical applications because of inconsistent reproducibility. Lee et al. [17] hypothesised that AI could improve PET attenuation correction and proposed that MRI-based corrections have better performance than CT-based ones. Meanwhile, Yang et al. [18] showed the potential of deep CNN for converting raw PET images to attenuation corrected images with high accuracy but without clinical validation. GANs have been shown to be effective in the reconstruction of medical images with high accuracy. Liu et al. [19] and Roa et al. [20] successfully made pseudo-CT images from non-attenuation-corrected PET images that eliminate the need for repeating CT scans. Sorin et al.’s [21] and Matsubara et al.’s [22] latest systematic reviews have also shown how GANs have been useful in clinical imaging, particularly for generating high-quality CT and PET/CT images. Fukui et al. [23] and Hu et al. [24] demonstrated that GANs could produce accurate pseudo-CT images as well as attenuated PET images; these results were extended by Xiaofeng et al.’s [25] work showing cycle GANs being used to generate more precise attenuation-corrected PET images from raw data. This study aims to use the GANs to perform the attenuation correction in PET images, without the requirement for further anatomical imaging. The accuracy of deep learning techniques in synthesising PET/CT images, i.e. reconstructing attenuation-corrected PET images and creating pseudo-CT images from raw PET data, without the need for concurrent CT scans, is investigated in this study.
Material and methods
Patient selection and image acquisition
The approval of the Ethics Committee of Shiraz University was obtained before the data collection to ensure compliance with ethical standards in research (approval ID: IR.US.REC.1401.001). PET/CT images were collected from ovarian cancer patients at Kowsar Hospital in Shiraz, which is the only centre equipped with a PET/CT device in the south of Iran.
Patients had to sign informed consent forms and meet specific requirements to be included in the study. The study population consisted of patients diagnosed with ovarian cancer, either pre- or post-surgery. Participants were required to have a complete set of imaging data available, which included uncorrected PET images, attenuation-corrected PET images, CT scans, and PET/CT images. Additionally, the study included only those patients for whom essential information was accessible, such as height, weight, and blood sugar levels recorded prior to imaging. Patients who did not fit the above-mentioned requirements were not allowed to participate in the trial. PET-CT data collection was performed from April 2019 to June 2024. Sixty-one cases were prepared, among which 55 met the inclusion criteria. The data which were prepared included 12,366 uncorrected PET pictures, 12,366 corrected PET images, 16,402 CT scan images, and 12,366 PET/CT images.
The images were standardised and classified into separate folders to be used as the input for the training of the deep networks. Images from 45 patients were used to train the networks, while images from the 10 patients were reserved for the test set.
Network design and implementation
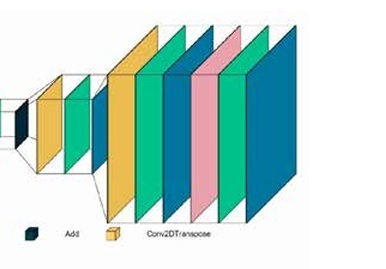
Three different architectures of GANs were evaluated in this study: conditional GAN [26], Wasserstein GAN (wGAN) [27], and cycle GAN [28]. These networks were designed to optimise the reconstruction of images from raw PET data to produce both attenuation-corrected PET images and pseudo-CT images. For the first 2 codes, we utilised previously established architectures. However, for the CycleGAN, we implemented our own proprietary architecture. The cycle GAN architecture employed consisted of 2 main components: the discriminator network and the generator network. The discriminator network included 5 deep convolutional layers with the following architecture: 64-128-256-512-512, utilising the leaky ReLU activation function. The generator network comprised 7 deep convolutional layers arranged in a U-Net architecture with layers structured as 64-128-256-512-256-128-64, using the ReLU activation function for most layers and the tanh activation function for the output layer to standardise pixel values between 0 and 1. The generator network of the CycleGAN model employed a ResNet block architecture. Each ResNet block consisted of two 3 × 3 convolutional layers with instance normalisation and ReLU activation. The output of the second convolution was then added to the input of the block, forming a skip connection. A total of 9 such ResNet blocks were used within the generator network. The network trained on real and synthetic images in a cyclical manner, with error functions such as mean squared error (MSE) and mean absolute error (MAE) used for evaluation. The initial generator within the cycle GAN was the only trainable sub-network, and training continued until a stable training process was observed or signs of failure emerged. The code for our implementations is available at the following GitHub repository: https://github.com/NM-DL-M/OCRE-GAN. Due to ethical considerations, the data used in this study cannot be shared. Figure 1 shows the generator and discriminator architectures of the CycleGAN network used in this study.
Key hyperparameters were optimised to enhance network performance. We employed an early stopping-based method to tune the neural network parameters. This approach monitored the model’s performance on validation data and halted training once improvements stabilised, thereby reducing the risk of overfitting and enhancing the model’s generalisation capability. The learning rate was initially set to 0.0001 to ensure stability, with separate rates defined for the generator and discriminator. The batch size was adjusted to balance the training stability and efficiency. Error coefficient weights for MSE and MAE were set at 1-5-10-10, respectively, and the number of training cycles was determined through initial runs of 10 epochs for hyperparameter optimisation, followed by final training with 50 epochs once optimal parameters were identified.
The software tools utilised included Python 3.9 with Anaconda and Spyder interface (version 5.2.2) for programming, SPSS v25 for statistical analysis, and 3D-Slicer 5.0.3 for image viewing, reviewing, and contouring. The network training was conducted on a system equipped with an Intel Core i7-11700K processor running at 3.60 GHz, with 64 GB of RAM, and powered by a GeForce RTX 4080 graphics processing unit to handle the computational demands of the training process.
Image reconstruction and evaluation
Reconstructed images from the test set were processed using the trained networks. The images were converted to DICOM format to facilitate clinical evaluation, ensuring the inclusion of necessary metadata. This step was crucial for enabling the clinical review of the images by specialists.
The evaluation of reconstructed images included both statistical and radiologic criteria. Statistically, the networks were assessed based on L1 loss, L2 loss, and generator loss. These metrics reflect the error rates of the sub-networks in generating and evaluating images. A stable training process is indicated by a gradual reduction in these values, although they should not reach zero as persistent zero values suggest a training failure in one of the sub-networks. Conversely, a stable and successful training process is characterised by minimising these values while maintaining non-zero oscillations. These errors are generally computed using the MAE and MSE functions, as shown below:
where yi represents the calculated value and xi the actual value of each pixel.
where Yi is the calculated value and is the predicted value.
Radiologic evaluation involved calculating the standardised uptake value (SUV) mean (SUVmean) and SUV max (SUVmax) for PET images and comparing the average Hounsfield unit (HU) values for CT images. SUV is a numerical radiological measure indicating the level of radiotracer uptake in tissues. Higher SUV values suggest greater metabolic activity in the examined area.
SUVmax represents the highest standardised uptake value in an image or entire study, crucial for distinguishing between benign and malignant lesions and comparing activity levels in suspicious areas with normal tissue.
For PET images, the SUVmean and SUVmax were calculated for both real and synthetic images, focusing specifically on the lungs and liver to assess the accuracy of the reconstructions. The evaluation of CT images involved comparing the average HU values between real and synthetic images. This comparison was made for the entire body, lungs, liver, and bones. However, due to observed weaknesses in the network’s ability to reconstruct bone structures, specific comparisons for bones were ultimately disregarded.
Stable training of the networks was indicated by a gradual decrease in error rates, maintaining an oscillatory behaviour above zero. Persistent zero values suggested training failure, while successful training was marked by maximum reduction in error rates. Significant differences in SUV or HU values (p < 0.05) between real and synthetic images indicated weaknesses in the reconstruction network.
To ensure clinical relevance, reconstructed PET/CT images were reviewed by a nuclear medicine specialist in a single-blind manner. The specialist compared synthetic images with real images to evaluate their diagnostic accuracy. The specialist’s ability to distinguish between real and synthetic images was assessed using the χ2 test. Additionally, the specialist provided reports on the synthetic images, which were compared with real image reports to evaluate the effectiveness of the synthetic images in accurately determining malignancy stages and PCI. Reports generated for synthetic images were compared with real image reports to assess the clinical applicability and accuracy of the synthetic images in diagnostic settings.
Results
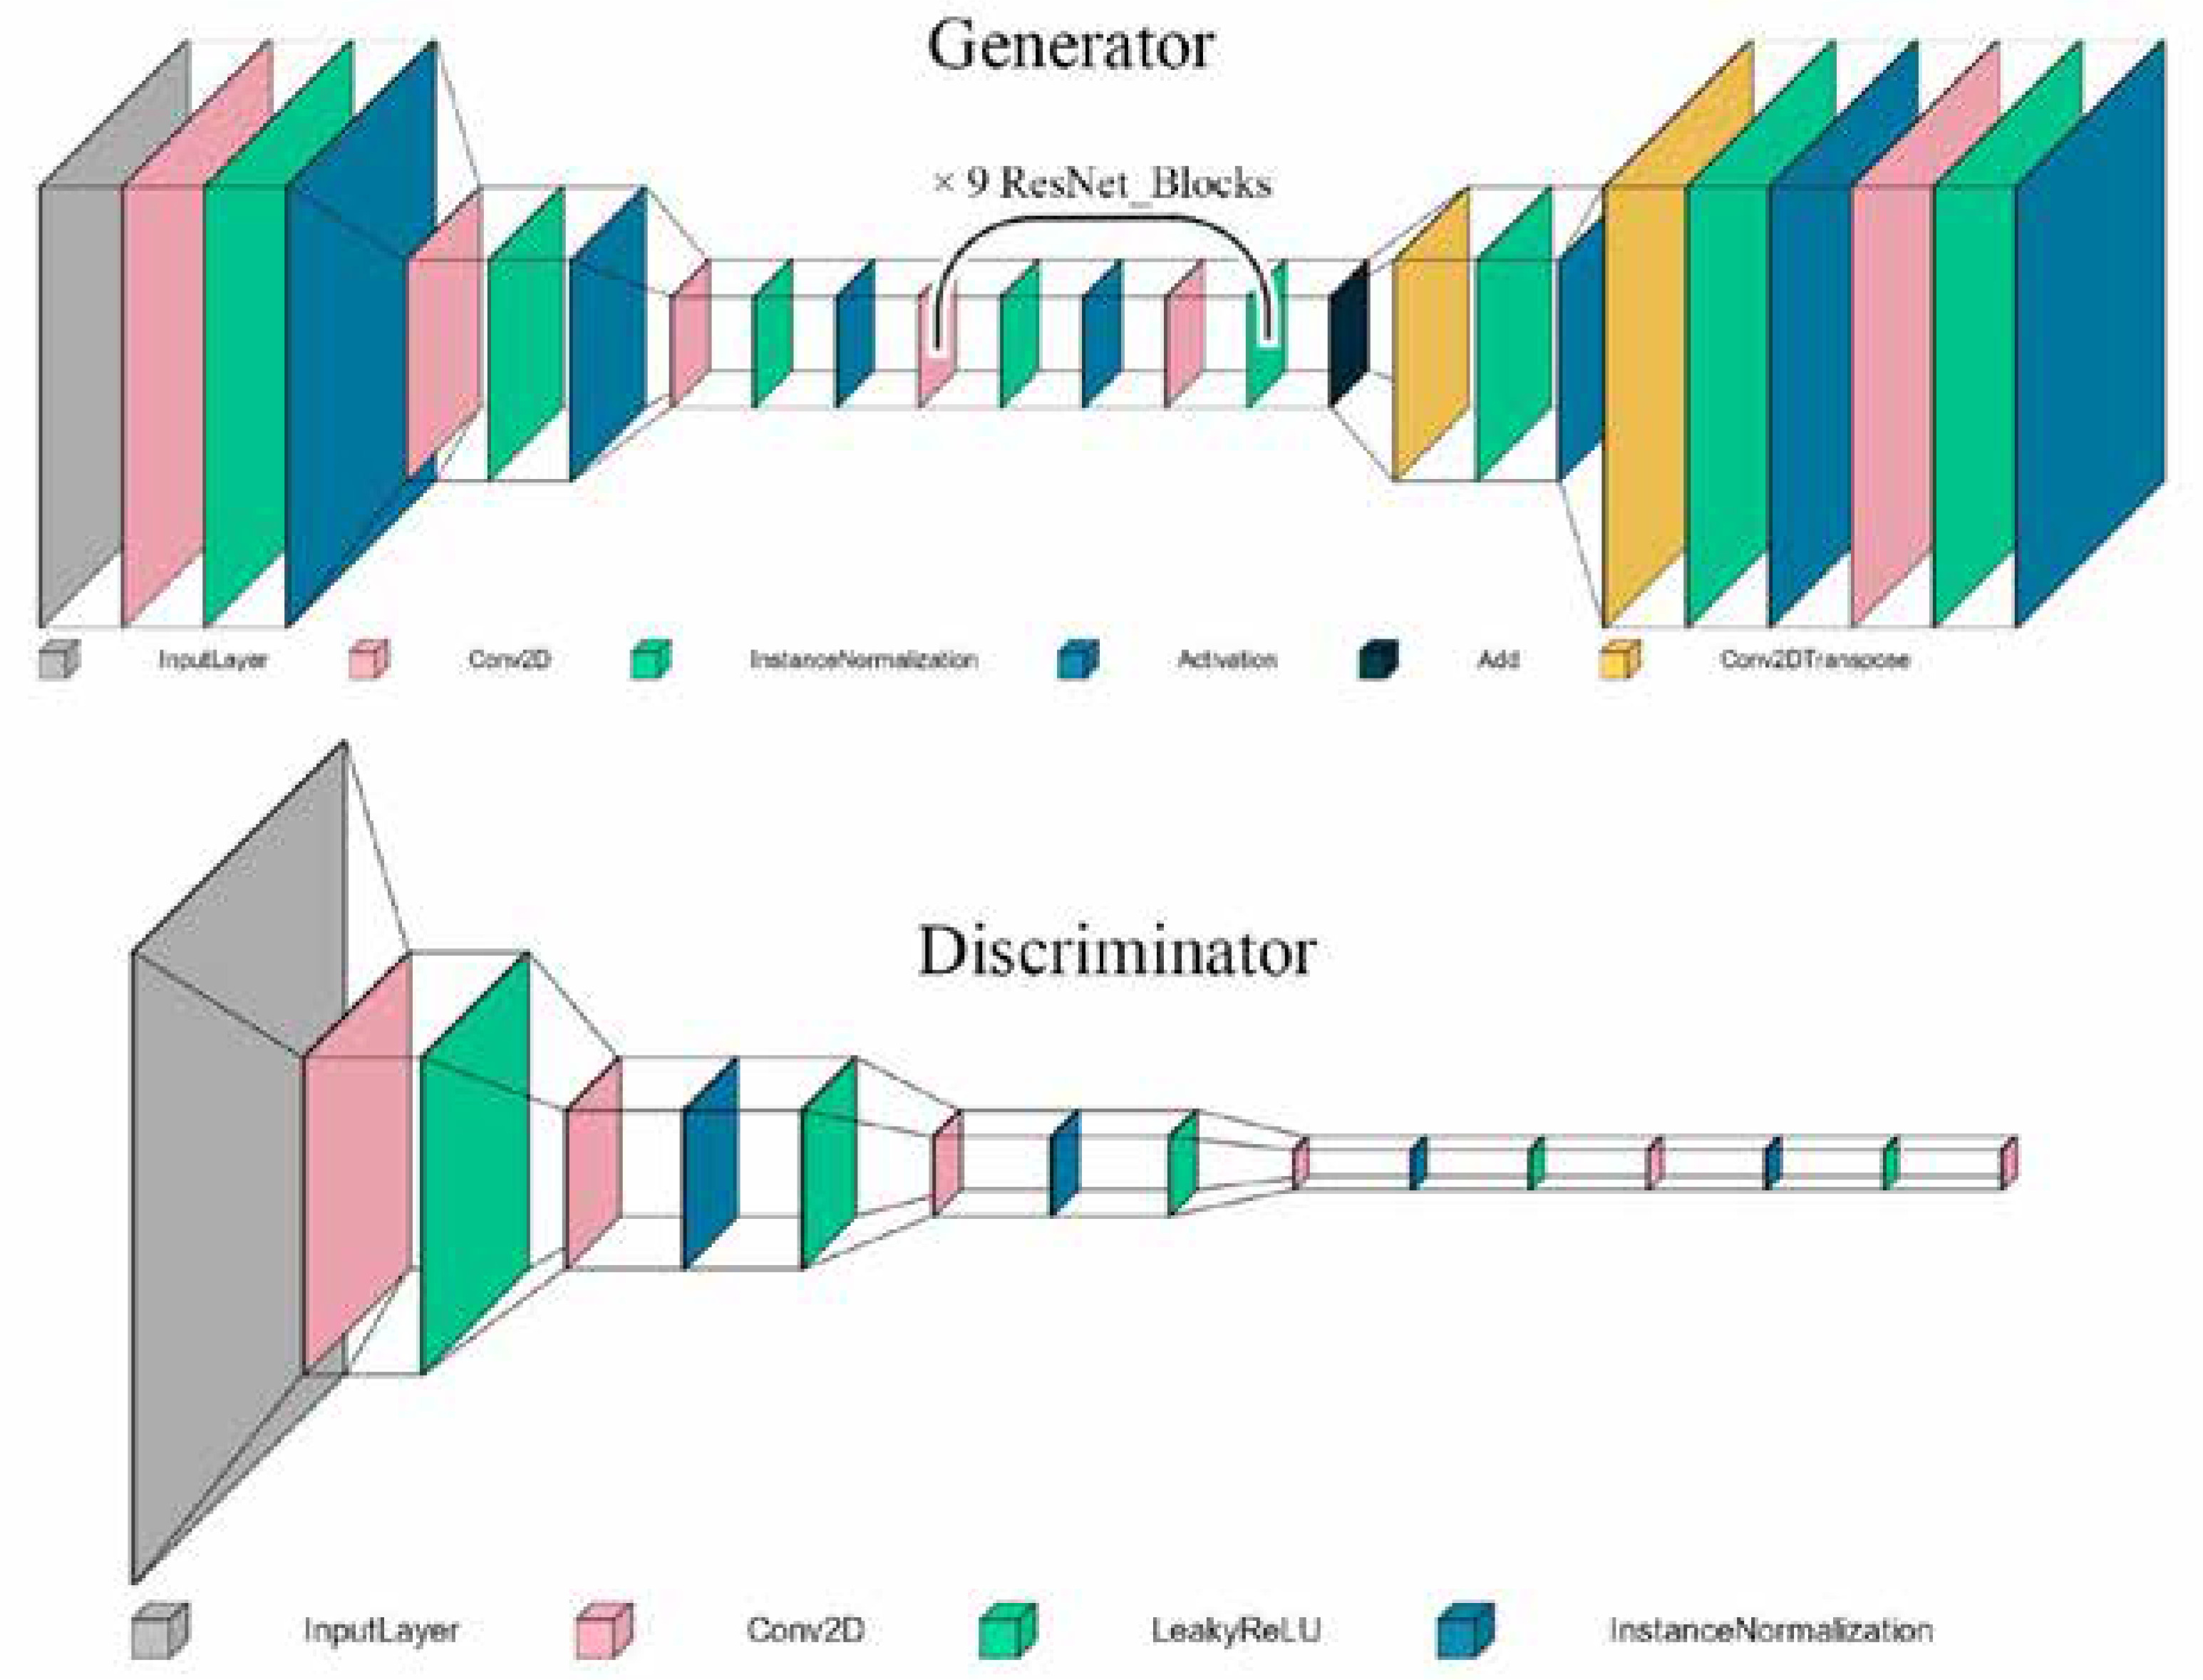
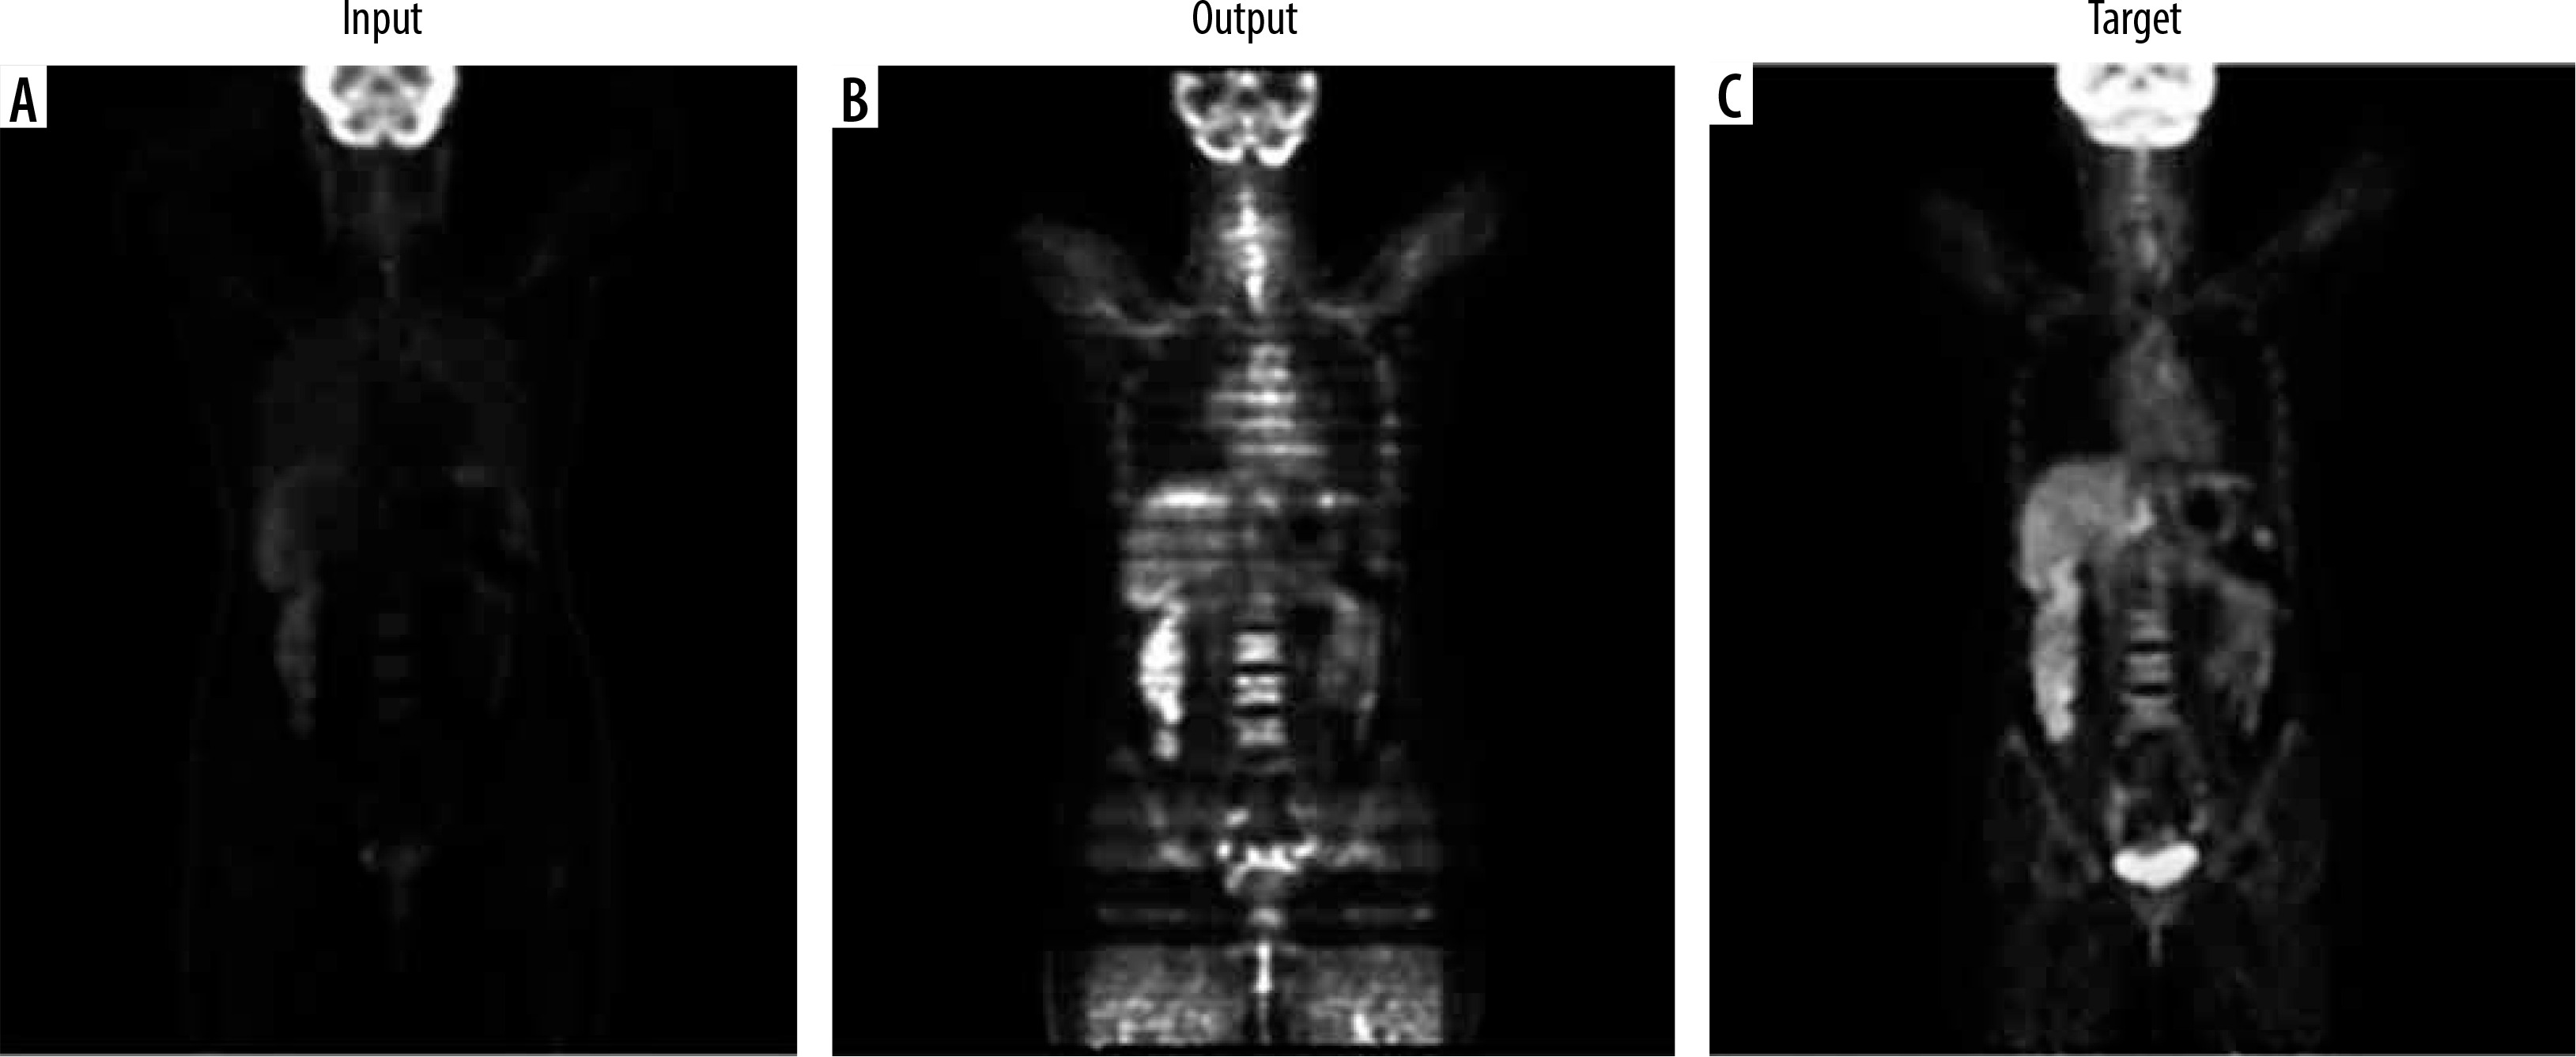
In this study, we evaluated the performance of several deep learning models for PET attenuation correction, focusing on their ability to generate synthetic CT images directly from PET data for the conditional GAN. Optimised hyperparameters included a generator learning rate of 0.0001, discriminator learning rate of 0.00005, and batch size of 1. However, this network suffered from convergence failure and overfitting issues, unable to generalise well to unseen test data despite reasonable training metrics (L1 loss 0.27 ± 0.06). The Wasserstein GAN experienced instability, with training runs failing between 1 and 3 epochs regardless of hyperparameter tuning attempts. This architecture proved unsuitable for this application. Figure 2 shows the visual results of conditional GAN and Wasserstein GAN networks.
Figure 2
Visual results of Conditional GAN and Wasserstein GAN networks for PET attenuation correction. A) Non-corrected image as network input. B) Attenuation-corrected image from network output. C) Target image from ground truth data
Among the various models tested, the CycleGAN demonstrated superior performance, both statistically and radiologically, in comparison to the other networks. So, we used it for 2 tasks: 1) correcting attenuation in PET images and 2) reconstructing CT images from non-attenuation corrected PET images. For PET attenuation correction, the cycleGAN provided the most promising results after extensive hyperparameter optimisation. The best performance utilized a 5 : 1 ratio of generator to discriminator learning rates (0.00025 and 0.00005, respectively) with a batch size of 1. After 17 epochs (74 hours 41 minutes), the trained network generated synthetic PET images visually similar to real attenuation-corrected PET images when tested on the test set. Figures 3 and 4 show example axial and coronal attenuation corrected PET images generated by the CycleGAN network.
Figure 3
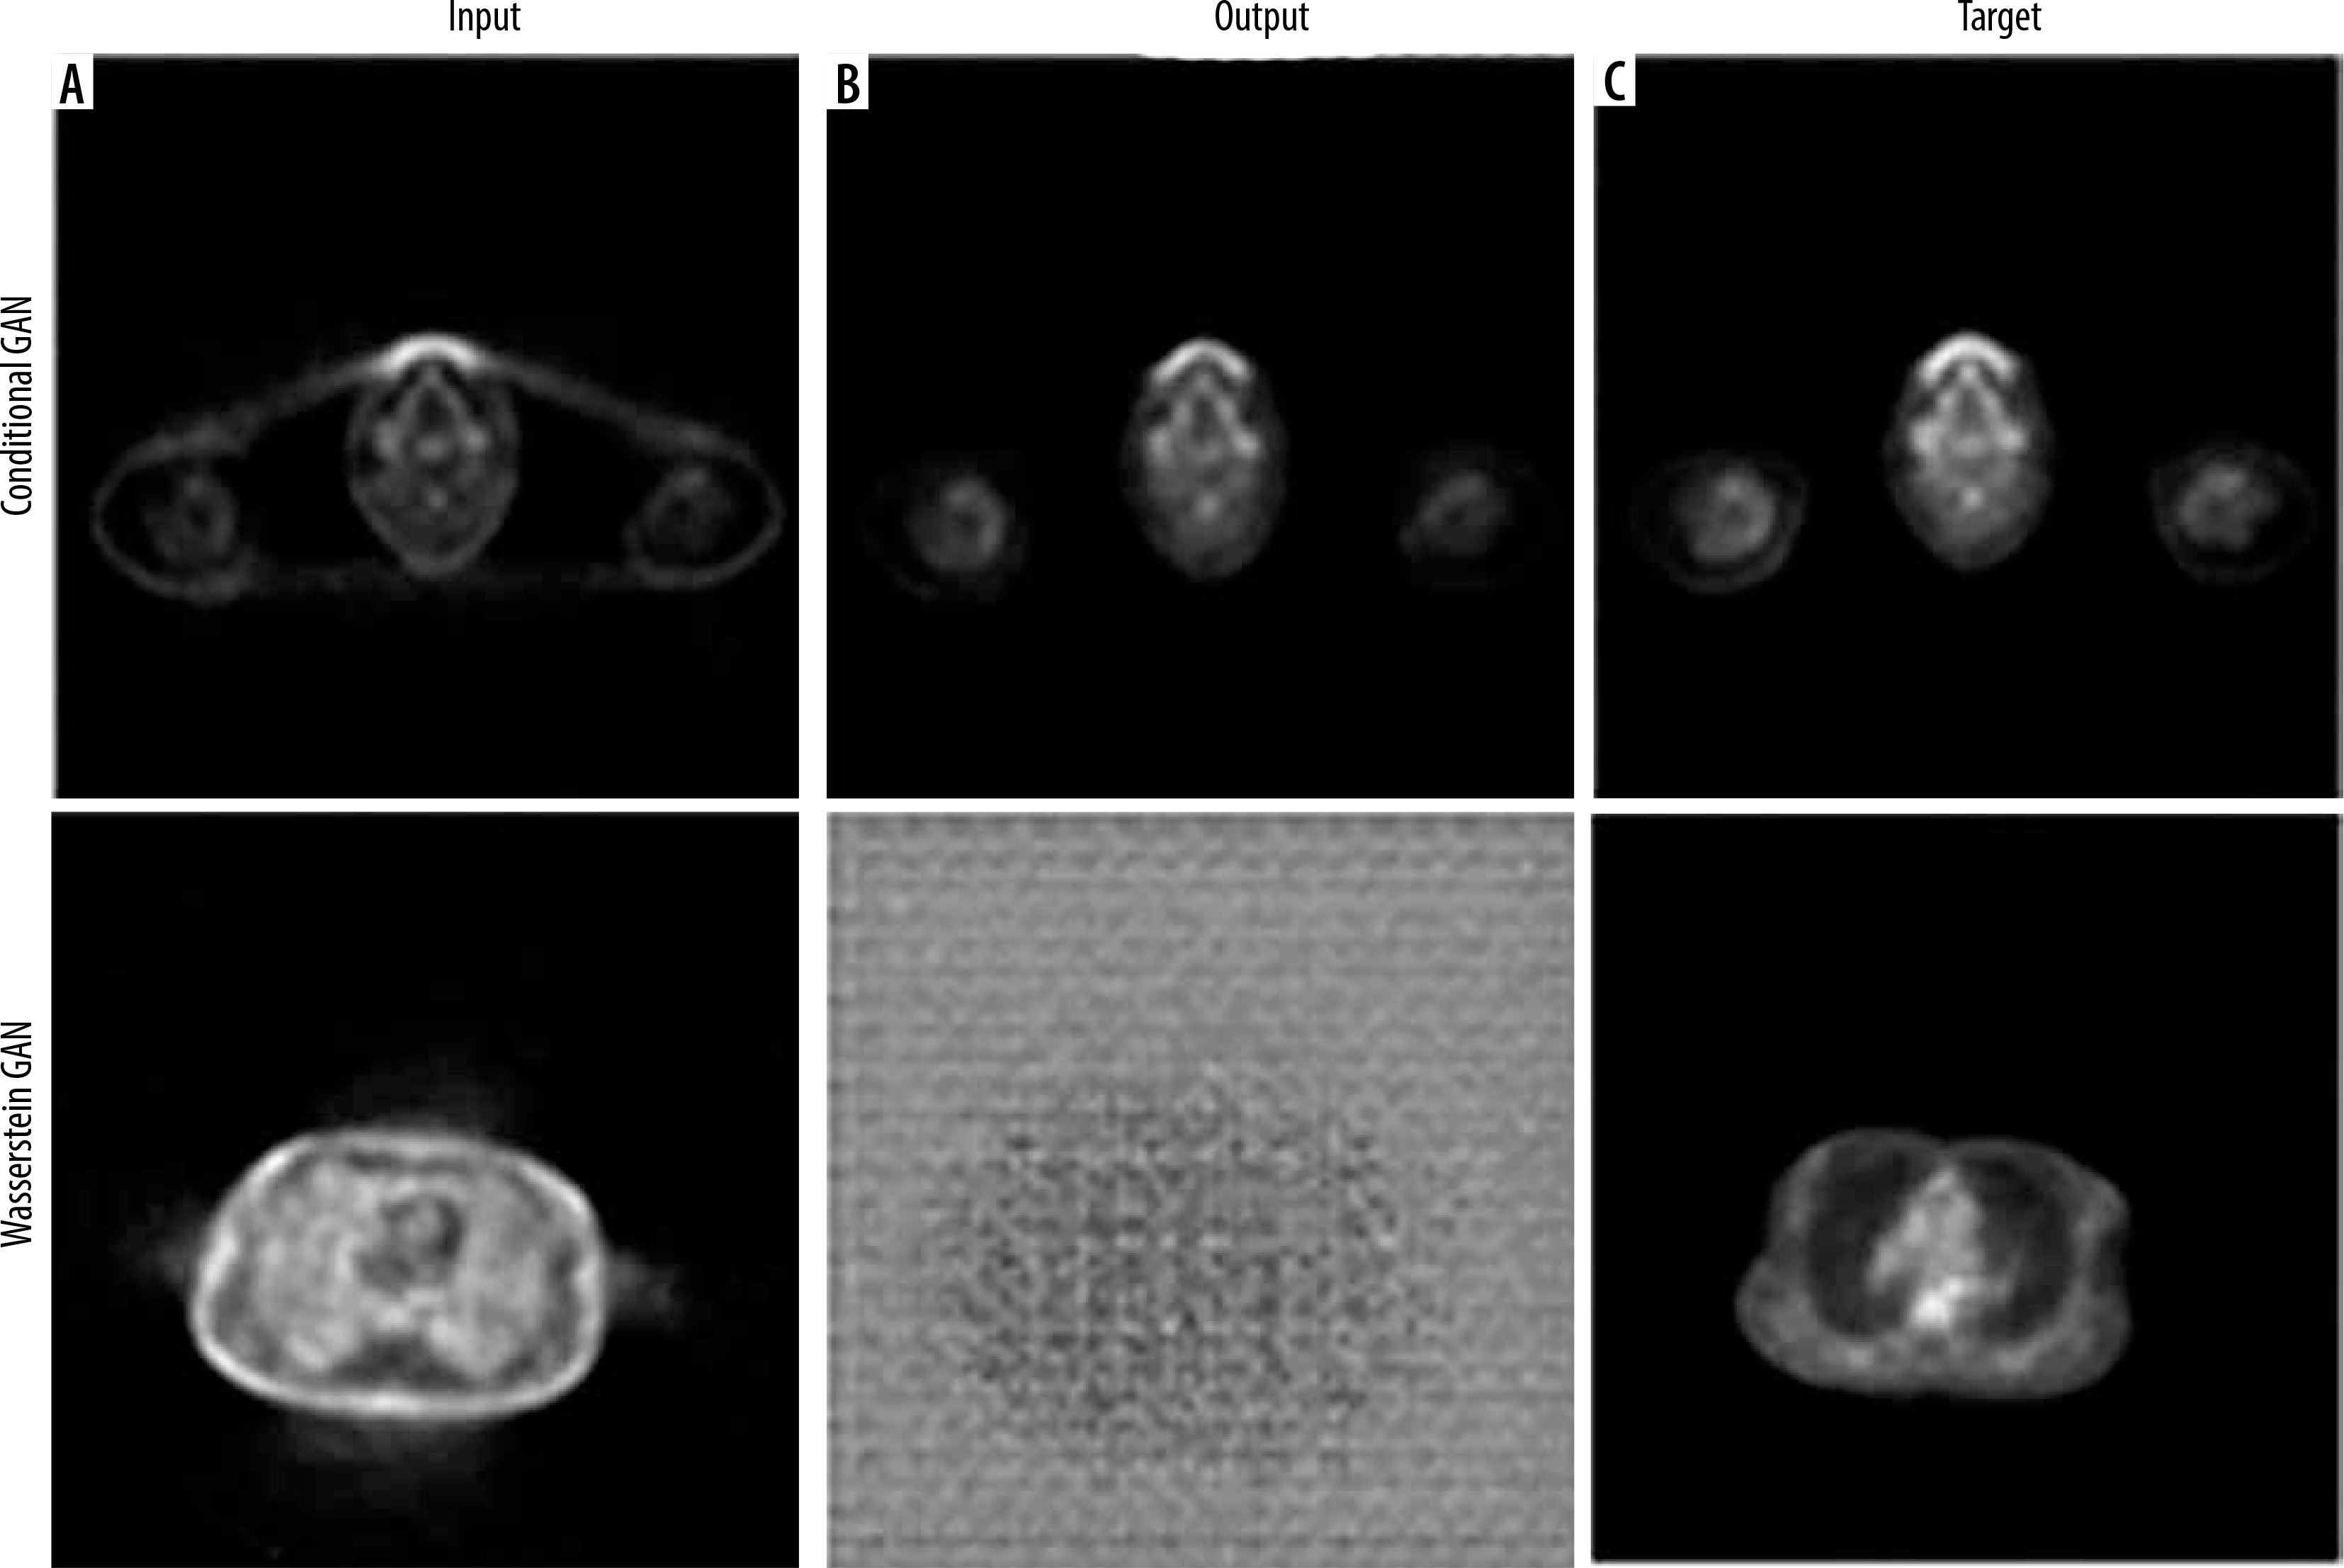
Axial images showing: A) the input non-corrected attenuation PET image, B) the attenuation-corrected output from the cycle GAN generator, C) the reconstructed primary PET image passed through the entire cycle GAN model from both generators, and D) the target ground truth PET image
Figure 4
Coronal images showing: A) the input non-corrected attenuation PET image, B) the attenuation corrected output from the cycle GAN generator, and C) the target ground truth PET image
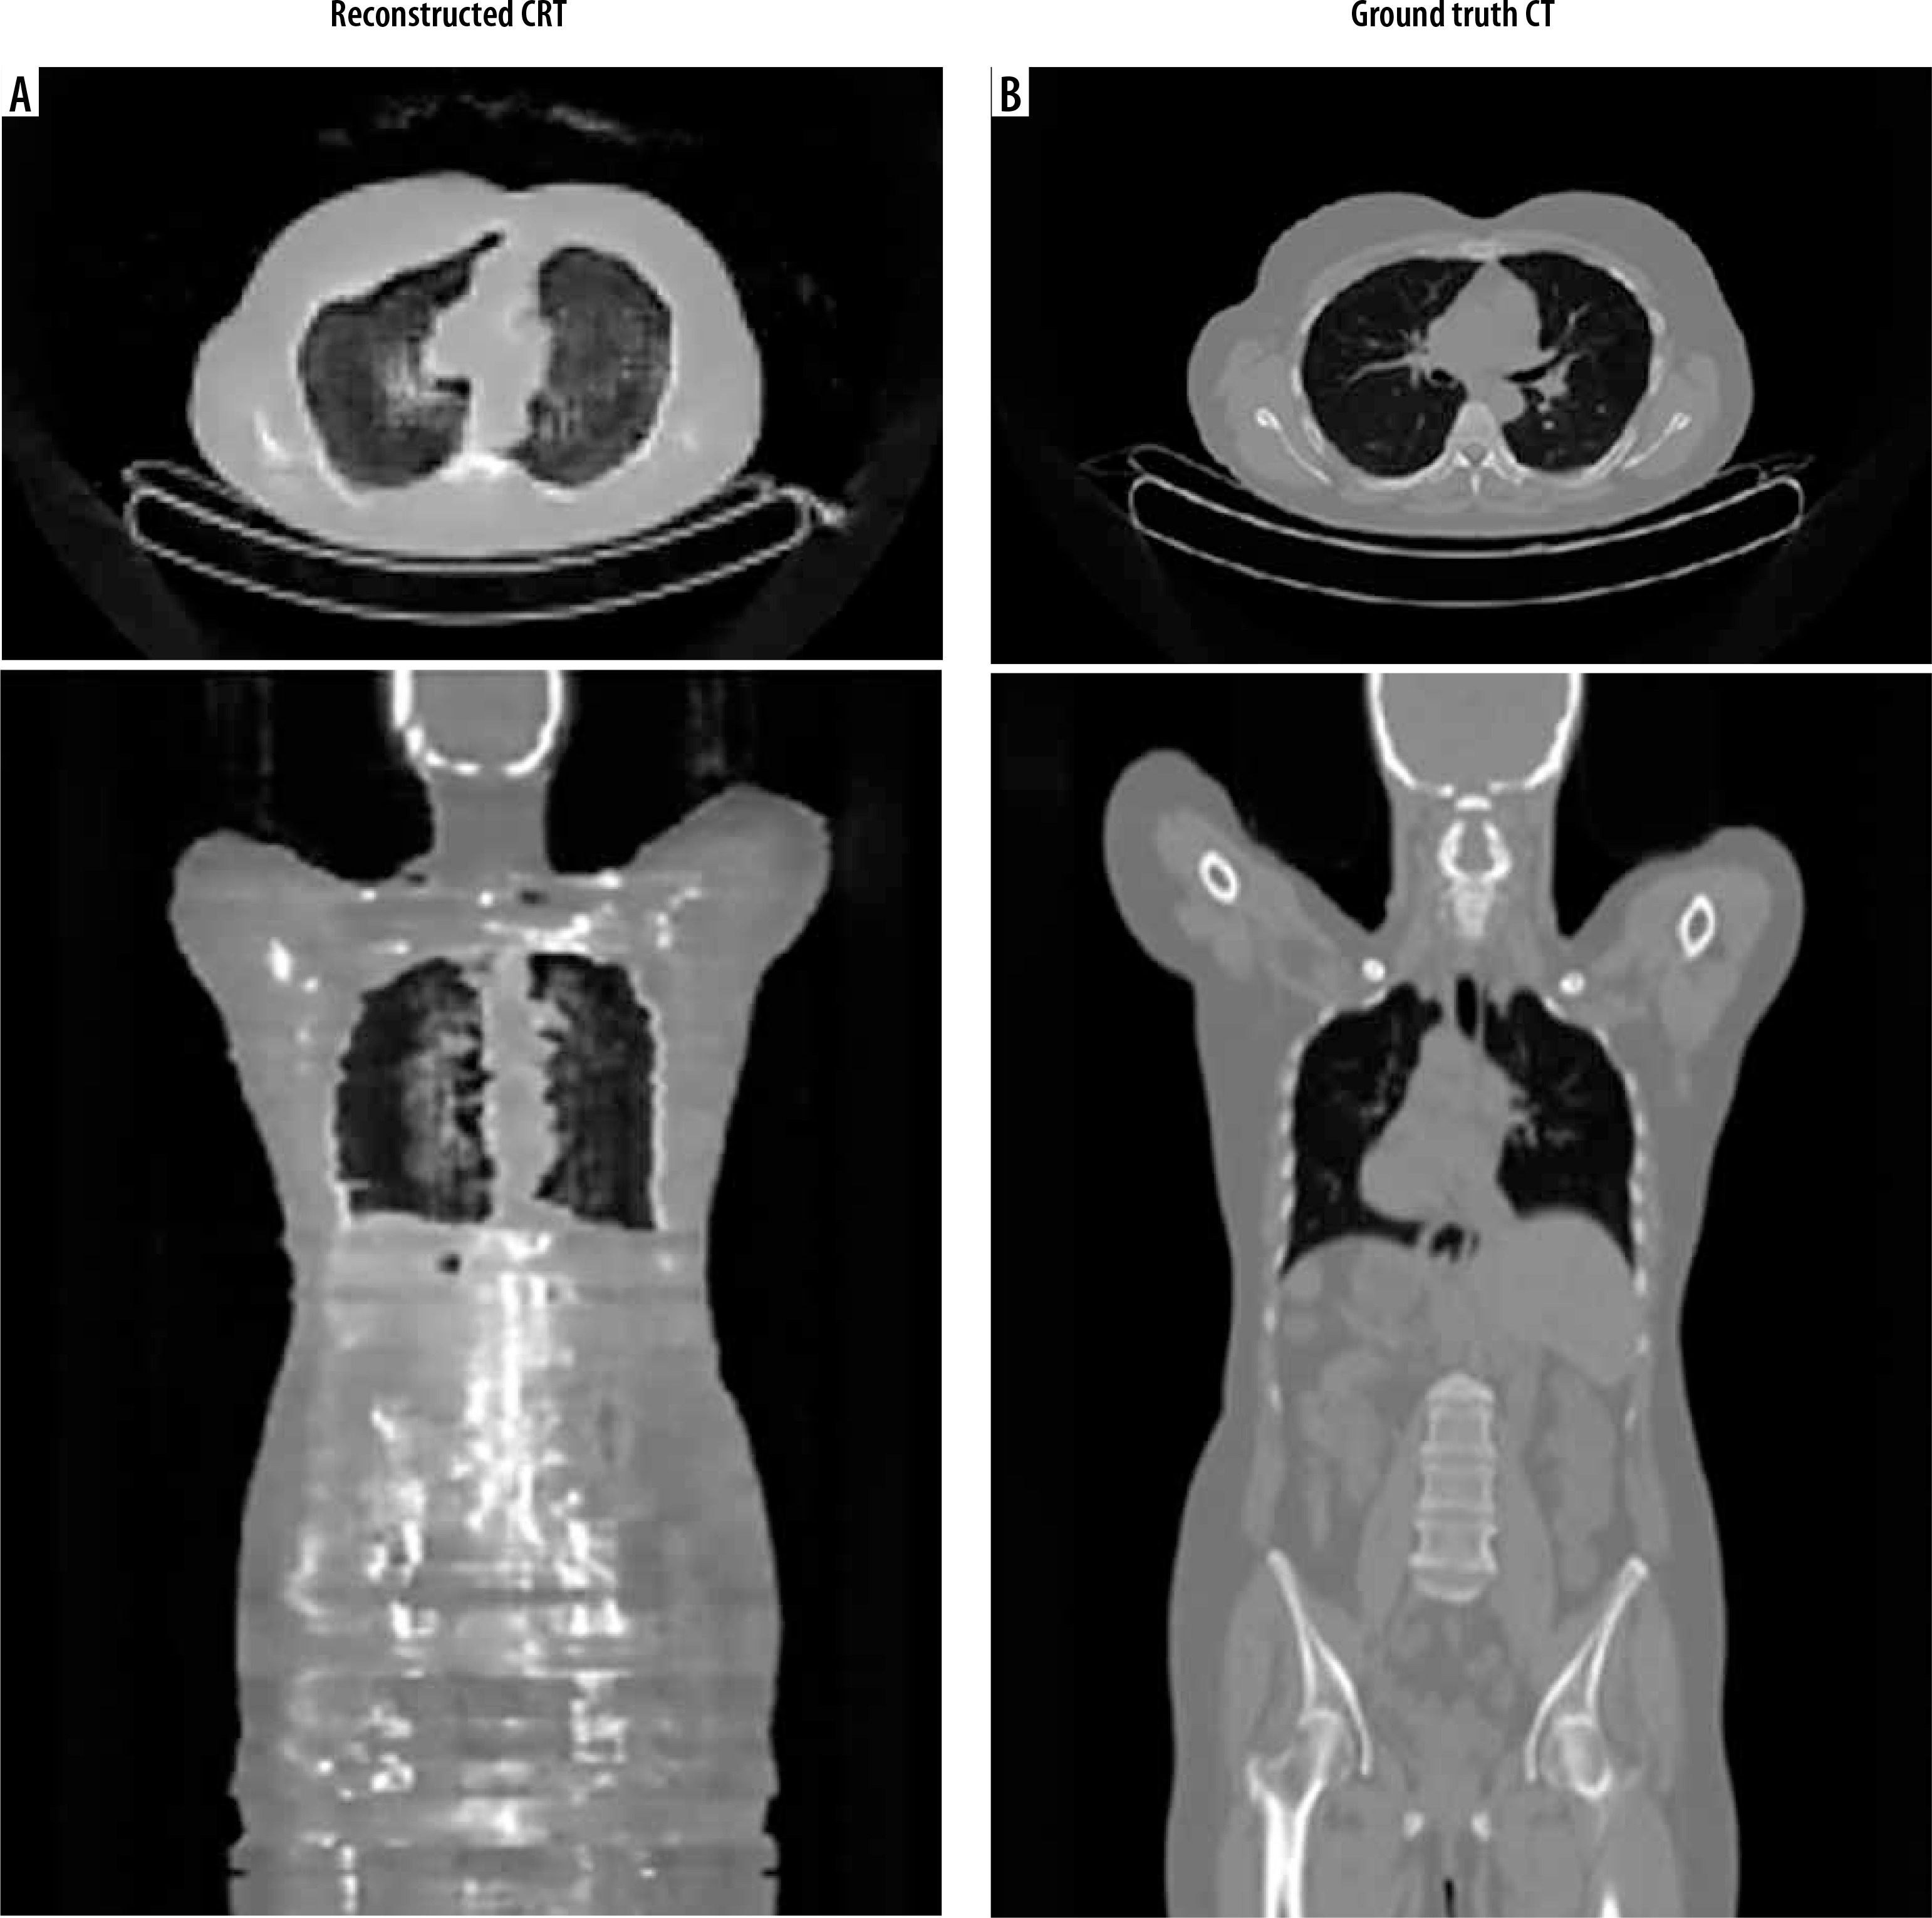
For CT reconstruction from non-attenuation-corrected PET images using the cycleGAN architecture, extensive hyperparameter tuning identified the optimal settings as a generator learning rate of 0.0001, discriminator learning rate of 0.00001, and batch size of 1. After training for 40 epochs, requiring 122 hours and 42 minutes, the network demonstrated the capability to generate reconstructed CT images from input non-attenuation-corrected PET data. While achieving reasonable overall image quality, the reconstructed CT images exhibited some difficulty precisely delineating bony structures compared to ground truth CT scans. Representative sample axial and coronal views of the network’s reconstructed CT outputs are provided, juxtaposed with the corresponding reference CT ground truth images (Figure 5).
Figure 5
Comparative axial and coronal images of reconstructed CT and ground truth. A) Pseudo-CT images reconstructed from the non-attenuation corrected PET input by the CycleGAN network. B) The expected ground truth CT images for comparison
The PET reconstruction accuracy was evaluated using MAE and MSE, calculated across 2293 PET images from 10 different scans. The mean absolute error for the PET images was (2.15 ± 0.34), reflecting a reasonable level of accuracy in the reconstructed images. The mean squared error was (3.14 ± 0.56). While this error is within acceptable limits compared to related studies, the observed increase in error from the training to the testing phase suggests potential overfitting, requiring further refinement of the network.
The CT image reconstruction performance was also evaluated using MAE and MSE. The mean absolute error for the CT images was (4.17 ± 0.96), indicating a relatively higher error rate than in PET reconstructions, which may reflect the complexity of generating CT images from PET data alone. The mean squared error was (5.66 ± 1.01), suggesting that the CT image generation process requires further model optimisation to reduce error and improve image quality. Radiological evaluation was performed by calculating the SUVmean and SUVmax in the segmented areas and the entire image in PET samples, as well as HU levels in the whole image and segmented areas in CT images. These calculations were statistically analysed using SPSS software and t-tests [29]. The results are presented in Table 1.
Table 1
Radiological examination results on attenuation-corrected synthetic images
The synthetic attenuation-corrected PET images generally exhibited higher SUV values compared to real images. Although this difference was not statistically significant for the whole body (p > 0.05), the elevated SUV in synthetic images suggests an increased likelihood of false positives. While the liver’s high metabolic activity could explain the higher SUV, synthetic images still presented a higher mean uptake in the liver. This difference was also not statistically significant. The lungs, with low tissue density and air saturation (particularly during breath-hold imaging), generally show lower radioactive uptake, a pattern observed in both synthetic and real images, with no significant statistical difference in mean SUV between these images. A closer examination of SUVmax shows intriguing patterns. In patients, SUVmax typically corresponds to regions affected by malignancy, and thus it is expected to be comparable across the whole body and malignant sites. While the whole-body SUVmax might occasionally register in the kidneys, ureters, or bladder due to radiotracer accumulation, no significant differences in maximum uptake between synthetic and real images were observed. A similar pattern was noted in the liver, a common site for ovarian cancer metastasis. The expected higher maximum uptake due to metastases was not statistically significant between real and synthetic liver images. However, the lungs displayed a significant difference in maximum uptake between real and synthetic images. Given that lungs are potential but late-stage metastasis sites for ovarian cancer, the observed correlation and high standard deviation in these values across both synthetic and real samples, with a small sample size and few lung metastasis cases, warrant further investigation with a larger sample size.
Radiological evaluation was also based on HU levels in the reconstructed CT images. This evaluation aimed to calculate the HU levels for the whole body, lungs, bone, and liver in real and synthetic images and compare the results statistically. Unfortunately, the reconstructed CT images did not have the necessary quality for contouring the liver and bone, as evident in the reconstructed coronal image. The results are presented in Table 2.
Table 2
Radiological examination results on pseudo-CT synthetic images
| HU mean test | HU mean real | p-value | |
|---|---|---|---|
| Whole body | 186.8 ± 14.9 | 168 ± 13.9 | 0.45 |
| Liver segmentation | – | 63.4 ± 7.61 | – |
| Lung segmentation | 73.1 ± –496.6 | 56.4 ± –439 | 0.23 |
| Bone segmentation | – | – | – |
In the reconstructed CT images, the lungs, as expected, showed negative HU levels due to air presence, and the statistical analysis between real and synthetic images showed no significant difference in lung HU levels. The same applies to the whole-body HU levels. The clear visual differences between reconstructed and real images, despite the closeness of the HU levels, suggest the inadequacy of this metric in assessing synthetic image accuracy.
Discussion
In recent years, there has been a tremendous increase in studies related to the applications of AI across different scientific disciplines, and radiology is no exception. From assisting in the diagnosis of potentially dangerous lesions to contouring and reproducing images, AI and deep learning have become vital tools in radiology, which, considering their high growth potential, will undoubtedly revolutionise this field [30,31]. Because of the PET scan’s strong metabolic imaging capabilities, it is now one of the best imaging techniques for detecting and tracking cancer. The number of PET scans conducted has increased recently due to the imaging method’s improved accessibility and lower costs [32]. Naturally, the surge in this imaging technique, coupled with advancements in AI, has motivated researchers to utilise AI to enhance various aspects of PET imaging [33,34]. One of the concerns for researchers and clinical staff is the high radiation exposure involved in this imaging technique. Each PET scan not only exposes the patient to radiation due to the need for a radioactive tracer but also doubles the radiation exposure with the simultaneous CT scan performed to evaluate the anatomical lesions and correct the attenuation in PET images. According to the ALARA principle, radiation exposure should be minimised to the necessary amount. This is especially important for patients with malignancies, who are likely to undergo repeated imaging and might receive high doses of radiation for radiotherapy. Thus, researchers have been seeking ways to reduce radiation exposure during PET/CT, and the emergence of advanced AI techniques is one of the solutions they have focused on. The attenuation correction process is typically done with anatomical imaging performed simultaneously with PET imaging.
In this study, 3 different network architectures were evaluated for the attenuation correction of PET images, to select and optimise an AI network for this process, and to evaluate the ability of such a network to produce pseudo-CT and eventually a complete PET/CT study using raw PET images. Although such a study is not unique in every aspect, it is necessary considering that no similar study has been conducted in Iran. Contrary to the study by Keisuke Matsubara et al. [15], which identified conditional GANs as effective and powerful in the reproduction of medical images, the conditional GAN in this study, although successful in producing high-quality attenuation-corrected images during training, was found to be ineffective on test data due to overfitting.
Similarly, contrary to the study by Hu et al. [24], the Wasserstein GAN, despite multiple confirmations of the correctness of the code and input data, failed to converge during training in this study’s dataset. This raises questions about the performance of the Wasserstein network and, given its high complexity and instability in training, suggests a need for structural adjustments and more precise hyperparameter tuning. Nevertheless, the strong theoretical performance of Wasserstein networks warrants further investigation in a new study. Among the networks tested in this study, only the cycle GAN successfully produced clinically acceptable images. The MAE and MSE values for the optimised network in the attenuation-corrected PET images were calculated as 0.34 ± 2.15 and 0.56 ± 3.14, respectively. Considering the pixel value range of 0 to 255 (256 levels), this indicates an accuracy of about 99%. Radiologic evaluations in terms of SUV showed no significant statistical differences between the real and synthetic images except for SUVmax in the lungs. The values obtained were significantly higher compared to studies by Fukui et al. [23] and Xiaofeng et al. [25]; however, the reconstructed PET images are not without flaws.
The designed network processes its input and output images in 2D slices of the body, resulting in error values based on comparing 2 transverse slices. However, examining the coronal reconstructions shows that despite high similarity in transverse slices, the coronal slices exhibit some SUV inhomogeneity. To address the challenge of ensuring homogeneity in medical imaging, 2 solutions are proposed. First, designing a 3D network would necessitate a larger dataset and more powerful hardware but could effectively eliminate the stair-step appearance between slices and ensure uniformity in all 3 dimensions. Second, standardising the SUV based on each slice involves initially training the network to recognise the general body area of the input image and then adjusting the brightness according to the average normal SUV for that specific region. Although this method theoretically could alter medical data, it remains a viable approach because most medical images exhibit minimal deviations from normal samples. This strategy can help distribute the SUV more reasonably across images, addressing issues such as false increases in uptake in certain areas, like the cervical vertebrae, and decreased uptake in regions like the brain. The reconstruction of CT scan images and the production of pseudo-CT were also tested in this study, which was more challenging than attenuation-corrected images. Training the optimised cycle GAN for this purpose was less stable than for attenuation correction, and even under optimal conditions, the accuracy of CT image reproduction still needed improvement. Nevertheless, the statistical analysis of this network showed MAE and MSE values of 0.96 ± 4.17 and 1.01 ± 5.66, respectively (equivalent to about 2% error, considering a 256-unit pixel range), slightly higher than the study by Fang Liu et al. [19]; however, their study focused solely on head and neck reconstruction. There was no significant radiologic difference in HU levels for the whole body and lungs. Nonetheless, the reconstructed images were average for internal organs such as the liver, intestines, muscles, and especially bones. To address the issue, 2 solutions are suggested. First, using organ-specific networks involves training and optimising a network separately for each body area, which can reduce the training load, enhance flexibility in hyperparameter tuning, and allow for the use of larger training datasets. Second, incorporating a contouring network addresses the challenge of bone reconstruction in producing pseudo-CT images by overlaying pre-prepared CT images on PET images to contour hypothetical bone areas. The resulting image serves as a secondary condition during the training phase, alongside the uncorrected PET image, thereby improving the accuracy and quality of the reconstructed images.
Overall, as stated in the study by Sadaghiani et al. [16], although the results of these networks hold a bright future, they still need qualitative improvements and further study before clinical application. Positive statistical and radiologic results, while encouraging, cannot replace the accurate clinical appearance. It is clear that despite the astonishing advancements in AI, its application in clinical fields, given the high sensitivity of this area, is only possible after ensuring precise performance and patient safety. It should be noted that alongside the provided suggestions, increasing the number and diversity of training data, access to more powerful hardware systems for diversifying hyperparameter tests, access to higher-quality images from stronger imaging devices, and testing other networks and architectures can significantly enhance the quality and accuracy of output images and pave the way for their clinical use.
Conclusions
This study highlights the successes and challenges of utilising various AI network architectures in attenuation correction in PET-CT. Based on the results, cycle GAN was shown to be effective in producing clinically acceptable images; however, several problems remain, such as inhomogeneities and low accuracy in certain organ reconstructions, suggest that there is a need for improvement. Further studies should be performed with stronger computational resources, increased data variability, 3D imaging network inspection, and the development of organ-specific models to improve the robustness and clinical relevance of AI-driven PET imaging solutions. These efforts will ultimately lead to more accurate diagnosis tools with fewer risks in medical imaging.
Disclosures
Institutional review board statement: Not applicable.
Assistance with the article: None.
Financial support and sponsorship: This work was supported by the International Atomic Energy Agency (IAEA) under the coordinated research project (CRP) E13050 – the International Multicentre Trial on FDG PET/CT in Ovarian Cancer (POCA).
Conflicts of interest: None.