GASTROINTESTINAL AND ABDOMINAL RADIOLOGY / ORIGINAL PAPER
Association of liver function with hepatic and renal parenchymal signal intensities during the hepatobiliary phase of Gd-EOB-DTPA-enhanced MRI
1
Department of Radiology, The Second Affiliated Hospital of Kunming Medical University, Kunming, Yunnan Province, China
These authors had equal contribution to this work
Submission date: 2026-01-08
Final revision date: 2026-02-28
Acceptance date: 2026-03-03
Publication date: 2026-09-29
Corresponding author
Li Guo
The Second Affiliated Hospital of Kunming Medical University, Kunming, Yunnan Province, China
The Second Affiliated Hospital of Kunming Medical University, Kunming, Yunnan Province, China
Pol J Radiol, 2026; 91(1): 469-477
KEYWORDS
gadoxetic acid disodium (Gd-EOB-DTPA)renal cortex and medullasignal intensity parametershepatic functionhepatobiliary phase
TOPICS
ABSTRACT
Purpose:
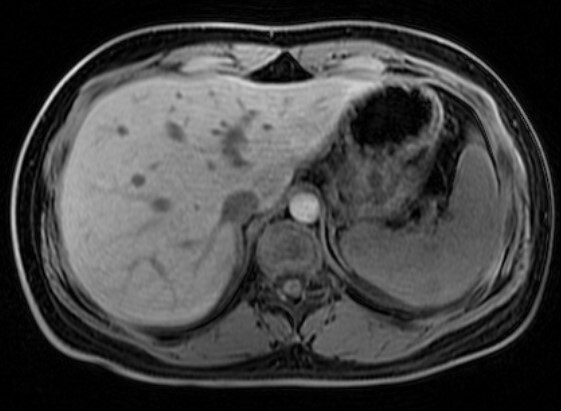
To investigate the association between hepatic function and liver and renal parenchymal signal intensities (SI) during the hepatobiliary phase of gadoxetic acid (Gd-EOB-DTPA)-enhanced magnetic resonance imaging (MRI), and to provide imaging evidence for the combined evaluation of hepatic and renal function in cirrhotic patients.
Material and methods:
Seventy-eight patients who underwent Gd-EOB-DTPA-enhanced MRI were retrospectively enrolled and divided into a normal control group (n = 28), Child-Pugh grade A group (n = 25), grade B group (n = 17), and grade C group (n = 8). Pre-enhancement SI of the liver and renal cortex/medulla (SIliver-pre, SIcortex-pre, SImedulla-pre) and post-enhancement SI (SIliver-post, SIcortex-post, SImedulla-post) were measured. The signal intensity differences between the renal cortex and medulla (SI[cortex-medulla]pre and SI[cortex-medulla]post) were calculated. Relative enhancement rates (RE) were calculated. One-way analysis of variance (ANOVA), Kruskal-Wallis, and Mann-Whitney U tests were used to compare signal intensity parameters among the normal liver function group and different Child-Pugh grade groups (A, B, C).
Results:
As the Child-Pugh grade increased, SIliver-pre, SIliver-post, and REliver showed statistically significant differences (p < 0.05). SIcortex-pre and SIcortex-post exhibited significant differences in subgroup comparisons (p < 0.05), but REcortex showed no statistical significance (p = 0.859). Pre- and post-enhancement renal medullary signals and SI[cortex-medulla] differences showed no significant variations across all groups (p > 0.05).
Conclusions:
Hepatic dysfunction was associated with lower hepatic signal intensity and enhancement in the hepatobiliary phase. Significant differences were observed in the renal cortical signal intensity before and after contrast administration, whereas the renal medullary signals and corticomedullary signal differences showed no significant variation.
To investigate the association between hepatic function and liver and renal parenchymal signal intensities (SI) during the hepatobiliary phase of gadoxetic acid (Gd-EOB-DTPA)-enhanced magnetic resonance imaging (MRI), and to provide imaging evidence for the combined evaluation of hepatic and renal function in cirrhotic patients.
Material and methods:
Seventy-eight patients who underwent Gd-EOB-DTPA-enhanced MRI were retrospectively enrolled and divided into a normal control group (n = 28), Child-Pugh grade A group (n = 25), grade B group (n = 17), and grade C group (n = 8). Pre-enhancement SI of the liver and renal cortex/medulla (SIliver-pre, SIcortex-pre, SImedulla-pre) and post-enhancement SI (SIliver-post, SIcortex-post, SImedulla-post) were measured. The signal intensity differences between the renal cortex and medulla (SI[cortex-medulla]pre and SI[cortex-medulla]post) were calculated. Relative enhancement rates (RE) were calculated. One-way analysis of variance (ANOVA), Kruskal-Wallis, and Mann-Whitney U tests were used to compare signal intensity parameters among the normal liver function group and different Child-Pugh grade groups (A, B, C).
Results:
As the Child-Pugh grade increased, SIliver-pre, SIliver-post, and REliver showed statistically significant differences (p < 0.05). SIcortex-pre and SIcortex-post exhibited significant differences in subgroup comparisons (p < 0.05), but REcortex showed no statistical significance (p = 0.859). Pre- and post-enhancement renal medullary signals and SI[cortex-medulla] differences showed no significant variations across all groups (p > 0.05).
Conclusions:
Hepatic dysfunction was associated with lower hepatic signal intensity and enhancement in the hepatobiliary phase. Significant differences were observed in the renal cortical signal intensity before and after contrast administration, whereas the renal medullary signals and corticomedullary signal differences showed no significant variation.
REFERENCES (17)
1.
Chen GY, Li ZL. Application of diffusion-weighted imaging and hepatobiliary-specific contrast agent Gd-EOB-DTPA in the diagnosis and differential diagnosis of focal liver lesions. Sichuan Da Xue Xue Bao Yi Xue Ban 2022; 53: 737-743.
2.
Haimerl M, Verloh N, Zeman F, Fellner C, Nickel D, Lang SA, et al. Gd-EOB-DTPA-enhanced MRI for evaluation of liver function: Comparison between signal-intensity-based indices and T1 relaxometry. Sci Rep 2017; 7: 43347. DOI: 10.1038/srep43347.
3.
Ding Y, Rao S, Yang L, Chen C, Zeng M. Comparison of the effect of region-of-interest methods using gadoxetic acid-enhanced MR imaging with diffusion-weighted imaging on staging hepatic fibrosis. Radiol Med 2016; 121: 821-827.
4.
Yuan X, Wang S, Shi W, Cai Y, Chen Y, Chen M, et al. Dual plasma sampling method to determine the hepatic and renal clearance of the 2 diastereoisomers of Gd-EOB-DTPA. Invest Radiol 2020; 55: 168-173.
6.
Rockey DC, Bell PD, Hill JA. Fibrosis – a common pathway to organ injury and failure. N Engl J Med 2015; 372: 1138-1149.
7.
Zhang W, Wang X, Miao Y, Hu C, Zhao W. Liver function correlates with liver-to-portal vein contrast ratio during the hepatobiliary phase with Gd-EOB-DTPA-enhanced MR at 3 Tesla. Abdom Radiol (NY) 2018; 43: 2262-2269.
8.
Murakami T, Sofue K, Hori M. Diagnosis of hepatocellular carcinoma using Gd-EOB-DTPA MR imaging. Magn Reson Med Sci 2022; 21: 168-181.
9.
Pan S, Wang L, Xin J. Combining (18)F-FDG PET and Gd-EOB-DTPA-enhanced MRI for staging liver fibrosis. Life Sci 2021; 269: 119086. DOI: 10.1016/j.lfs.2021.119086.
10.
Kirchin MA, Lorusso V, Pirovano G. Compensatory biliary and urinary excretion of gadobenate ion after administration of gadobenate dimeglumine (MultiHance(®)) in cases of impaired hepatic or renal function: a mechanism that may aid in the prevention of nephrogenic systemic fibrosis? Br J Radiol 2015; 88: 20140526. DOI: 10.1259/bjr.20140526.
11.
Kothari R, Khanna D, Kar P. To evaluate the prevalence of spontaneous portosystemic shunts in decompensated cirrhosis patients and its prognostic significance. Indian J Gastroenterol 2023; 42: 677-685.
12.
Reiss AB, Jacob B, Zubair A, Srivastava A, Johnson M, De Leon J. Fibrosis in chronic kidney disease: pathophysiology and therapeutic targets. J Clin Med 2024; 13: 1881. DOI: 10.3390/jcm13071881.
13.
Chen R, Liu D, Zhao H, Wang X. Renal medullary perfusion differs from that in renal cortex in patients with sepsis associated acute kidney injury and correlates with renal function prognosis: a prospective cohort study. Clin Hemorheol Microcirc 2024; 88: 181-198.
14.
Castelein J, Pamplona C, Armstrong R Jr, Vidal Dos Santos M, Sack I, Dierckx R, et al. Effects of kidney perfusion on renal stiffness and tissue fluidity measured with tomoelastography in an MRI-compatible ex vivo model. Front Bioeng Biotechnol 2023; 11: 1236949. DOI: 10.3389/fbioe.2023.1236949.
15.
Tan CH, Venkatesh SK. Magnetic resonance elastography and other magnetic resonance imaging techniques in chronic liver disease: current status and future directions. Gut Liver 2016; 10: 672-686.
16.
Choi Y, Huh J, Woo D, Kim KW. Use of gadoxetate disodium for functional MRI based on its unique molecular mechanism. Br J Radiol 2016; 89: 20150666. DOI: 10.1259/bjr.20150666.
17.
Li X, Ai G, Qiao X, Chen W, Fan Q, Wang Y, et al. Radiomic analysis using T1 mapping in gadoxetic acid disodium-enhanced MRI for liver function assessment. BMC Med Imaging 2025; 25: 111. DOI: 10.1186/s12880-025-01658-5.
| ISSN: | 1899-0967 |

We process personal data collected when visiting the website. The function of obtaining information about users and their behavior is carried out by voluntarily entered information in forms and saving cookies in end devices. Data, including cookies, are used to provide services, improve the user experience and to analyze the traffic in accordance with the Privacy policy. Data are also collected and processed by Google Analytics tool (more).
You can change cookies settings in your browser. Restricted use of cookies in the browser configuration may affect some functionalities of the website.
You can change cookies settings in your browser. Restricted use of cookies in the browser configuration may affect some functionalities of the website.