Introduction
The central pattern or rhythm generator (CPG) of chewing leads to specific or rhythmic motor actions for chewing or mastication. According to the literature, the CPG for chewing lies in the medial bulbar reticular formation between the motor root of the trigeminal nerve and the inferior olive [1]. The chewing CPG induces an inhibition in the jaw closer to motor neurons simultaneously with excitation in the jaw openers during the opening phase of chewing. It then induces excitation in the closer motor neurons during the jaw-closing phase [2]. Although the CPG sets the basic rhythm for chewing and alternately activates the openers and closers, control of mastication is largely dependent upon sensory feedback [3]. This interdependence indicates the importance of both the CPG and feedback from receptors in forming the neurological basis of the central motor command for mastication [4].
Although it is known that rhythmic jaw movement is present in anencephalic human infants, the existence of a chewing or masticatory CPG in human subjects has not been explicitly shown but rather has been hypothesized based on various pieces of circumstantial evidence, such as the existence of sucking reflex in the infant, observation of phase-dependent modulation of mastication, the existence of high-frequency oscillations in the jaw muscle electromyogram, and the interaction among mastication, respiration, and swallowing [5-8]. Using positron emission tomography (PET), it has been shown that a simple masticatory action such as gum chewing increases the heart rate and brain blood flow [9]. However, PET has low spatial and temporal resolution, and hence it is hard to record actual brain activation during mastication and to identify brain regions activated during mastication. To overcome these limitations, functional magnetic resonance imaging (fMRI) has been commonly used [10]. While subjects chewed gums in an fMRI unit, Onozuka et al. found that gum-chewing is associated with significant increases in the activity of various brain regions [11]. They mainly observed a bilateral increase in the primary sensorimotor cortex, the supplementary motor area, the thalamus, and the cerebellum. Going a step further, Quintero et al. examined functional connections of brain regions during chewing [12]. They identified functional central networks engaged during mastication. For example, sensorimotor cortices were activated during the control of orofacial movements such as chewing. They have also shown that both left and right motor cortices were reciprocally and functionally connected with the post-central gyrus, cerebellum, cingulate cortex, and precuneus.
Other than the studies above, the location of CPG and its connections have not been comprehensively illustrated using modern imaging techniques. In the current study, we aimed to fill this important gap and determine the localization and connections of the chewing centre(s) to other centres in the brain using the in vivo fMRI technique. Accordingly, the experimental design was oriented to illustrate the centres and connections that play a critical role in chewing and vitality. Identification of these critical areas and connections through a non-invasive neuroimaging technique is an important step because it would be easier to diagnose and treat mastication and swallowing disorders. To achieve this aim, we designed 4 tasks and tested 3 hypotheses. The motor tasks and associated hypo-theses are as follows:
Spontaneous chewing (SPONC), in which subjects were instructed to chew sugarless gum naturally. It was hypothesized that the central rhythm generator would be activated during this task.
Structured or controlled chewing (CONC), in which subjects were instructed that they would open and close their jaws consciously and slowly (approximately 40 jaw movements in a minute). This task was performed to identify the areas underlying motor and sensory activities during jaw movements. It was hypothesized that the areas responsible for the pattern generation would not be activated because these movements were not rhythmic or natural.
Rosary-bead pulling movements (RPM), in which subjects were instructed to pull beads naturally and rhythmically. It was hypothesized that the area responsible for mastication would not be activated during this rhythmic task since the mastication pattern generator is uniquely responsible for mastication and not for other rhythmic tasks.
Resting state, in which subjects were instructed to relax and rest with their eyes softly closed.
Material and methods
Sixty volunteers enrolled in the study. Thirteen subjects with motion artifacts were excluded from the analysis. In 8 cases, fMRI data acquisitions could not be completed because they could not optimally tolerate the total acquisition time of fMRI. The images taken from 7 subjects were excluded from the study because of technical reasons such as wrong alignment or slice positioning. As a result, 32 cases (11 males and 20 females between the ages of 18 and 50, mean/median age: 26/23) were included in the study. All subjects were right-handed. They were informed before the study, and consent was obtained from each subject. Before MR acquisition, they were also instructed about motor tasks. Also, the tasks to be performed during the experiment were given with audio notifications. Therefore, they were asked to keep their eyes closed during the experiment. All procedures complied with the international guidelines and were approved by the local Ethics Committee.
Data acquisition
MR images were collected on a 3-Tesla Trio MR scanner (Siemens Healthcare, Erlangen, Germany) with a 32-channel dedicated birdcage head coil. After the acquisition of localizer images, isotropic 3D-T1W data were obtained for anatomic evaluations. All the sequences covered the brain, brain stem, cerebellum, and motor cortex. The total acquisition time for each fMRI exam was approximately 36 minutes. The details of the sequences are summarized in Table 1.
Table 1
The parameters of the 3-Tesla MRI sequences
Tasks
To determine the locations of the chewing-related areas and rhythm generator, we used natural chewing of sugarless gum (Task 1). To make sure that this centre is uniquely responsible for mastication, our protocol included an additional rhythmic activity – rosary bead pulling – as a control condition (Task 2). We also asked the subjects to perform controlled jaw movements to identify other sensory and motor areas involved in mastication (Task 3). Finally, resting-state functional data were acquired to compare the activations during these motor tasks with the resting-state (Task 4).
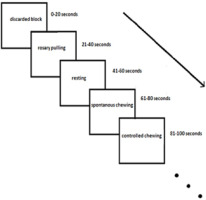
The paradigm of this study was block-designed. Each block consisted of 5 TRs. There were 18 blocks in each session, which took a total of 360 s. Each subject completed 5 functional sessions. In each session, 4 different tasks were performed in random order: 1) five spontaneous gum-chewing blocks, 2) four pulling rosaries, 3) four controlled gum–chewing blocks, and 4) four resting blocks were performed randomly by the subjects (Figure 1). The commands of the tasks were presented verbally at the beginning of each task in about 2 s. The first block was discarded because of haemodynamic stability. Compared to other tasks, spontaneous chewing had one more block due to a high probability of loss of data caused by movement artifacts during spontaneous chewing. Thus, the possibility of tolerance was gained against the loss of data.
In a block design, HRF is convolved with box-car function with block duration (for our study, 20 s). Slice timing is performed to prevent the occurrence of signal change related to the period between former and later slices in one TR. This is the case especially for long TRs with event-related design. However, in block design, the convolution of the box-car function permits us to take the mean and standard deviation of the whole block for 20 s. Thus, the period between the slices is not reflected in the analysis.
All participants were asked to keep their eyes closed during the recordings. The rosary was placed in the right hand of all subjects. All the subjects were given sugarless chewing gum, and they were instructed on how to perform the controlled chewing tasks. All data of the subjects were analysed using Statistical Parametric Mapping 12 (SPM12) software (https://www.fil.ion.ucl.ac.uk/spm/).
Pre-processing
The pre-processing included the following steps: converting the images in DICOM (.ima files) to NIFTI (.nii files) format, reorientation of the origin of the images according to the anterior commissure (reorientation), realignment and re-slicing of images (realignment), co-registering structural and functional images (co-registration), normalization of EPI with T1W template data (normalization), and smoothing the images.
First-level analysis
The design matrix included 4 conditions (SPONC, CONTC, RPM, resting) and movement data as multiple regressors. In 6-dimensional movement data, TRs, in which movements bigger than 3 mm for X and Y dimensions and 1.8 mm for z dimension were excluded from further analysis. Participants whose TR number was more than 10% of total TRs were excluded from the study (a total of 7 participants). After that, 4 contrasts for which the paired t-test was used were estimated as follows:
Second-level analysis
To carry out the second-level analysis, we used 3 contrasts as follows: 1) Con1 (SPC – Rest), 2) Con2 (RPC – Rest), and 3) Con3 (CC – Rest). The paired t-test was used for computing each of these contrasts. Thereafter, a conjunction analysis was used to determine the CPG. As mentioned above, activated region(s) within these contrasts which were part of both Con1 and Con2 and not activated in Con3 were accepted as a part of the regulatory regions for the rhythm of chewing movements.
Results
Whole-brain analysis
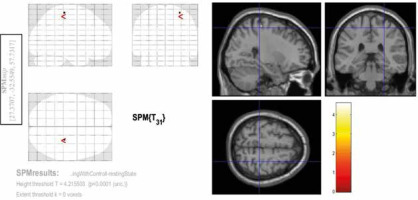
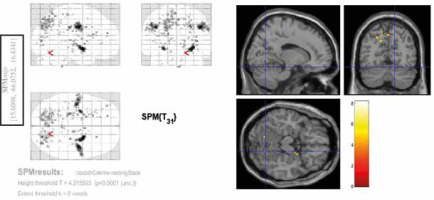
Among the 3 contrasts, the significant activities (FEW corrected, p < 0.05) were observed only in the third condition (Con3). This contrast was associated with rosary pulling movement. The chewing tasks did not yield significant activity at a corrected level. Tables 2-4 and Figures 2-4 indicate the activities of spontaneous chewing, controlled chewing, and rosary pulling, respectively.
Table 2
Results of the second-level analysis related to chewing task
Table 3
Results of the second-level analysis related to the controlled chewing task
| Cluster size(k) | t-value | Z-value | p-value (uncorrected) | x (mm in MNI) | y (mm in MN) | z (mm in MNI) | Brodmann area |
|---|---|---|---|---|---|---|---|
| 1 | 4.60 | 3.98 | > 0.001 | 28 | –28 | 63 | Right primary Motor (4) |
Table 4
Results of the second-level analysis related to the bead-counting task
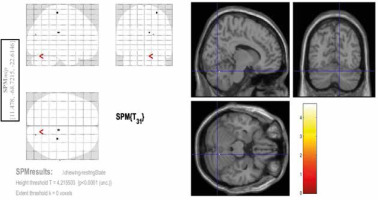
Figure 2
Activated areas in second-level analysis during the spontaneous chewing task. The coordinates of these regions are provided in the blue rectangle on the left
Conjunction analysis
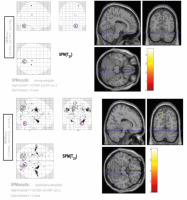
A conjunction analysis was further performed across 2 contrasts – spontaneous chewing and rosary pulling. The rationale behind the conjunction analysis was to determine the intercepted regions of the tasks. Due to the smoothing with 8 mm in each dimension, the interception between 2 tasks (the rosary pulling and the spontaneous chewing) was decided as if the activities of these tasks (contrasts of these 2 tasks in second-level analysis) were observed in the same location, i.e. a circle with an 8-mm radius. According to this criterion, there was one intercepted region between these contrasts. This region was in the superior part of the right cerebellum (Figure 5).
Discussion
The current study was specifically designed to demonstrate chewing networks. Although there have been several previous fMRI studies on chewing, their analyses were based on comparing the activations during chewing with the resting state [10-13]. This approach has limitations in terms of specifically revealing the pattern generator areas associated with chewing. In particular, the outcome of such analyses can also include other generators responsible for various rhythmic activities such as finger tapping, bead pulling, and breathing. On the other hand, we used both rhythmic rosary bead pulling and chewing and computed the difference from the records to identify the locations of the central pattern generator and chewing-related networks. Moreover, to locate the areas that are responsible for sensory and motor functions necessary for jaw movement during chewing, we asked subjects to open and close their jaws consciously and without rhythm. Through subtraction of the fMRI activations to rhythmic and conscious chewing, we identified the areas uniquely responsible for rhythmic actions of chewing or mastication.
The CPG is thought to be in the brain stem and responsible for the coordination of rhythmic movements [14]. Based on this, it is assumed that, as a rhythmic behaviour, coordination of chewing is controlled by a CPG [1]. While different animal experiments have shown the location of this region in the brainstem, the exact location in humans is yet to be identified [14]. Because it is a rhythmic movement like chewing, we also put the silent rosary pulling (also called prayer beads) in the fMRI protocol (to determine the intersections).
In this study, the focus was on the exact anatomical localization of the CPG and chewing-related areas. For this purpose, the activities during spontaneous chewing, rosary pulling, and controlled chewing tasks were determined and compared with resting. Later, a conjunction analysis was made to determine the CPG. The focus here was on the regions, where the revealed chewing activities did not associate with controlled chewing but related to rosary pulling. It was expected that the motor areas of the rosary pulling and the motor regions of chewing would not intersect except for the region that regulates motor rhythm. On the other hand, this region was also expected not to be active during controlled chewing. It is thought that the region that meets these criteria is associated with the CPG. Theoretically, the central rhythm generator can also be used for breathing, walking, and chewing [5-8]. Highly coordinated rhythmic and automatic movements can be regulated by the central nervous system, especially CPG [14]. Pulling a rosary is also a typical behaviour that is specific for each individual and is proceeded under the influence of the individual’s biorhythm, like chewing gum.
According to our results, the cerebellum plays a role as a CPG for chewing. The findings of our study revealed that the region that is common for both rosary pulling and chewing can be in a small area in the superior-medial part of the cerebellum. Also, this region was not activated during controlled chewing. Based on the literature and our experiences in daily routine practice, chewing or swallowing problems are frequently seen in patients with cerebellar masses or a history of cerebellum-related surgery or trauma [15].
The role of the cerebellum in the regulation of stereotypical behaviours is well known [14]. Notably, one of the most important indicators of dysfunction of the cerebellum in a neurological examination is the disruption of repetitive sequential movements (dysdiadokokinesia). Recent studies have demonstrated orofacial somatotopic projections within the cerebellum, thalamic nuclei, and sensorimotor cortices in humans [15-19]. Quintero et al. also showed significant functional connectivity between contralateral cerebellar hemispheres, cerebellum, bilateral sensorimotor cortices, left superior temporal gyrus, and left cingulate [15]. In a meta-analysis it was shown that when teeth are occluded the posterior cerebellum becomes activated [13]. On the other hand, these studies did not specifically focus on mechanisms underlying the rhythm of chewing.
Because the aim of the present study was to reveal the relationship between the CPG and chewing rhythm, as a methodology, a task-based fMRI study is obligatory. The explanation of the observed cerebellum activity instead of the brain stem can be interpreted as the reflections of the activities during the tasks that are designated specifically. The difficulties of collecting fMRI data from the brainstem or mastication-related areas are known [20]. It is difficult to detect the activity of the BOLD signal in a tight and compact area, such as the brainstem, which is a small area surrounded by bone structure. Moreover, the sensitivity to the disruptive effect of the chewing movement increases, and unfortunately the paradigm used in this study, due to the nature of chewing, poses a higher risk in terms of movement artifact. Nonetheless, the findings of this study will be facilitating.
The first limitation of the current study is the weakness of statistical power and clusters associated with chewing. Also, we did not have behavioural performance values from individual subjects such as accuracy scores and reaction times. Therefore, the findings do not provide a direct functional link between activated regions and final behavioural performance. The specific focus here was to understand how the rhythm of chewing is regulated rather than providing detailed temporal dynamics. Accordingly, to identify specific brain regions related to rhythmic motor activity, a task containing a rhythmic pattern but not related to chewing (e.g. pulling a rosary) was used as a control condition. Moreover, all the activations were contrasted with the resting state (i.e. Figures 2-4 and Tables 2-4). The data analysis approach also included connectivity analysis. The contrast between resting state and other tasks could not be presented because these analyses were not performed due to FMRI acquisition time constraints. Specific comparisons across resting, conscious jaw movement and rhythmic chewing were not performed because the common activation patterns in both spontaneous chewing and rosary drawing were important rather than different. Future characterization of other aspects of these motor activations can be informative.
Conclusions
Our results showed that the cerebellum plays a key role in the regulation of rhythmic movements and chewing. The revealed part of the cerebellum in the current study may represent regions related to motor coordination or CPG. It can be concluded, at least for chewing, that the CPG is carried out in coordination with a network, including the cerebellum, beyond the idea that it is an absolute centre that determines the rhythm in the physiological sense in the brain stem. We did not find any statistically significant activation or connection related to the brain stem. The reason for this situation may be the low number of our cases.


